LVMH breakout pattern and predictionLVMH is seated to do significantly well off the back of multiple positive trends for luxury market customers.
agressive mergers and positive financial markets all give steam to the ballistic profile.
prediction: LVMH will break 800 end+of+year
MC/N trade ideas

PT 882Where the wannabes and truly wealthy cohort spend. This is one stock you can hodl, the family that runs it and the craftsmen & women who build their product lines can't be matched. Their brands have been around longer than dirt. Asia, North America eat up their offerings.
Buying on pullbacks, eyeing entries around 732, but if June is a melt-up market especially for the European borses, LVMH breaks out.

Louis vuitton may give a cheaper entry in 3 Quarter?If the long term channel is not broken, then LVMH should make a correction in the next 2-6 month.
Still a trendy and bullish product, it may be a good entry in 3 Quarter 2021.
On longterm watch list, but not to enter right now.

Moet Hennessy Louis VuittonThese are levels that I'll be keeping an eye on when dealing with $LVMUY, and I'll revise as price action progresses.
I adapt to the change in money flow.

LVMH - fundamental - fair value: 305,8025/03/2021 19:30
-Markey cap: 279,848
Dividend: 279,848 * 1,08% = 3,022B
MC's dividend payments are covered by earnings.
30/06/2020 Dividend yield: 1,2% 30/06/2020
Dividend per share: €4,8
Earnings per share: €8,793
-PE ratio < 25: 59,61
-Profit margin > 10%: 10,53%
-Revenue growth past 5 years: yes (2020) 44,636m - (2016) 37,6m
-Profit growth past 5 years: yes (2020) 4,702m - (2016) 3,981m
-# shares outstanding declining: no. (2020) 504m - (2016) 502m
-Current assets > current liabilities: yes TA 108,671> TC 69,842
-FCF growth: yes (2020) 8,378 - (2016) 3,971
-price to FCF: €305,80
If I missed something pls let me know I'm just 16 and just want to learn as much as I can.
As much as I love LVMH my own research says the stock is overvalued. I hope I can help someone with this.
sources: yahoo finance & documents-financiers-2020_va_v2 (search investor relations lvmh - documents)


LVMH - opportunity This stock is to be watched next week. Indeed, it is in a delicate zone.
The opportunities will arise next week.
I will say a correction that will take place.... if not, the stock will break an important resistance and go even higher.
EURONEXT:MC

LVMHMIL:LVMH
Monitor Brand Reputation After #Lisa from Blackpink announced to be Global Ambassador for Celine for Year 2020"
She is A queen of Sold out from cent to Million when wearing it.

Artistic look"The stock is currently buying as long as it is inside the price channel, and any break down means a change in the trend and the possibility of its collapse

Louis Vuitton & Dow Jones Intermarket correlation between Dow Jones and Louis Vuitton , and the fractal correlation between Yield curve ( US 10Y - US 02 Y ) and NZD AUD shift forward 353 weeks ,this technique of moving forward is used by Larry Williams and aims to align the same Wyckoff phases of two out of phase, unrelated graphs. The Yield curve is the most powerful indicator for the stock markets, the inversion of the curve predicts the trend change, I have devised a fractal system that predicts the yield curve, moving the Nzd Aud chart forward I get a fractal correlation that has existed for 25 years, will it continue to exist? if the answer is yes then it is telling us that the yield curve will change direction, but if it changes direction it means that the dow jones will also change direction, if this "law" is maintained, if the fractality is maintained I also have the information that will change the trend for Louis Vuitton too.


LVMHHello everyone,
A good opportunity has been detected on the LVMH stock.
After strong upward movement on the LVMH stock, the price
found resistance on a strong resistance level, pulled back and
is currently correcting to the downside.
We are expecting the price to reach approximately the 390.500 price
area, where we have a 50.0% Fibonacci retracement level, a support
point, as well as the 100 Moving Average and the 200 Moving Average.

MC is forming Head and Shoulder It is now forming the right shoulder. When price drops to 365, the Head Shoulder pattern will be complete. Expect to drop to 314 if the pattern is confirmed.

LVMH Long IdeaLogic: in confirmed uptrend following steep correction & 2 month sideways consolidation.
Entry: €365 or better, (ideally to be bought on a pullback into 200D EMA in the €360-€365 area).
Stop: €343
Risk: -6.03%
Target: €403 initially (gap close), longer term €426, yearly R1 area.
Gain: +10.41% & longer term +16.71%
Note: longer term play in the strongest luxury name.

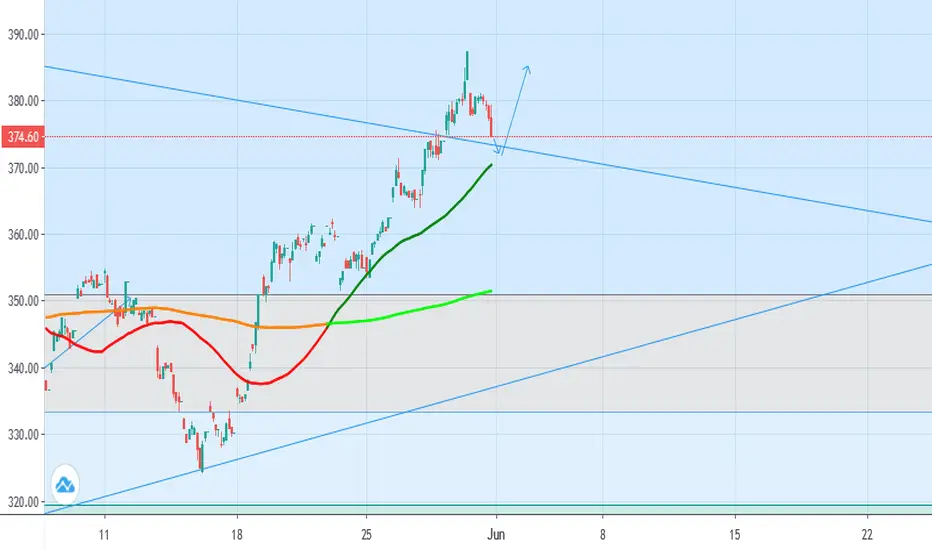


LVMH Bullish ScenarioAnalysis :
Price Breakout our resistance First resistance Area wish become a support area,
Price beakout above a descending channel,
The breakout was followed with huge volume
Scenarios:
Buy :
Wait For breakout confirmation,
Wait for the price to bounce on the upper bound of descending channel,
Wait for the rejection candle pattern to form e.g. bullish engulfing , pinbar , Inside bar etc,
Initiate BUY order,
Targets are TP1 to TP3,
SL Under the support Area.
/!\** Disclaimer**/!\
The scenarios described in this analysis are subject to change at any time without prior notification. This analysis is provided as a decision support.
Traders! | if you like my analysis and it supports you in your trading decisions, please say it in a comment so we can manage the trade together.
Thanks.

