MRNA: Ready to break out!Here you can see a C&H pattern and if, and if, we close above the green line today, we'll be good to go. Since the RSI is also near 70 and the volume is decreasing we might see some consolidation after the break out before hitting the first target.
MRNA trade ideas

Moderna Inc. stock - "The end of a pandemic Stock" Moderna, a drugmaker with just a single product to its name
, has become perhaps the best-known biotech in the world over the past four months, with nearly 100 million doses of its Covid-19 vaccine administered in the U.S. alone.
Shares of Moderna Inc. MRNA, +5.56% slid 9.72% to $111.40 Monday, on what proved to be an all-around favourable
trading session for the stock market, with the NASDAQ Composite Index
#moderna #mrna #Mrna

moderna ideamrna finally broke out of that long resiatnce it was holding it down from febebruary . mrn will be Bullish as long as that support holds 186 i dont know if mrna will retrace and retest that suppoer, or will it just keep going up. if it does you want to go long near 186 , and go short below, as of now its bullish i will be waiting for an entry but not buying at this levels its getting overbought with some divergences showing up on the 4hr,

MODERN ASCENDING TRIANGLE BREAK OUT.7 MONTHS OF ASCENDING TRIANGLE, THE BREAK WAS AT JUNE 3 WITH THE CANDLE CONFIRMING. POSSIBLE DESTINATION 250USD


MRNA (Moderna) facing a major resistance level MRNA has been in an uptrend that has taken it to a major resistance level at $190 but it seems it will bounce back cause MACD is not supporting the trend. Andrews Pitchfork is also showing that the median line is acting as resistance and the stochastic is so high, indicating that the trend is about to end. I guest it will go back to $170. This stock is a sell for me right now.


BreakoutThe breakout is not complete yet as the week is not over. But the momentum is high so that we can expect the price to keep the gains.


Moderna: Target Range Exceeded. Close TradeModerna has exceeded our target range, now trading at $186.21. Traders could look to close.
Profit: ~$17

MRNA Bear Call spreadSold 187.5/190 call spread
8 DTE, 20% ROI, 6.25% above underlying at fill
MRNA hourly chart at strong aggressive imbalance at hourly RBD zone, at 4h DBD zone
Strong imbalance above it at the 186 liquidity shelf.
At Hourly trend is up, removing supply zones, running into the 4h zone.
Anticipated direction is sideways from the 4h interaction and strong selling imbalance
Hourly candles are getting smaller and tighter as rally continues, but still in an uptrend.
I'm seeing Last price print at .58 and I'm not sure who the hell is getting those prices because I never seem to be able to.

MRNA - GREAT Buy Opportunity, IF ... !!!Hello! Friends,
-This would be a great Buy Opportunity, IF NASDAQ:MRNA breaks up the Daily Resistance line at $164.00 (with a WHOLE DAILY Candle) !!


Technical Trade Setup: Moderna Inc (MRNA)- Trading within channel
- Pivot regained
- Above 'cloud' of EMA's
- Recently back to higher lows
Trade Levels:
Buy Range: $166-$169
Stop-loss: $158
Target Range: $180-$184


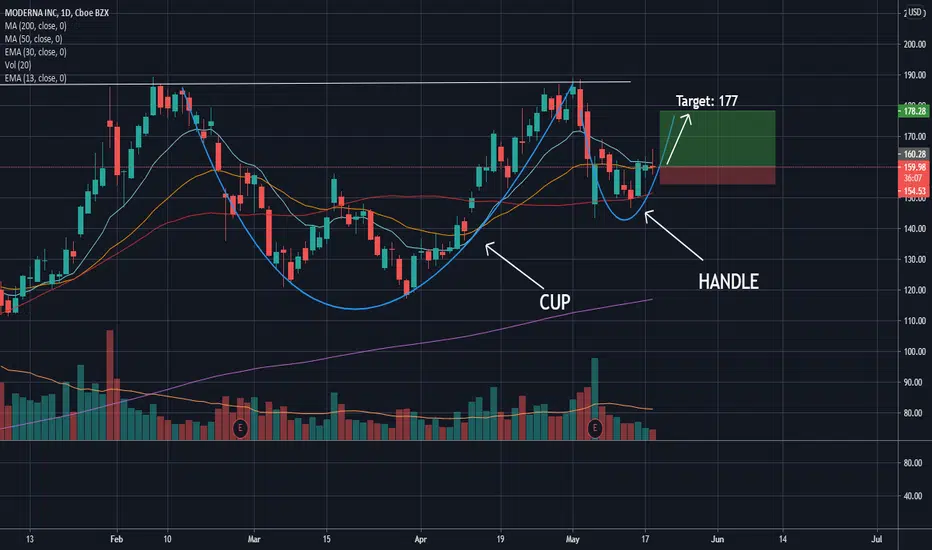
MRNA Round up, CUP and HANDLEMRNA is forming a rounding formation. It is now forming the handle of the upward trend after forming the cup. The handle of this formation has pulled back to the 61.8 fibinocci level and now looking to remount to complete the formation where 177 will be resistance.