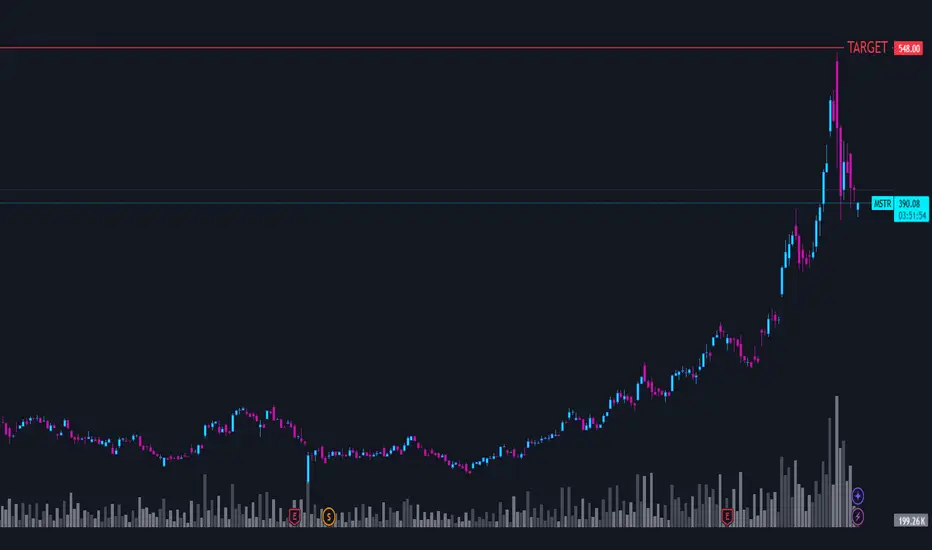
MSTR $548 BUY ARGET Our algo generated a $548 buy target. Our targets have 100% accuracy. Always follow your own strategy.
Best,
Magellan Algo Team
MSTR trade ideas
MSTR is not a buy...Chart speaks for itself; huge volume near the top, a clear ABC structure that has now met all targets and has a full wave count and a topping tail in progress...


The hysteria, delusion, and greed last week was so cringe.Watching the Microstrategy circus last week was such a obvious short. This is a ponzi. Here is the roadmap. Y'all thought NASDAQ:SMCI was bad, at least they have a REAL product. Send this to the GULAG!

An Intriguing Bitcoin PlayRecent Performance: MicroStrategy (MSTR) has experienced a dynamic trading
environment tied closely to the volatility of Bitcoin. The company's recent
price of 421.88 reflects investor sentiment influenced by macroeconomic
trends and Bitcoin's trading patterns. As MSTR focuses on its Bitcoin
acquisition strategy, its market performance is inherently linked to the
digital currency's fluctuations, drawing both potential investors and
skeptics.
- Key Insights: Investors should note that MSTR's aggressive Bitcoin investment
strategy creates a unique opportunity but also significant risk. The
relationship between Bitcoin's price movements and MSTR's equity performance
is crucial for trading decisions. A potential upside exists if Bitcoin
trends positively, especially if it approaches critical psychological
levels. Investors should consider their risk tolerance and market conditions
before acting.
- Expert Analysis: Experts suggest that MSTR's Bitcoin-centric model is a
pioneering move that could redefine corporate asset management. Market
sentiment is leaning cautiously optimistic, given the potential for high
returns in a bullish Bitcoin environment. However, the consensus remains
that the volatility of cryptocurrency poses serious risks, which must be
factored into any investment decision.
- Price Targets:
- Next week targets: T1: 462.00, T2: 475.00
- Stop levels: S1: 374.40, S2: 369.90
- News Impact: Recent developments regarding regulatory frameworks affecting
cryptocurrencies could significantly influence MSTR's market dynamics.
Ongoing conversations around corporate investments in digital assets reflect
a shifting landscape that may provide further opportunities for MSTR.
Investor sentiment may become positively skewed as analysts and stakeholders
monitor Bitcoin's trajectory and regulatory impacts closely, creating a
conducive environment for MSTR to thrive if managed prudently.

MSTR. Long?Tough call on this one. It is at all time highs and going off fibs. It rejected perfectly at my projection off the yearly move to the high from the past. Now it must hold here or the level below. Not to confident in that though. I personally wouldn't touch this stock for a long until $100 range. Not going to short this or take a long until we hit major support. If I miss out that is fine!

MSTR Explosion IncomingI've been talking about my change to being bullish on BTC a lot lately and I've been looking at some ways to get long exposure. MSTR owns a lot of Bitcoin and plan to keep buying it. The company will continue to increase in value as BTC rises based on that alone, not to mention all the other revenue channels.
I don't know if I'd call this a cup handle, but it does have a lot of the characteristics. Large rounding bottom followed by a downtrend/bull flag after. It's currently near ATH and I expect it to break above soon. The problem is that it's already fairly overextended, however if it does break ATH it will most likely lead to another explosive leg up. It's a risky proposition at the moment, it could end up with a double top at ATH, but trade comes without risk.

THE FASTEST UTURN IN HISTORY ON MY ACCOUNT; BULLISHAs we explained last week, the break of 540 sends it down back into the 300s before making a slight recovery towards the end of the week. Momentum is with Bitcoin and the all-exclusive 100k break. If this is about to happen on the latest dip, we could see another gap this coming Thanksgiving week of Monday.

Can MicroStrategy really go higher?Huge resistance at this level!
Can MSTR continue this explosion in price?

MSTR - BUYProbability for MSTR Returning to $453:
in the current environment, MSTR can return to its previous highs if Bitcoin continues its upward trajectory and macro conditions remain favorable. However, the stock remains highly speculative, and traders should watch Bitcoin closely as the primary driver.
1-2 Weeks: ~50% — Needs Bitcoin above $40k. Resistance likely.
1-3 Months: ~70% — Bitcoin rally continuation and institutional interest help.
6-12 Months: ~80% — Long-term crypto bullishness increases chances.

Don't Change That Channel Part 2I did not make the first channel high enough. So, this is an update. I threw in an auto pitch fork that seems to validate the thesis.
We did take a run out the top of the channel and the shorts pushed the price back inside our seemingly durable path. Let's see what happens.

MSTR ELIOT to $619.10 in ASTRONOMICAL SHORT SQUEEZE+CONTINUATIONPlease let me know if you have any questions from what I have in the chart! Like, comment, subscribe!
I am the Stock Wrangler.
NASDAQ:MSTR

Gap must be filledDear retail investors, markets are not free lunches. There is nobody dumb enough to buy at these prices. That is not an insult, that is just how the markets work, it is their reality. Greed must turn into fear for a bull market to exits. The higher something goes up without a massive correction, the lower the all time high potential. A likely retest of $150-$200 is almost guaranteed.

It is what it isMass delusions are usually not sustainable. Trading 3x above btc holdings, insiders selling at fastest pace, btc rally is delusional and driven by short term idea of a Trump Trade which will be crushed after his inauguration when we face the reality of harsh negotiations with Russia. Saylor is another Sam.

MicroStrategy’s $31.2 billion (net of $4.2 billion debt) $BTC MicroStrategy’s stock price typically reacts more aggressively than the price of bitcoin due to: Leverage: The company’s strategy effectively acts as a leveraged bet on bitcoin due to its financing structure.
Investor Sentiment: Rising bitcoin prices boost enthusiasm for MicroStrategy’s strategy, often driving its stock price higher by a multiple of bitcoin's price increase.
Given MicroStrategy’s past correlation to bitcoin price increases, the stock could see a higher-than-50% surge, potentially amplifying the company’s market capitalization far beyond the proportional increase in bitcoin prices.
Value of Bitcoin Holdings:
Current Bitcoin Holdings: 279,420 bitcoins
Value at $100,000/Bitcoin: $27.942 billion
Value at $150,000/Bitcoin: $41.913 billion
This is a $13.971 billion increase in the value of its bitcoin holdings.
NASDAQ:MSTR is valued at around 80 Billion +/-
The strategy depends on a buoyant market for bitcoin and irrational enthusiasm for MicroStrategy’s stock.

Textbook false break outSo far, looking like a textbook false breakout, and back inside the purple channel!
Rejection.
One more trading day left to confirm short position initiation. Tight stops here.
NASDAQ:MSTR

$MSTR #Spicy #Broadening Formation PT; $666 MSTR is a MONSTAR lately AAAANNNNDDDD a LOT of sketch occurred today.
7am; CEO says "We're gonna need a bigger ship"
930am: Price is Gapping up 10%+ AGAIN
930ish: Citadel Announces Short
403pm: CEO announces NASDAQ:MSTR Completes $3 Billion Offering of Convertible Senior Notes Due 2029 at 0% Coupon and 55% Conversion Premium
PS: The SEC Chair announced he will be resigning in a couple months...
"Shakeouts B4 Breakouts" - Prophecies

Micro-tragedy RecapToday was nuts at the MicroStrategy part of town. Let's just debrief the madness.

1-2-1-2 $mstr Microstrategy Playing outFixed wave targets for later waves vs. prior post.
Self-explanatory - Elliot Wave, Nested 1-2's for MSTR - Time isn't accounted for in future waves... but assume through bitcoin cycle late into next year
Chart annotation shows bullish but we are in Wave 4 to at least 280, as low as 100 but given the bullishness of the market expect between 180-280 before next move up... lower she goes pulls end targets lower... analysis assumed .236 - .38 retracements for remaining 4's and 5's.
Wave 5 targets were .68 of wave 3... The deeper the wave 4's the lower the 5 targets will be

I can't unsee this triple 1-2 playing out $mstrSelf-explanatory - Elliot Wave, Nested 1-2's for MSTR - Time isn't accounted for in future waves... but assume through bitcoin cycle late into next year

$MSTRupdated
just wanted to show off how precise one can actually be when they use tools correctly,
invalid above todays high

MSTR Alert: Trend Reversal Sparks October Rally!The NASDAQ:MSTR chart has just triggered a weekly signal, marking the first time we’ve seen a reversal signal alongside a fresh trend signal right at the range lows.
The trend appears healthy, and if October mirrors the previous months, I expect a rise in the crypto markets. While I'm not overly optimistic about Bitcoin's price movements just yet, I’ll be satisfied as long as it finishes the month positively.
A valid reclaim of $150 would lend significant strength to the uptrend.
Invalidation is set at $119, so manage your risk wisely.
For take-profit areas, consider $270 and $540 once the upward movement begins.
Keep in mind that ETF flows have been zero or negative, while NASDAQ:MSTR has been purchasing an average of $70M in BTC daily over the past week. MicroStrategy typically buys during bear markets or significant retracements. The key thing to watch now is how the market reacts once this buying subsides.

MSTR to spike higher, then pullback to $364MODs have suggested that I provide more detail about the picks I make.
Sorry. I'm not as verbose as y'all, and I don't like things to be complicated.
My trading plan is very simple.
I buy or sell at top & bottom of parallel channels.
I confirm when price hits Fibonacci levels.
So...
Here's why I'm picking this symbol to do the thing.
Everybody buying stocks like crazy. 10 trading days ago, price was $270. Now nearly $500. My charts say price tops out at $519 area, then falls back to $364.
Price above top of channels (period 100 52 39 & 26)
Stochastic Momentum Index (SMI) at overbought level
VBSM is spiked positive
Price near 4.618 Fibonacci level
In at $518 area
Target is $3640 or channel bottom
