$MSTR Continues on last weeks path!NASDAQ:MSTR continues to breakout above the channel after a retest as support.
High Volume Node at $440 may proof tough but if price breaks through we could see a strong FOMO induced breakout into price discovery.
Analysis is invalidated below the channel at $358.
Safe Trading
MSTR trade ideas

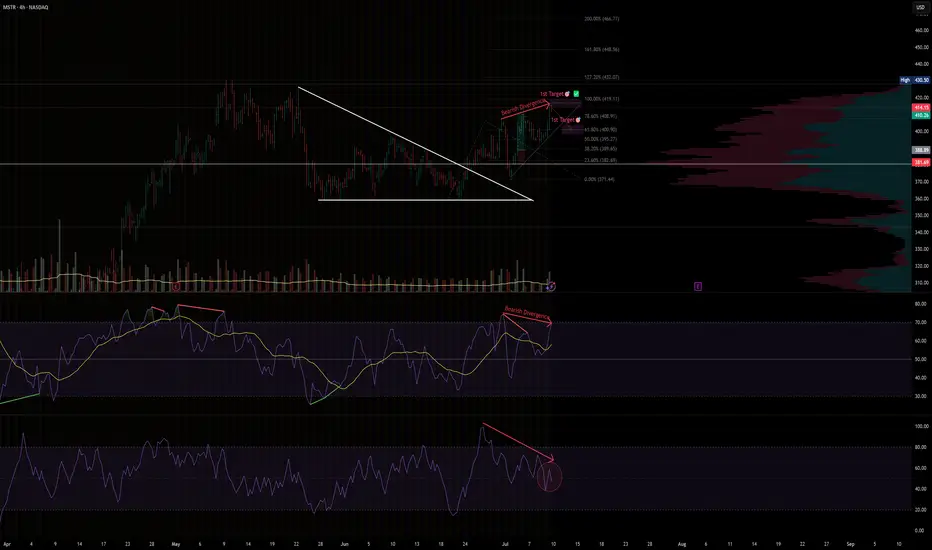
MSTR · 4H —Early Bearish Divergence Detected Near Key Fib TargetSetup Breakdown
Price recently broke out from a falling wedge and hit both technical targets — first at ~$409 (78.6%) and then ~$419 (100%).
However, momentum is weakening despite price hovering near the highs.
We're now seeing early bearish divergence on multiple timeframes and oscillators, signaling potential reversal or pullback.
⚠️ Bearish Signals
RSI Divergence
Price made higher highs while RSI made lower highs — classic bearish divergence.
Double confirmation
Both RSI with MA and pure RSI show declining momentum.
Volume drop
Price is rising but volume is not following — another early warning sign.
🔻 Potential Breakdown Trigger
If price closes below $407–405, that would break short-term structure and confirm the divergence risk.
Watch for RSI to drop below 50 and volume to spike on red candles — that would likely accelerate the correction.
📉 Downside Zones to Watch
$400
=> 61.8% Fib retracement + consolidation base
$395
=> 50% Fib retracement
$389
=> 38.2% Fib retracement + prior breakout support
✅ Summary
Divergence is still early but meaningful — momentum does not support current price highs.
A breakdown from current levels could open a short window down to $386 or even $371 if confirmed.
Watch RSI + volume + candle structure for confirmation before acting.
Disclaimer: This is not financial advice. Always manage your own risk and follow your trading plan.
#MSTR #BearishDivergence #RSI #Fibonacci #MomentumShift #VolumeAnalysis #TradingView #TechStocks #4HChart
MSTR Heating Up! Options and Intraday Setup Ahead for July/10🔥GEX-Based Options Analysis (Macro Sentiment):
MSTR is showing strong bullish momentum fueled by aggressive options flow. The key GEX levels show:
* Gamma Wall / Max Resistance is at $405–$410, aligning with current price action.
* Positive GEX Flow continues to build up toward $425, where the 3rd CALL Wall sits.
* On the downside, minimal PUT Wall pressure is seen until $390, offering a strong base of support.
💡 Options Setup Ideas:
* Bullish Setup: If MSTR holds above $405–$410 zone, consider a 415C or 420C for 07/12 expiry, targeting a move to $422.50–$425.
* Bearish Reversal Risk: If MSTR breaks back below $400 with volume, risk shifts to downside with $390 PUTs back in play.
IV is still low (IVR 7.4, IVx below average), which supports buying premium over selling.
1H Price Action & Intraday Setup:
On the 1-hour chart, MSTR just broke out of a compression wedge after forming a clean CHoCH and BOS (Change of Character and Break of Structure). Price is now flagging just below the purple supply box, creating a textbook bullish continuation setup.
* Key Levels to Watch:
* Resistance: $414–$416 (if broken, opens room to $422+)
* Support: $404–$408 (recent CHoCH zone and breakout base)
* Deeper Support: $396–$400 (prior structure, invalidation if lost)
📈 Intraday Trade Plan:
* Bullish Scenario:
* Entry: Break and close above $416
* Target: $422.50–$425
* Stop: Below $408
* Pullback Long:
* Entry: Retest of $405 with bullish reaction
* Target: $415+
* Stop: Below $400
* Bearish Reversal (low probability):
* Entry: Breakdown below $400
* Target: $393–$390
* Stop: Above $405
My Thoughts:
MSTR is building strength with both option sentiment and price structure aligning for continuation. It’s one of the cleanest bull flags on the board right now. Keep eyes on the breakout zone at $414–$416 — a push through with volume could trigger a gamma squeeze toward $425.
This analysis is for educational purposes only and not financial advice. Always manage risk before trading.


$MSTR ONCE IN A LIFETIMEINSIDE MONTH BREAKOUT is here
Long above 417 targeting 500+
LOW RISK setup HIGH REWARD potential I will alert ALL HERE NO CHARGE all I ask is DROP A LIKE

$MSTR Megatrend Continuation?NASDAQ:MSTR is market leader in the CRYPTOCAP:BTC strategic reserves strategy and has set the benchmark.
After a nearly 20x rally profit take is exceptive, price has held up extremely well through the last 6 months only dropping to the .236 Fibonacci retracement and weekly pivot. As Bitcoin continues into price discovery expect the MSTR rally to continue with renewed tailwinds.
It is an extremely hated stock as well as its collection of yield baring derivatives. The keeps the social mood / sentiment low which could prove further tailwind for growth.
I am looking at a terminal target this cycle of around $1500 at the R5 weekly pivot.
Safe trading

Strategy(mstr) Medium Term ProjectionSentiment will cause this impulse in price, will reach at least 600 per share maybe even more.
I will update this analysis periodically.

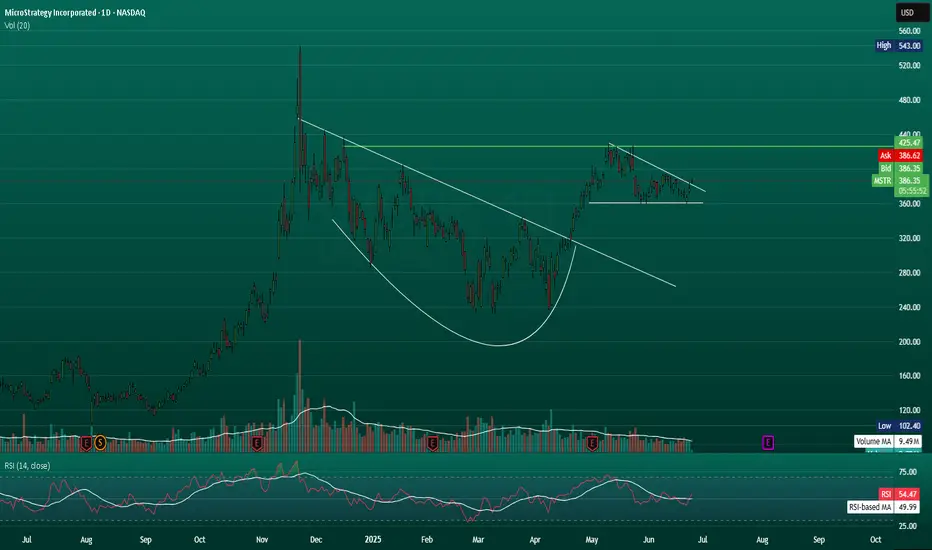
(MSTR) – Cup & Handle Brewing Inside a Rising Wedge?MSTR is currently trading around $384, consolidating just under a significant historical resistance near $432, the neckline of a potential cup and handle formation. Price action has respected a rising wedge channel since mid-April, making higher highs and higher lows with relatively muted volume – a classic consolidation before a breakout... or breakdown.
The Cup and Handle – Brewing or Breaking?
Cup Formation: The cup ranges from the November 2023 high down to the January 2024 lows and back up, completing the round base at ~$432.
Handle Formation: Price has been forming a descending handle within the rising wedge, staying above key moving averages.
Breakout Target (Cup & Handle):
Cup depth: ~$432 - ~$290 = $142
If confirmed breakout occurs above $432, measured move takes us to ~$574
Bullish Validation:
Close above $432 on strong volume confirms breakout.
Look for volume spike + strong Heikin Ashi candles with little/no wicks below body.
Momentum indicators (MACD crossover + RSI breaking 60+) would further confirm.
Bearish Breakdown Scenario:
A confirmed breakdown below $360 (channel support + BB midline) would shift momentum bearish.
$352 (100 EMA) is the next critical level — if this goes, the structure weakens significantly.
Watch for a test of $332, which aligns with both Bollinger Band support and a horizontal demand zone.
A full breakdown of the channel and cup handle structure could see price revisiting the base of the cup near $290–292, where the 233 SMA and major historical support converge.
Indicators:
MACD: Bullish crossover forming, histogram slightly positive. Needs stronger momentum to sustain rally.
RSI: Neutral zone (~52). Not overbought or oversold – room to move in either direction.
Volume: Volume is decreasing, typical before a big move. A spike will hint at direction.
Final Thoughts
MSTR is at a pivotal technical crossroads. The broader setup shows a cup and handle formation in progress, with the handle unfolding inside a well-defined ascending channel — a bullish structure that supports continuation if price holds key levels.
To confirm the cup and handle, bulls need to see a clean breakout and close above $432, preferably on increased volume. That would validate the pattern and open up a measured move target toward $574+.
Meanwhile, the ascending channel remains intact, guiding price higher with higher lows and highs. To maintain this structure, MSTR must hold support above $360–352. A sustained bounce off this zone would reinforce both the channel and the handle as part of the bullish setup.
However, if price breaks below $352 and especially closes below $332, it would invalidate the ascending channel and begin to threaten the cup’s base structure. A breakdown toward $290–292 would likely follow, where the entire pattern would need to be reassessed.
Until a breakout above $432 or a breakdown below $352–332 is confirmed, this remains a neutral “watch zone”. Swing traders should be cautious, but keep alerts set, a move in either direction could be powerful and directional.

Quick View: $MSTR
- The daily chart sees the price testing the ema 50d as support while all the other EMAs are in a bullish scenario. Great Bullish pattern. Looking for an action that creates a new positive price action

MSTR Long - high squeeze potentialMSTR recently made 20-day highs (green candles) and then sold off towards the 20D EMA trendline. Meanwhile, looking at a proxy of net buying/selling (bottom panel), there has been neither significant buying nor selling activity.
All of this is setting up the potential for a squeeze higher.
Needless to say, please manage your risks carefully and consider setting a stop-loss upon MSTR closing at a 20-day low (red candle).
Both indicators (Breakout Trend and Buying/Selling Proxy) are available for free on TradingView.

Crypto Stocks to the moon?NASDAQ:MSTR , along with numerous other publicly traded companies with significant cryptocurrency exposure, experienced a remarkable rally during the previous crypto bull market. There are indications that a similar dynamic could be emerging once again.
#bitcoin #crypto #stocks #stockmarket #portfolio

MSTR Daily Chart Analysis: Key Price LevelsThis analysis focuses on the daily chart of MicroStrategy (MSTR), highlighting significant price action, identified patterns, and predefined support and resistance levels.
Price Action Overview:
Starting from late 2024/early 2025, MSTR experienced a notable downtrend, characterized by a series of lower highs and lower lows, leading to a test of the "Strong Support" zone, illustrated by the grey shaded area around the 230-240 price level.
Following this decline, the chart illustrates a distinct "W" pattern formation, often interpreted as a potential bullish reversal signal. This pattern culminated in a decisive breakout above the overhead descending trendline (marked in red), indicating a shift in market structure from downtrend to a more bullish posture.
Post-breakout, the price saw a strong upward move into May. A subsequent pullback found significant support within the "Key Support 360 to 370" zone, which appears to have acted as a crucial pivot point, preventing further decline. More recently, the price has consolidated and is current
ly trading above the "1st Support 390 to 400" area.
Key Levels Identified:
Key Resistance / Target Level (435 to 450): The red shaded area at the top represents a significant overhead resistance zone. This level aligns with a previous peak and is identified as a potential target if the current upward momentum continues.
1st Support (390 to 400): This green shaded area serves as the immediate support level. The price has recently traded above this zone, suggesting it has transitioned into a new support area after potentially acting as resistance previously. Sustaining price action above this level would be a key observation.
Key Support (360 to 370): Located below the first support, this green zone has demonstrated its importance in recent price action, coinciding with the lows seen in June, where buyers stepped in.
Feb 50% Retracement & Flip Zone (330 to 340): This lower green shaded area represents a significant structural level, identified as a potential 50% Fibonacci retracement level from a previous move and a historical "flip zone" where price action shifted between support and resistance.
Strong Support (approx. 230-240): The grey shaded box at the bottom indicates a strong historical support level, representing the lowest point observed within this timeframe, acting as a critical long-term floor.
Current Observations:
The current price of 405.09 indicates MSTR is trading above its immediate "1st Support 390 to 400" zone. The dotted blue line on the chart illustrates a hypothetical continuation of the current upward momentum, projecting a potential move towards the "Key Resistance / Target Level 435 to 450."
Disclaimer:
The information provided in this chart is for educational and informational purposes only and should not be considered as investment advice. Trading and investing involve substantial risk and are not suitable for every investor. You should carefully consider your financial situation and consult with a financial advisor before making any investment decisions. The creator of this chart does not guarantee any specific outcome or profit and is not responsible for any losses incurred as a result of using this information. Past performance is not indicative of future results. Use this information at your own risk. This chart has been created for my own improvement in Trading and Investment Analysis. Please do your own analysis before any investments.

MSTR breakout time? NASDAQ:MSTR attempting to breakout of the channel on the 4th test, the high probability magic number!
Channel pattern target is 9% move to $426. The High Volume Node EQ at $438 is a more likely area of resistance if we get this love.
Safe trading

Is MSTR overvalued?Pros of Investing in MSTR
Massive Bitcoin Reserves
-Owns ~582,000 BTC (~2–3% of total supply), making it a levered proxy to Bitcoin. Any BTC rally strongly benefits MSTR.
Aggressive Treasury Strategy
-The company continuously issues equity, preferreds, and convertible bonds to buy more Bitcoin. This "flywheel" can compound Bitcoin exposure rapidly.
Strong Momentum & Index Inclusion
-Added to Nasdaq‑100, which boosts trading volumes and visibility. Momentum is supported by Bitcoin's surge.
High Analyst Targets
-Some bullish forecasts set ambitious targets—median around ~$550, with upside to $1,000+ if Bitcoin soars.
Cons & Risks
Extreme Volatility Tied to Bitcoin
-MSTR isn’t a business stock—it’s highly leveraged to Bitcoin’s price moves, showing wild price swings.
Leverage & Debt Repayment Risk
-Reliance on convertible bonds and preferred stock introduces liquidity risk if BTC price falls, potentially triggering a “death spiral”.
Accounting & Tax Exposure
-New FASB rules may force MSTR to pay corporate alternative minimum tax on unrealized gains, potentially running into billions by 2026.
Minimal Software Business
-MSTR’s original BI software arm is now overshadowed by Bitcoin holdings. The market values it mainly as a crypto vehicle—not a tech company.
High Valuation Premium
-Market cap is ~2× its BTC holdings, a steep premium relying on perpetual BTC appreciation and investor sentiment.
-Disclaimer: This analysis is for informational and educational purposes only and does not constitute financial advice, investment recommendation, or an offer to buy or sell any securities. Stock prices, valuations, and performance metrics are subject to change and may be outdated. Always conduct your own due diligence and consult with a licensed financial advisor before making investment decisions. The information presented may contain inaccuracies and should not be solely relied upon for financial decisions. I am not personally liable for your own losses, this is not financial advise.

Time to make a move. Microstrategy upside forecast could be 80%Let's perform a technical analysis of MicroStrategy (MSTR) stock, focusing on Time-based Fibonacci analysis, the potential for a Cup and Handle pattern with a 50% upside target, and briefly touching on Williams Alligator strength.
As of Friday, June 27, 2025, at 9:36:57 PM PDT, here's an analysis of MSTR:
**Current Price & Performance:**
* **Last Price:** $383.88 (as of 4:00 PM ET on June 27, 2025)
* **Today's Change:** Down $2.75 (-0.71%)
* **After-hours price:** $384.45 (up 0.14% as of 7:59 PM ET on June 27, 2025)
* **Previous Close:** $386.63
* **Today's Range:** $383.41 - $397.99
* **52-Week Range:** $102.40 - $543.00 (Note: MSTR reached its all-time high on Nov 20, 2024, at $543.00)
---
### **Time-Based Fibonacci Analysis**
Time-based Fibonacci analysis (also known as Fibonacci Time Zones or Time Extensions) aims to predict future points in time where significant price reversals or changes in trend *might* occur. Unlike price-based Fibonacci retracements/extensions, which focus on price levels, time-based Fibs are vertical lines drawn on the chart at specific intervals (Fibonacci numbers like 1, 2, 3, 5, 8, 13, 21, 34, etc.) from a significant swing high or low.
**How to apply (Conceptually):**
1. **Identify Key Swing Points:** You would select two significant swing points (e.g., a major low and a subsequent high, or vice versa) on the daily chart.
2. **Draw the Zones:** The charting software then draws vertical lines at time intervals corresponding to Fibonacci numbers from that starting point.
**Interpretation for MSTR (Conceptual):**
Given MSTR's highly volatile nature and strong correlation to Bitcoin, applying time-based Fibonacci is more speculative than price-based methods. However, if we were to apply it:
* **Starting Point:** A logical starting point could be a significant low where a new uptrend began (e.g., the 52-week low of $102.40 from July 2024). Another key point could be a major turning point, like the all-time high of $543.00 in November 2024.
* **Potential Relevance:** The vertical lines at Fibonacci intervals after these points *could* indicate periods where MSTR's momentum might shift, or a new leg of a trend might begin/end.
* **Current State:** Without knowing the exact start points used, it's hard to pinpoint specific upcoming time targets. However, if MSTR is currently in a consolidation phase (as suggested by the Cup and Handle discussion), a time-based Fibonacci analysis might highlight a potential *date range* when this consolidation could end, and a new trending move might initiate. It's often said that "something" is likely to happen "at" or "near" these time points, whether a reversal, acceleration, or consolidation.
**Important Note on Time-Based Fibs:** They are often considered more subjective and less precise than price-based Fibonaccis. They are best used as a confluence tool with other indicators.
---
### **Cup and Handle Forming for 50% Upside**
A "Cup and Handle" is a bullish continuation pattern that signals a period of consolidation followed by a potential breakout.
* **The "Cup":** A "U" shaped formation where the price declines, bottoms out, and then rises back to approximately the original level. The cup's formation can range from 1 to 6 months.
* **The "Handle":** A smaller, shorter consolidation pattern (often a flag or pennant) that forms on the right side of the cup, typically with a slight downward drift. The handle typically lasts 1 to 4 weeks and should form in the top half of the cup.
* **Breakout:** A decisive move above the resistance level created by the top of the cup and handle, on increased volume, confirms the pattern.
**MSTR - Is a Cup and Handle Forming?**
Recent analysis has indeed highlighted the potential for a Cup and Handle formation on MSTR's chart. This implies:
* **The "Cup":** MSTR saw a significant run-up to its all-time high of $543.00 in November 2024, followed by a pullback and then a recovery, potentially forming the "U" shape of a large cup. The stock's journey from its 52-week low of $102.40 to its high and subsequent retracement/recovery could be outlining this larger cup. The duration of this "cup" would be several months.
* **The "Handle":** The current price action (around $383.88) comes after MSTR has seen a recovery from its lows, but is still significantly below its all-time high. The consolidation MSTR has been experiencing in recent weeks/months after its peak (e.g., trading between roughly $300 and $400 or higher) could be forming the "handle" of this larger pattern.
**50% Upside Target:**
The upside target for a Cup and Handle pattern is typically measured by the *depth of the cup* projected upwards from the breakout point.
* **Depth of the Cup:** If we consider the peak of the cup around $543 and a significant low point (perhaps the bottom of the "U" around $300-$350), the depth could be substantial (e.g., $543 - $300 = $243).
* **Breakout Level:** The breakout level would be the previous high of the "cup" (around $543.00).
* **Projected Target:** If we use a depth of, say, $243, and add it to the breakout level of $543, that would imply a target around $786. This figure is significantly higher than the current price of $383.88.
A 50% upside from the current price of $383.88 would put the target at approximately **$575.82**. This target is plausible within the context of a Cup and Handle breakout, especially if the cup's depth and the breakout confirm such a move. Reaching $575.82 would also put MSTR above its previous all-time high, indicating a new phase of price discovery.
**Confirmation:** For this pattern to be confirmed, MSTR would need to:
1. Continue forming a clear "handle" consolidation without breaking down significantly.
2. Break out convincingly above the resistance level (the rim of the cup, potentially around the $500-$540 range) on strong volume.
---
### **Williams Alligator Strength (Daily Chart)**
The Williams Alligator consists of three smoothed moving averages: Lips (Green, 5-period), Teeth (Red, 8-period), and Jaw (Blue, 13-period).
**MSTR's Alligator State:**
* MSTR has experienced significant volatility and swings. After its all-time high in November 2024, it saw a substantial correction, meaning the Alligator's mouth would have likely been open downwards (Blue > Red > Green).
* More recently, MSTR has been in a recovery/consolidation phase.
* **Current State:** Given today's slight down day (-0.71%), and the general consolidation, the Alligator's lines are likely **converging or intertwined ("sleeping")**. This indicates a non-trending period or sideways movement, where the price is consolidating its recent gains or losses.
* **Strength:** When the Alligator is "sleeping," it signals a lack of strong directional conviction. The strength is neutral or weakening from a previous trend. For a strong uptrend to resume (and for the Cup and Handle to break out), the Alligator's mouth would need to "awaken" and open upwards (Green > Red > Blue) on increasing volume.
---
### **Overall Conclusion for MSTR:**
MicroStrategy is a highly unique stock due to its significant Bitcoin holdings, which heavily influence its price action.
* **Cup and Handle:** There is a compelling argument for a large **Cup and Handle pattern forming** on the daily chart. The implied 50% upside target from the current price, which would take it beyond its previous all-time high, makes this a very interesting setup. Confirmation of this pattern will require a clear breakout above the cup's resistance on strong volume.
* **Time-Based Fibonacci:** While more subjective, time-based Fibonacci could provide insight into potential *timing* of trend changes or the end of the current consolidation, which would be crucial for a Cup and Handle breakout.
* **Williams Alligator:** The Alligator is likely in a **"sleeping" or consolidating phase**, indicating current indecision or sideways movement. For the bullish Cup and Handle to materialize, the Alligator would need to "awaken" and confirm the new upward trend.
**Important Considerations:**
* **Bitcoin Correlation:** MSTR's price is highly correlated to Bitcoin's performance. Any significant moves in Bitcoin will heavily impact MSTR.
* **Volatility:** MSTR is a highly volatile stock.
* **Risk Management:** Always exercise prudent risk management and consider your investment goals.
This analysis provides a technical perspective; it is not financial advice. Always conduct your own comprehensive research and consult with a qualified financial advisor before making any investment decisions.

$MSTR Trade Setup – SMC Intraday Structure🕒 Timeframe: 15-Min
📈 Direction: Long
📊 Bias: Intraday Bullish Continuation
🔍 Technical Context
ChoCH to BOS Sequence: Clean change of character followed by two bullish BOS (Break of Structure) signals.
Liquidity Sweep & Reclaim: Price swept the EQH zone and reclaimed above minor liquidity; signaling intent to push above $397–$398 (weak high).
Premium Zone: Currently tapping into a premium supply area (~$395–$397). A clean breakout could target $406.95 (external range objective).
Demand Zones: Two clear high-volume demand blocks at $383.40–$385.00 and $377.50–$380.00, showing institutional interest.
📌 Trade Plan
Element Value
🟢 Entry $392.50–$393.50 (upon BOS retest or bullish engulf above premium zone)
🔴 Stop Loss Below $383.00 (beneath OB and EQ zone)
🟡 Target 1 $397.50 (weak high)
🟡 Target 2 $406.95 (HTF resistance + Fib 1.0)
⚠️ Invalidation Close below $383.00 with strong volume
🧠 Macro Context
NASDAQ:MSTR remains highly sensitive to Bitcoin fluctuations. As of today, BTC is holding steady above $60K.
With a dovish Fed and rising crypto ETF inflows, sentiment favors risk-on tech and crypto-linked equities.
The recent uptick in NASDAQ:MSTR volume during demand tests suggests ongoing accumulation by informed participants.
✅ Sentiment Score: 83 / 100
High-probability SMC setup with strong technical alignment and supportive macro backdrop.
For educational purposes only. Posted by WaverVanir_International_LLC
(APA7: TradingView, 2025)

MicroStrategy (MSTR) – Bullish Price Reaccumulation Above EquiliAfter consolidating above the 0.618–0.786 retracement zone, NASDAQ:MSTR shows signs of institutional reaccumulation. The daily chart highlights a breakout from equilibrium with bullish intent, supported by increasing volume and smart money concepts.
📐 Technical Breakdown:
Price reclaimed the 0.786 retracement level ($388.74) and broke above equilibrium, suggesting bullish continuation.
Higher lows, BOS (Break of Structure), and CHoCH zones confirm smart money accumulation pattern.
Fib target remains at $475.57 (1.236 extension), with supply zones marked between $504–$550 (premium zone).
Volume profile shows a tapering discount zone—indicating sellers are drying up as value shifts higher.
🧠 Macro & Fundamental Context:
As a Bitcoin-proxy equity, MicroStrategy’s price is heavily correlated to digital asset flows.
Bitcoin ETF inflows have stabilized, and if BTC holds above $60K, NASDAQ:MSTR could accelerate.
Macro tailwinds: Continued Fed pause, easing liquidity stress, and rising appetite for risk-on assets support the upside thesis.
📌 Key Levels:
⚡ Breakout: $388–$394
🔍 Target: $475.57 (1.236 Fib)
🛑 Invalidation: Close below $355.88 (0.618 Fib and volume shelf)
📈 Bias: Bullish
🧭 Timeframe: Swing to Position
🔗 Posted by WaverVanir_International_LLC
This post is for informational and educational purposes only. Not financial advice.
(APA7: TradingView, 2025)

MSTR 10x From HereThis fractal compares the current price action of MSTR to its price action in 2021, during the previous Bitcoin bull market. This time, it is moving slower, so the time interval was adjusted to 1 week instead of 1 day. The next base consolidation target is around December 2024, with a top expected around April-June 2025.

Buy if it's Hold 395Double bottom with SMA 10,20,50 acts as support... needs bitcoin to push higher so this name start moving higher

MSTRMSTR after looking above and failing in the attempt to test the highs it has been consolidating for a period of time and is show some signs of strength. If BTC can get a nice push above all time highs I believe you will see ATHs on MSTR.
MSTR Bulls Reload on BTC ConvictionMSTR – Institutional Flow + BTC Correlation + Bull Vertical Spread Setup
MicroStrategy (MSTR), operating as “Strategy,” just went full throttle—adding 10,100 BTC between June 9–15 at an average of $104,080 per coin, totaling over $1.05B. With this, they now hold 592,100 BTC (>$63B), solidifying their status as the largest Bitcoin-holding public company. That’s a bold move amid the ongoing Israel-Iran macro uncertainty, signaling confidence, not caution.
This latest BTC buy was funded via STRK and STRF ATM offerings and the $979.7M STRD preferred IPO. Since initiating their Bitcoin treasury strategy in 2020, MSTR has soared over 3,000%, and they’re projecting a 25% BTC yield for 2025 after already clocking in at 13.7% YTD.
🔎 Flow Watch
Institutional activity around current price levels has been sharp—confirming conviction behind the recent momentum. With BTC hovering at critical support, I’m eyeing a potential short-term bullish reversal. Given the tight correlation between BTC and MSTR, the setup looks primed.
🎯 My Strategy
I’m targeting a bull vertical spread—buying the 382.5 call and selling the 385 call. This defined-risk, limited-reward setup positions me to capture near-term upside if BTC begins a rebound and MSTR follows suit. The tight strike range and elevated IV make it ideal for a premium-efficient directional bet.

Strategy in SatoshiLooks like MSTR/BTC is being supported by the moving averages, as volatility drops under the all-time descending overhead. What this means is that once the overhead is breached, then MSTR starts to move more than BTC. You start to get days where MSTR moves 3x BTC, and 4x. What MSTU does, only the few and the proud know. It's not for you to know. You are too smart to hold long term an asset which is not intended to be held overnight. Only a fool would do it, or a crazy person, or a very shrewd person with a long time horizon and a middle finger to the taxman.

Bullish flag on $mstr, consolidating under supply tooNASDAQ:MSTR is in a flagpole position, a bullish one. The measured move target would be $700
Do you agree that MSTR is in a bullish stance?
I guess this really come down to how bitcoin does.
