MU SwingTargets and stops on the chart.
Going long starting when the macd 4hr crosses over.
Best of Luck,
--d0x
MU trade ideas

$MU long $MU is a nice set up here as it’s above the Moving averages. Look long here with the 2 targets in red! Could go short if 5 minute candle closes below the 200MA.
Looking like a great options day trade breakout either way!

Bullish Charts - Golden Cross Soon, Possible BuyoutMicron Technology, Inc. engages in the provision of innovative memory and storage solutions. It operates through the following segments: Compute and Networking Business Unit (CNBU); Mobile Business Unit (MBU); Storage Business Unit (SBU); and Embedded Business Unit (EBU). The Compute and Networking Business Unit segment includes memory products sold into cloud server, enterprise, client, graphics, and networking markets. The Mobile Business Unit segment offers memory products sold into smartphone, and other mobile-device markets. The Storage Business Unit segment comprises of SSDs and component-level solutions sold into enterprise and cloud, client, and consumer solid-state drive (SSD) markets, other discrete storage products sold in component and wafer forms to the removable storage markets, and sales of 3D XPoint memory. The Embedded Business Unit segment consists of memory and storage products sold into automotive, industrial, and consumer markets. The company was founded by Ward D. Parkinson, Joseph L. Parkinson, Dennis Wilson, and Doug Pitman in October 1978 and is headquartered in Boise, ID.
At current levels, I feel Micron is undervalued and unappreciated.
There are not many devices in the technology industry that do not need memory and storage. Micron can supply the memory and storage from electric vehicles to computers and spaceships to airplanes. Almost everything today needs memory including appliances and smart homes.
Micron just posted earnings and they blew past Wall Street estimates and then the company raised guidance and forecast higher earnings and revenue moving forward.
Currently, on the Daily Chart, the following indicators are Bullish...
Volume, Bullish
MACD, Bullish
RSI, Bullish
Accumulation, Bullish
Sector, Bullish
PMO is turning up, Bullish
On June 30, the 50-Day MA crossed up above the 100-Day MA, Bullish
As of today, the 50-Day MA is less than a point away from crossing up above the 200-Day MA, Bullish
Here are the indicators...
6-Jul-20 50.92
▲ Mon MU New York
6-Jul-20
50.92 Bullish Kijun Sen Cross Strong
27-May-20
49.45 Bullish Kumo Breakout
26-May-20
45.80 Bullish Chikou Span Cross
4-May-20
44.46 Bullish Senkou Span Cross
In my opinion, I think Micron is the best play in town and I also think it's a buyout target. If I were the CEO of Microsoft or another large tech giant like Apple, I wouldn't even think twice about trying to buyout Micron because down the road, everything will need memory and storage to operate.
If Micron is bought, I think the buyout would be upwards of $120 per share.
This was from 2016 and in my opinion, Micron looks better now than ever before... If it looked good in 2016, it looks amazing now!
Chipmaker Micron Gains with Speculation It's a Takeover Target
www.industryweek.com
Long!
DISCLAIMER
The Content herein is for informational purposes only, you should not construe any such information or other material as legal, tax, investment, financial, or other advice.


muafter earnings momentum may eventually carry mu back to this break out break down back test line in weeks. the chart says the line is important. went as high as 52.75 today


MU - Micron Technologies - Bullish Pennant / $49.65 Entry 0. Nice entry, after guidance, and a Bullish Pennant / Ascending Triangle forming;
1. Looking for movement above $55;
2. Looking to sell PUTS here on the July 17th Strike, to get in at a lower price;
3. Great longer term entry sub $50;
- drchelsea

MU Rising WedgeMU Idea
A clear rising wedge has formed between the dominant trendline and another trendline below this line
A inverse H&S has also formed with a possible right shoulder already printed, a possibility that it is a fake and another will be printed as a result of the rising wedge.


$MU Earnings Trade setup for Micron
Awaiting possible long on break above 200ma and Fibonacci resistance.
Catch up trade in comparison to NVDA
Broke local downtrend, while uptrend held during last weeks selling.
PLEASE GIVE US A LIKE IF YOU FIND OUR CONTENT HELPFUL, THANK YOU.


$MU Micron Long Into earnings
Possible long on break from wedge and daily resistance @$49.50
Possible short on loss of support @ $47.35
Indicators are very bearish and range is tight with 200ma as resistance and 50-100ma as support.
MU has a lot of hope on its shoulders going into earnings, a good report could help reverse the SMH

THE WEEK AHEAD: MU, FDX EARNINGS; XOP, IWM, EWZEARNINGS:
MU (36/64/11.7%) announces earnings on Monday after the close. Pictured here is a 19 delta short strangle in the July expiry, paying 1.55.
FDX (46/59/11.4%) announces Tuesday after the close, with the 20 delta July 17th 115/147 paying 4.56.
EXCHANGE-TRADED FUNDS ORDERED BY RANK AND SCREENED FOR 30-DAY >35%:
EWW (59/44/12.6%)
EWZ (47/63/17.7%)
XLE (45/52/16.0%)
GDXJ (43/60/17.7%)
SMH (37/42/12.0%)
GDX (36/45/14.5%)
XOP (32/70/20.2%)
USO (13/67/16.7%)
Would probably go out to August here (54 days) ... . Looked at through the lens of what the short straddle is paying as a function of share price, it looks like I should be selling premium in XOP (20.2%), followed by EWZ (17.7%) and/or GDXJ (17.7%).
BROAD MARKET ORDERED BY RANK:
IWM (57/45/12.7%)
QQQ (38/32/<10%)
EFA (37/29/<10%)
SPY (37/34/<10%)
Small caps continue to be where the juice is at.
IRA DIVIDEND-GENERATORS
IYR (53/40/11.7%)
XLU (50/33/<10%)
EWZ (47/63/17.7%)
EWA (46/40/11.2%)
EFA (37/29/<10%)
SPY (37/34/<10%)
HYG (35/20/<10%)
EMB (20/18/<10%)
TLT (20/19/<10%)
EWZ offers both better better premium as a function of stock price than IYR at the moment, as well as slightly higher yield (3.66% for the former; 3.50% for the latter). Since I've already laddered out IYR, I may dip at the EWZ well with the 16 delta short put paying .70 in August at the 22 strike, .84 in September at the 21 ... .


MU still in playFew rejection at re-bounce area show that MU still having strong movement to resistance area. Opportunity to buy at current or slightly below consider as low risk ratio compare to reward.

MU BULLERISH Earnings playMU is in a clear ascending channel, has set up meaningful resistance at the $48 level last week. Looks like it has consolidated at the lower end of the channel and is going to make a move up to the top of the channel. This has set up an opportunity to the long side if MU respects the channel it is in. Monday is earnings for MU after market close, I'm not really sure what it is expected and how they have been doing,a few weeks ago I played the $50 breakout successfully, it ran to 54 where I closed the trade.
This chart presents two trade setups because of the positioning of the stock and the underlying catalyst for a move to either direction.
Bullish: MU price target is $54 upon good earnings as a catalyst to move the stock from the lower end of channel to the higher end of the channel, I'll be playing Jul 31 - Aug 07 options as the longest up move from the lower end of the channel took 24 days to complete.
Side note: MU has earnings on Monday after market close, this means that IV will be extremely high on Monday and might not be worth buying options until after earnings. I have already started a position with Jul 17th options, which I will most likely close at the end of day Monday if MU makes a good move off the lower channel because of IV crush the next day and will re enter if indeed the lower of the channel is respected and the stock moves higher on earnings.
Bearish: If MU breaks that lower end of the channel, it could possibly break down and head lower or bad earnings or even good earnings that did not meet expectation. This entry will be based on whether MU holds that $48 level or not, if not could profit really nicely to the downside with options as well, as put options tend to gain more as vol increases (it mostly increases as the stock goes down)
This is not FINANCIAL ADVICE and SHOULD NOT be taken as a trade just based on what I have put out here. Do your own analysis and use mine as supplementation to support your thesis, mine is strongly to the upside more than to the down side and I have a clear plan as to how I will execute with technical and time stops. OPTIONS ARE NOT FOR EVERYONE, check with your broker or financial adviser first.

MU BUY OR LONG TARGET UP TO $60MU Triangle Ascending pattern and has a pull zone of $ 50.5
MU buy : $51
MU Target : $60 +-2
Stop loss : $47
Wish you a successful trading!

MU Analysis (1Hr Chart)Weekly
- Diving Board Pattern (Starting Dec 16th, 2019)
- Bullish Momentum
Daily
- Bullish Channel
- Slightly Decreasing Volume
1Hr
- Island Top Reversal, which seemed to be short lived
- Bearish Rising Wedge
Prediction
- Break of the Rising Wedge to the Upside w/ Earnings Run Up
- 1st Price Target: 59.59
- 2nd Price Target: 67.31


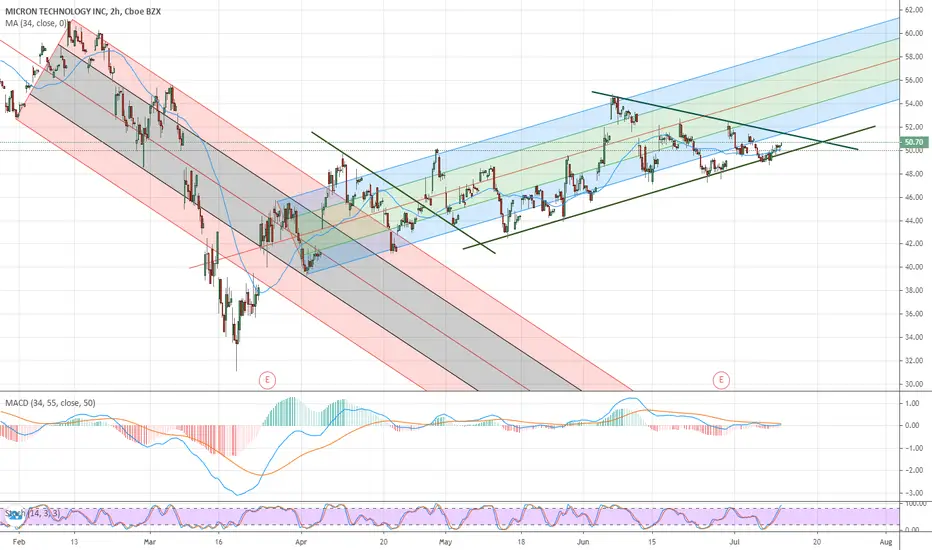
$MU Micron Following the Channel
Bullish move setting up as RSI is in reversal as is the MACD
Possible upside targets to recent pivots

MU: Ascending triangleAscending triangle
Descending volume
200MA = bullish
PPS = above 50MA
250RSI = above 50, bullish
ATR trending upward
Targer price = 78,47$ if confirmed.

Long MU 58$ target if Channel HoldsMU is getting the attention of some professional traders. Will be on watch to break the $49 VWAP and will be using bull spreads to cover. Credit spreads if it breaks the channel to the downside. Please post below if you agree or disagree.
