NFLX - Netflix - Short- selling all my netflix positions, divergence in prices + ascending channel it might drive to a downtrend.
- loking for buying again aroun 250-300$ (be patient)
NFLX trade ideas

NFLX _ Volume AnalysisNetflix was being accumulated well prior to the POP> Check out how Unusual Market Volume Detector Identified the BUYING after Price divergence on the 12th OCT.

Selling resumed Today in NFLX/ NetflixIt is profit booking for sure, there is clearly a Red TrapZone and Red UMVD in place for now. So only shorts are active now for Netflix.
TrapZone and UMV combined together are complete automated technical analysis indicator package. You get to clearly see in Realtime the market trend strength and volume confirmation.

NFLX AnalysisPrice did not play out as expected and rallied +3.82% from my last analysis. I was expecting a bearish retracement into the bullish order block at 460.50 or 418.84. However, right now price is showing bearish momentum with increased volume, which happened after taking buy-side liquidity above 500.89. From here, I'm expecting price to make a bearish retracement, potentially back into the bullish order block at 460.50.


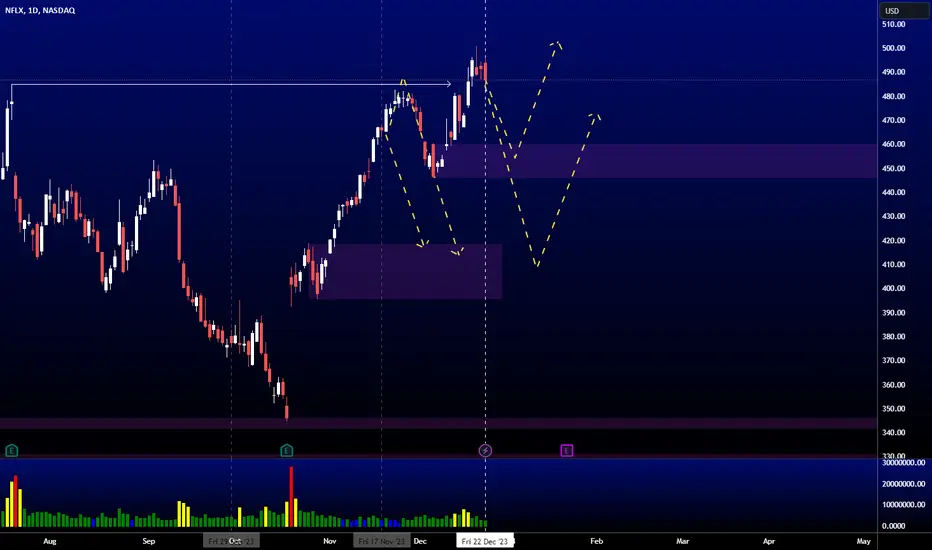
NFLX WHAT'S NEXT!Hello Traders and everyone, I am Hadi Karaali, Known as SNIPERS_FX
If you like the idea, do not forget to support with a like and follow.
What's next for NFLX.
Price is still overall bullish from a long-term perspective, and price is still trading inside this rising flat channel.
Meanwhile, price is sitting around a massive resistance zone, and for the bears to take over, we need a break below the marked major swing low, then a movement lower would be expected till the lower rising trendline lining up with a strong support zone,
Then as the price will be approaching our lower zone, then we will be looking for a trend-following buy setups.
If you like this kind of analysis don't forget to like and follow
and as usual follow your trading plan and manage your risk.
Be patient and good luck!

Netflix's Legal Triumph and Ad-Driven Ascension
In a recent legal showdown, streaming giant Netflix emerged victorious in a California federal court, successfully defeating a shareholder lawsuit that accused the company of concealing the impact of account-sharing on its growth trajectory. The lawsuit, filed by a Texas-based investment trust in May 2022, sought damages for investors who purchased Netflix shares between January 2021 and April 2022. Despite the significant blow to the stock value and a subsequent drop in subscribers, U.S. District Judge Jon Tigar ruled that the plaintiffs failed to provide evidence supporting their claims.
Legal Victory and Investor Response:
The judge's decision, delivered on Friday, underscores the importance of substantiated claims in legal battles. While Netflix shares initially faced a downturn, losing a third of their value, the ruling has provided a reprieve for the streaming giant. The door, however, remains open for the investors to refile the lawsuit if they can bolster their claims with additional facts.
Netflix's Stock Rollercoaster:
The legal victory is just one chapter in Netflix's rollercoaster journey in the stock market. Between January and April 2022, the company's shares experienced a drastic decline of around 50%. The drop was triggered by revelations that account-sharing and increased competition had hindered new subscriptions. Former CEO Reed Hastings attributed some of the challenges to the complexities of interpreting subscription trends amid the ongoing COVID-19 pandemic.
Ad-Supported Triumph:
Amidst the stock market turbulence, Netflix is finding success in an unexpected corner—the ad-supported realm. Recent reports indicate that Netflix's ad-based plan has surged, surpassing 23 million global monthly active users. This substantial growth, revealed by President of Advertising Amy Reinhard at the Variety Entertainment Summit at CES 2024, marks a notable increase from the reported 15 million users just over two months ago.
Engaging the Audience:
Reinhard emphasized the robust engagement levels among users on ad-supported plans, with a staggering 85% streaming on the platform for more than two hours daily. This data suggests that the ad-supported model is resonating well with Netflix's audience, providing a fresh perspective on the evolving dynamics of streaming preferences.
Pricing Strategy and Market Penetration:
Netflix's pricing strategy for its ad-supported plan is noteworthy, with the Basic With Ads plan priced at $6.99 per month in the United States—less than half the cost of the Standard plan at $15.49 per month. This strategic pricing could be a key factor in attracting a broader audience to the ad-supported tier, as ad-tier subscriptions reportedly account for approximately 30% of all new signups in the 12 countries where the platform has been launched.
Microsoft Partnership and Technological Advancements:
Netflix's success in the ad-supported arena is further amplified by its ad-tech deal with Microsoft. The partnership designates Microsoft as Netflix's global advertising technology and sales partner, playing a pivotal role in the triumph of Netflix's advertising strategy and technology infrastructure.
Conclusion:
As Netflix navigates legal challenges and charts a new course in the ad-supported landscape, the streaming giant continues to demonstrate resilience and innovation. The legal victory provides a foundation for future endeavors, while the surge in ad-supported subscriptions showcases Netflix's adaptability in meeting evolving consumer demands. The company's strategic pricing, coupled with a robust technological infrastructure, positions it for continued success in an ever-changing streaming landscape.

$NFLX shortNetflix was unable to go for higher high and sellers are coming in strong .
Short now 12.06 R/R

NETFLIX: This rebound isn't a buy opportunity.NFLX is staging a rebound on the 1D MA50 on a marginally bullish 1D technical outlook (RSI = 56.295, MACD = 4.710, ADX = 36.125). We don't consider this a buy opportunity as even if a slightly HH is made, the 1D RSI is showing a Bearish Divergence on a Channel Down, the same kind of bearish pattern that started the bearish waves in the two HH prior. Consequeantly we expect a pullback to at least the bottom of the Channel Up (dashed) or the HL trendline (which will be -25.25% from the top) depending on when the 1D RSI crosses under the 30.000 level (oversold), which was the buy trigger on the last two bottom opportunities. We have a long term TP = 550.00.
See how our prior idea has worked:
## If you like our free content follow our profile to get more daily ideas. ##
## Comments and likes are greatly appreciated. ##

Looking for a serious trader who knows how to code. One single alignment happened exactly the same on these stocks at these points
I know now to trade, dont know how to code
And knowing nothing signifcant can happen doing all this on your own, I;m seeking someone serious about making a few of these.
I have other techniques tha beat every money manger ib the country.
But just this simple one is maybe the best Ive seen in 30 years.

NetflixNetflix has clean impulse to the downside with the WXY correction complete.Netflix should continue down ideally into the 67 zone.

NFLX AnalysisPrice played out nicely as analyzed last week, giving us a -5.14% move to the downside. As the target for the bearish retracement is not yet hit, I'm expecting a further bearish move to the bullish OB at 460.50, or to the the bullish OB at 418.84 in the coming days.

NFLX AnalysisPrice consolidated since my last analysis. Nothing changed so far. I'm still expecting price to continue lower to the discount level, potentially mitigating the bullish OB at 460.50 before continuing higher following the bullish order flow.

Sell 491 sl 498 tp 240As price hit resisrence area and rising wedge expect drop on way pls like for support thank you

Cup and handleNFLX has formed a nice C&H on a rising trend. Based on the leading edge of the cup to the bottom, should expect about a 12% rise from here.

NFLX AnalysisPrice playing nicely to my last analysis. Right now, price has taken the clean highs at 485.00 where I'm expecting a bearish retracement, potentially into the bullish OB at 418.84. However, we do see a new bullish OB created at 460.50, which could be an area where price continues with the bullish order flow.
Netflix in large Cup and Handle PatternNetflix appears to me to be completing a large cup and handle pattern. The initial peak of the cup appears at a price level of about $485 while the base appears to be at a low of $345. This price difference is $140, so I suggest the possibility that a new price target for NFLX should be at $625.
The handle has just been broken in the upward price direction and I am trading this to that price target unless invalidation occurs. I am watching for the stock price to hold the $485 support that was once previously a resistance to confirm the trend and avoid invalidating the technical formation.

$NFLX: Huge long term signalVery nice signal popped on close in the last quarter in Netflix, upside gives it between 9.2 to 1 and 55 to 1 reward to risk, if the targets the Time@Mode signal projects are reached.
I suggest having some long term exposure to it, consider risk of a drop under 332.65 or a bit more, for sizing it, and that you need to hold until late 2026 perhaps.
The password crackdown and paying userbase growth is a nice catalyst here, and though competition is a risk, they seem to be doing well in increasing profitability for shareholders over time despite the many challenges of the streaming biz.
Best of luck!
Cheers,
Ivan Labrie.

Netflix reaching 500$ !Hello,
In one of my previous posts, I shared an idea about NITFLIX reaching $500 or even more in the next few weeks. Now, we have confirmation of that! There is a high probability that this stock could surpass $500 this week.
Ibrouri

Netflix doubling from here - $1000See you at $1000 mid 2024 on Netflix!
Crazy explosive bull run incoming!

NFLX ideaAfter years of charting I am sharing my first chart. I think it is self explanatory. Red lines are down Grey lines below are possible resting points for price. Depending on world status the price may break the lower red line. Started short positions after last earnings.

Netflix Holds a Tight PullbackNetflix rallied sharply between mid-October and late November. Now, after a pullback, some traders may expect further upside.
The first pattern on today’s chart is the September closing high of $448.68. NFLX held that level last week. Has old resistance become new support?
Second, the price area matches a 50 percent retracement of the trendline breakout that followed our last idea on October 31 .
Third, the 8-day exponential moving average (EMA) has remained above the 21-day EMA. That may suggest the short-term trend is pointing higher.
Finally, stochastics are rebounding from an oversold condition.
TradeStation has, for decades, advanced the trading industry, providing access to stocks, options, futures and cryptocurrencies. See our Overview for more.
Important Information
Past performance, whether actual or indicated by historical tests of strategies, is no guarantee of future performance or success. There is a possibility that you may sustain a loss equal to or greater than your entire investment regardless of which asset class you trade (equities, options, futures or cryptocurrencies); therefore, you should not invest or risk money that you cannot afford to lose. Online trading is not suitable for all investors. View the document titled Characteristics and Risks of Standardized Options at www.TradeStation.com . Before trading any asset class, customers must read the relevant risk disclosure statements on www.TradeStation.com . System access and trade placement and execution may be delayed or fail due to market volatility and volume, quote delays, system and software errors, Internet traffic, outages and other factors.
Securities and futures trading is offered to self-directed customers by TradeStation Securities, Inc., a broker-dealer registered with the Securities and Exchange Commission (“SEC”) and a futures commission merchant licensed with the Commodity Futures Trading Commission (“CFTC”). TradeStation Securities is a member of the Financial Industry Regulatory Authority, the National Futures Association (“NFA”), and a number of exchanges. TradeStation Crypto, Inc. offers to self-directed investors and traders cryptocurrency brokerage services under federal and state money services business/money-transmitter and similar registrations and licenses.
TradeStation Securities, Inc., TradeStation Crypto, Inc., and TradeStation Technologies, Inc. are each wholly owned subsidiaries of TradeStation Group, Inc., all operating, and providing products and services, under the TradeStation brand and trademark. TradeStation Crypto, Inc. offers to self-directed investors and traders cryptocurrency brokerage services. It is neither licensed with the SEC or the CFTC nor is it a member of NFA. When applying for, or purchasing, accounts, subscriptions, products and services, it is important that you know which company you will be dealing with. Visit www.TradeStation.com for further important information explaining what this means.

NetflixDue the high interest rate (5,50%) and the debt of Netflix and the Haxel strategy, I can see that netflix can go down to 2024.
