NFLXSpeculative short term trading opportunity. Following it's post-earnings decline, the share is approaching a gap fill from the Wednesday 28 June advance. Simultaneously, the share is outside of the lower boundary of it's rising 2SD 50 day linear regression trend channel, support the potential for an 'oversold' rebound. Do note that the US Federal Reserve is due to decide on interest rates this week thus the scope for wider ranges and high volatility remains. Time Stop: 07 September 2023. As always, short term/active traders can consider the following upon a subsequently rise in share price: (1) Raise their stop-loss to protect capital (2) Scale out of the position as it approaches the target. (3) Bank/Take Profit in full (and possibly get back in if it retraces).
NFLX trade ideas

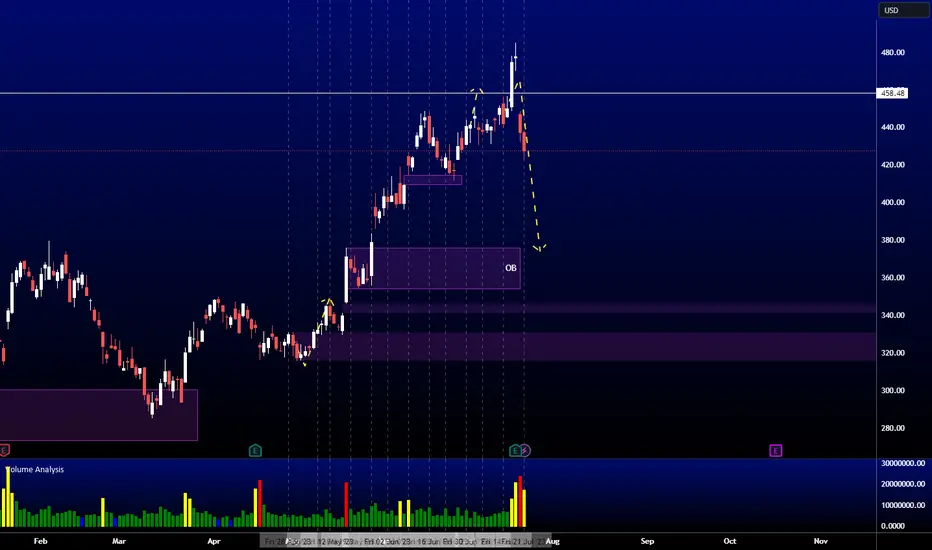
NFLX AnalysisPrice played out nicely as analyzed last week, taking out the clean highs at 458.48 before giving us a 12.74% move to the downside. With the current bearish momentum, we should be looking at price potentially heading down to the bullish POI at 375.87 next.
Can NFLX rebound from the down turn after earnings?NFLX started a good trend up about June 25 and then pulled back in the day after the
earnings report. Although the earnings beat expectations, price continued to drop in
a VWAP breakdown shown here on a 2 hr chart. Over the 2 days that followed, price
has continued down at a slower rate and candle ranges are diminished. Importantly,
the zero=lag MACD shows a line cross under the histogram which has changed from
red /negative to green/positive. The lines have inflected upward. I see this as demonstrative
of bullish divergence and predictive of a reversal.
Overall, I see NFLX rebounding with a potential 15% upside. My target is 480 in consideration
of the swing high on July 18th with a stop loss of 415 the swing low of late June.

Keepit easy: NETFLIX long goes to 1156USDNetflix uses jump massively amid account sharing ban
Sentiment is cautiously bullish into the next US CPI figure, due tomorrow, and the next FOMC decision due Wednesday.
Investors are flocking into call options because no one wants to miss a further rally in stock markets, but no one is sure that the rally will continue given the fact that the Fed has hiked rates at a record speed since last year, leading to the failure of a couple of US regional banks on the way.
Across the Atlantic Ocean, the European Central Bank (ECB) is expected to hike its interest rates by 25bp when it meets on Thursday, while the Bank of Japan (BoJ) is expected to keep its policy rate at the negative territory despite the rising inflation.
Netflix’s share price could benefit from a mild fall in the US economy. The logic is based on stay-at-home dynamics and fading competitors in tougher economic conditions
The risk to this outlook is that unnecessary subscriptions are one of the first expenses that consumers are likely to cut back on. Netflix fell significantly in 2021, but there has been a decent bounce recently.
Netflix Stock Forecast By Month
Year Mo Min Max Close Total%
2023 Jul 432 511 482 9.55%
2023 Aug 476 536 506 15.00%
2023 Sep 499 563 531 20.68%
2023 Oct 525 591 558 26.82%
2023 Nov 534 602 568 29.09%
2023 Dec 560 632 596 35.45%
2024 Jan 583 657 620 40.91%
2024 Feb 612 690 651 47.95%
2024 Mar 625 705 665 51.14%
2024 Apr 656 740 698 58.64%
2024 May 689 777 733 66.59%
2024 Jun 705 795 750 70.45%
2024 Jul 717 809 763 73.41%
2024 Aug 753 849 801 82.05%
2024 Sep 768 866 817 85.68%
2024 Oct 778 878 828 88.18%
2024 Nov 817 921 869 97.50%
2024 Dec 825 931 878 99.55%
2025 Jan 864 974 919 108.86%
2025 Feb 907 1023 965 119.32%
2025 Mar 914 1030 972 120.91%
2025 Apr 939 1059 999 127.05%
2025 May 986 1112 1049 138.41%
2025 Jun 1035 1167 1101 150.23%
2025 Jul 1087 1225 1156 162.73%

Impact of Netflix Subscription Increase on Stock PriceFirstly, let's acknowledge that as a leading global streaming platform, Netflix has experienced tremendous growth and success over the years. However, the recent announcement of a subscription price increase raises concerns about the company's future profitability and market dynamics.
While the subscription increase may seem logical to counter rising content production costs and maintain profitability, it is essential to consider the potential consequences. Historically, price hikes have been met with mixed reactions from subscribers. In some cases, these increases have resulted in customer churn as consumers seek alternative, more affordable streaming options.
Given the intensely competitive nature of the streaming industry, with established players like Amazon Prime Video, Hulu, and Disney+, it is essential to assess the potential impact on Netflix's subscriber growth. A possible slowdown in subscriber acquisition or an increase in customer churn could negatively impact the company's revenue and, consequently, its stock price.
Therefore, please exercise caution and consider holding off on buying Netflix shares until we have more clarity on the market's response to the subscription increase. Monitoring key metrics such as subscriber growth, churn rate, and competitive positioning will be crucial in making informed investment decisions.
As investors, it is our responsibility to assess risks and opportunities objectively. While Netflix remains a dominant player in the streaming industry, the potential repercussions of its subscription increase must be noticed. By adopting a wait-and-see approach, we can better evaluate the long-term implications on the company's financial performance and stock price.
In conclusion, I encourage you to exercise caution and closely monitor the developments surrounding Netflix's subscription increase. Holding off on buying Netflix shares until we have more visibility on its impact will allow us to make more informed investment decisions.


NFLX breaks major trend resistance ahead of ER tomorrow 🔥boost and follow for more ER charts/analysis and to show support 💛
first 2 breakouts past this trend were fake outs, today we are seeing the 3rd break but I think if we have good earnings tomorrow this breakout will be very explosive unlike the other two..
Price target for this week is 500-550 with good earnings.. lets see what happens. good luck🔭

Technical and digital analysisWe notice that it is in an upward trend and there is an increase in the buying momentum

Concerns about Netflix's Future Subscription GrowthOver the past few years, Netflix has undoubtedly revolutionized how we consume entertainment. Its vast library of content and the convenience of on-demand streaming have attracted millions of subscribers worldwide. However, recent trends and market indicators raise questions about the sustainability of Netflix's exponential growth.
Firstly, the streaming landscape has become increasingly competitive. With the emergence of new players such as Disney+, Apple TV+, and Amazon Prime Video, the market has become saturated, leading to a fragmented audience. This intense competition poses a significant challenge for Netflix, as it struggles to retain its subscriber base while attracting new ones.
Moreover, the COVID-19 pandemic has temporarily boosted Netflix's subscriber numbers due to lockdown measures and increased demand for home entertainment. However, as the world gradually returns to normalcy, we cannot ignore the possibility of a decline in Netflix's subscriber growth. The return of outdoor activities, cinemas reopening, and live events resumption may divert consumer attention away from streaming platforms, affecting Netflix's long-term growth potential.
Additionally, the rising cost of content production and licensing rights is a significant financial burden for Netflix. While the company has successfully created original content, the competition for exclusive rights to popular shows and movies has become increasingly fierce, leading to soaring expenses. This escalating cost may hinder Netflix's ability to invest in new content and maintain its competitive edge in the long run.
Considering these concerns, I urge you to pause and reevaluate any long-term investment plans for Netflix. It is essential to assess the company's ability to sustain its growth trajectory amidst fierce competition, changing consumer preferences, and mounting financial pressures.
Concerns about Netflix's Future Subscription Growth - A Call to Pause Long-term Investment
As traders, we make informed decisions based on a comprehensive understanding of the market dynamics. I encourage you to explore alternative investment opportunities within the streaming industry or diversify your portfolio to mitigate potential risks associated with Netflix's uncertain future.
In conclusion, the future subscription growth of Netflix remains uncertain, given the intensifying competition, shifting consumer habits, and mounting financial challenges. It is crucial to exercise caution and carefully assess the risks before making any long-term investment commitments.

#NFLX Trading A Wave 4 PullbackIN this update we review the recent price action in Netflix and identify the next high probability trading opportunity and price objectives to target
•Past performance not indicative of future results

NFLX ANALYSIS: NETFLIX ENDING BULL SEASON?In mid-October 2022, the NFLX share price was about $250; in those days we wrote the post “Is Netflix starting a new bull season?”. Since then, the NFLX stock has more than doubled in price. But after the publication of yesterday's news, everything has changed, hence the headline.
The company added nearly 6 million subscribers in the quarter, with a forecast of 1.9 million. As of the end of June, Netflix had 238.4 million subscribers worldwide. This is positive news.
Some negative news: the decline in revenue. While 8.3bn was expected, the actual number is 8.1bn. “While we have made steady progress this year, we still have a lot of work to do to accelerate our growth again,” the company said in a quarterly letter to shareholders.
However, the most serious argument lies in the behavior of the price on the NFLX chart.
On the eve of the earnings report, we witnessed an increase in the price on rumors of an increase in subscribers. The price of NFLX was close to USD 500, but fell almost 9% post-market after the news. So today the trading session is likely to open below USD 440 per share. This abrupt change in market behavior provides an argument to suggest that the months-long rally has reached a culminating phase. A surge in volatility will help large stockholders take profits — perhaps they see Netflix's difficulties with the strike of actors and authors, increased competition, restrictions on the prospects for further growth.
The median line of the rising channel is now seen as the nearest support, the breakdown of which will confirm the change in market sentiment.
This article represents the opinion of the Companies operating under the FXOpen brand only. It is not to be construed as an offer, solicitation, or recommendation with respect to products and services provided by the Companies operating under the FXOpen brand, nor is it to be considered financial advice.

NFLX ready for $500?It was trading nicely in this wedge formation but it broke out before earnings. I was hoping it would trade inside until earnings but I guess it wanted to start filling in the gap it had. Still has room to fill up all the way to $507.57. Good earnings report with huge subscriber count could push it to fill the gap. If it reports lower subscriber count then we could see a huge drop maybe back to $430 range.

$NFLX approaching a topI do think there is likely a small move higher coming next week prior to topping. I'm looking for one last push higher into $457, at which time I think is a good time to go short, because after that, the move down should be a big one.
Most likely scenario IMO is that we break the previously lows in the $170ish range and form new lows down between $139-$111 before bottoming.
All of this should play out within the next 6-9 months.
Let's see what happens.
NFLX Netflix Options Ahead of EarningsIf you haven`t sold NFLX here:
or reentered here:
Then analyzing the options chain of NFLX Netflix prior to the earnings report this week,
I would consider purchasing the 450usd strike price Calls with
an expiration date of 2023-7-21,
for a premium of approximately $16.25.
If these options prove to be profitable prior to the earnings release, I would sell at least half of them.
Looking forward to read your opinion about it.

Netflix not ready for what's next Many investors of NFLX aren't prepared for what is coming next for them. This B wave rally has been amazing and you could have profited, but usually how it goes is most just keep holding and never take the gains. I learned my lesson before on this also. These B waves will ruin accounts... It looks like earnings have already brought the stock down over 6% now we will keep seeing more and more downside.

NFLX builds more momentum LONG for nowNFLX has been trending up for three weeks. If the trend is getting old it is now showing.
Based on a set of two anchored VWAP bands originating June 1 and June 15, Netflix is
breaking through VWAP bands from the lower -2 standard deviation lines to the +2 standard
deviation lines and nearly the third upper deviation lines. This is a clear and convincing
VWAP breakout with buyers in overwhelming control Trading volume today is about 4 or 5
times the running average and about 1M. Volume support for price action is obvious.
The dual time frame RSI shows 1 hr TF RSI (blue line) shot up crossed over the daily TF RSI
(black line) and is retreating a bit. The daily RS is below 80 and still trending up.
The MACD shows a classical bullish momentum pattern with the lines well above the histograms.
Overall NFLX has the risk of overextension and possible topping with a fade afterwards.
The mass index indicator shows a value into the reversal zone but until the value rises and the
drops to 26.5, the trend is still intact. I will take a long trade here, hoping for a quick
5% ROI between now and the end of the week and about 50% on an options trade with
a strike of $500 expiring July 28th which I will close upon a confirmed reversal and use
the profits realized therefrom to buy a put option to take a ride down.

Potential Double Top on $NFLXDouble top setup on NASDAQ:NFLX with divergence occurring on the daily chart. Very interesting setup with earnings approaching. Few gaps (boxes) below the 420 area. Would love to see indecision candles prior to the earnings report. Hopefully the report acts as a catalyst for this setup.

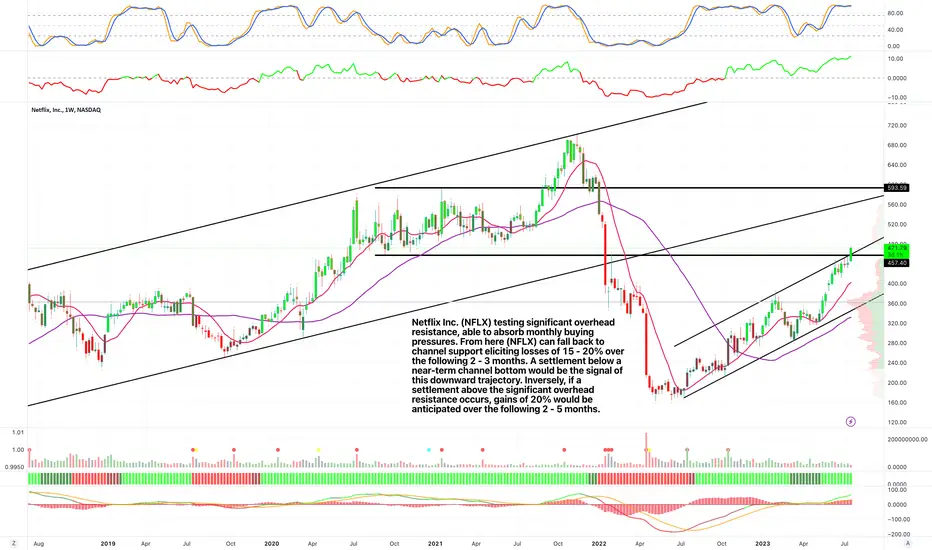
NFLX testing significant overhead resistanceNetflix Inc. (NFLX) testing significant overhead resistance, able to absorb monthly buying pressures. From here (NFLX) can fall back to channel support eliciting losses of 15 - 20% over the following 2 - 3 months. A settlement below a near-term channel bottom would be the signal of this downward trajectory. Inversely, a weekly settlement above the significant overhead resistance occurs, gains of 20% would be anticipated over the following 2 - 5 months time.
NETFLIX is heavily bullish. Buy this pullback.Netflix is trading inside a Channel Up for more than 1 year and is headed for the historic January 20th 2022 Gap of 508.45.
Trading Plan:
1. Buy on the current market price.
2. Buy on the MA50 (1d).
Targets:
1. 508.45 (Resistance 1 and January 2022 gap).
2. 621.00 (Resistance 2).
Tips:
1. The RSI (1d) resembles the late August 2022 consolidation that led to a Higher High. Another bullish indication.
Please like, follow and comment!!

NFLX - Chart Reading 7.18.2023Howdy Traders!
A large break-out for NASDAQ:NFLX is right around the corner. With earnings on the way, a 8-9% move can be expected. In this chart reading, NASDAQ:NFLX has created this wedge, and as of now, it seems as if it has broken through the top resistance. As long as it doesn't break downwards, the price target currently is set to $498.29.
Bona Fortuna!

July Trades (NFLX, account up 1.01%)4th day trade in July is NASDAQ:NFLX on 7/17/2023.
Account is up 1.01%.
Total return in July is 6.5%.

LONG NFLX 18.07After a few tests of the upper boundary of the volatility channel, the following position can be considered:
Entry: 441.58
SL: 439.55
TP: 451.92

NFLX - Rising Trend Channel [MID -TERM]🔹Strong rising trend channel in the medium long term.
🔹Between support 365 and resistance 480.
🔹Technically POSITIVE for the medium long term.
Chart Pattern;
🔹DT - Double Top | BEARISH | 🔴
🔹DB - Double Bottom | BULLISH | 🟢
🔹HNS - Head & Shoulder | BEARISH | 🔴
🔹REC - Rectangle | 🔵
🔹iHNS - inverse head & Shoulder | BULLISH | 🟢
Verify it first and believe later.
WavePoint ❤️
