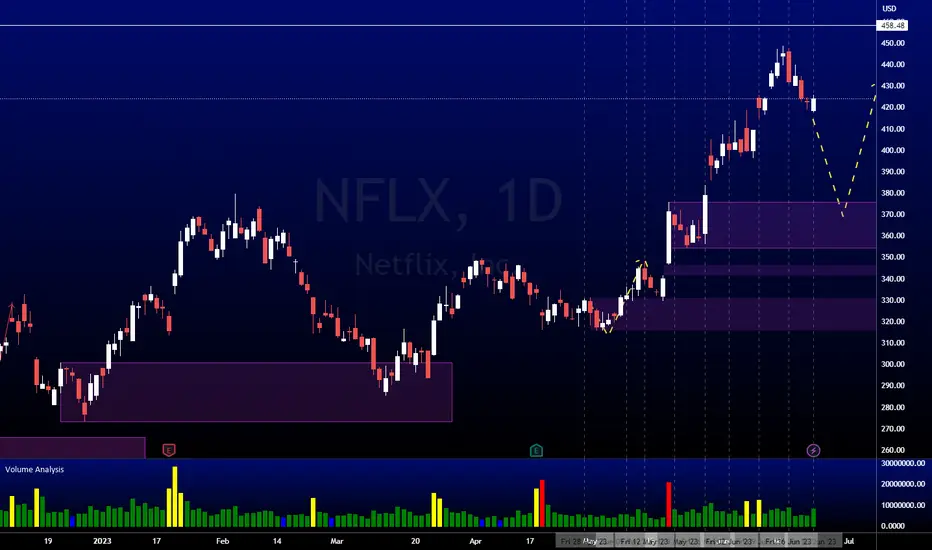
NFLX AnalysisPrice played out nicely as analyzed last week, giving us a small 3.29% move to the downside before a bullish retracement. No changes to my expectations, I'm expecting price to continue lower from here, potentially targeting the bullish POI at 375.87 next.
NFLX trade ideas

NETFLIX CORRECTION MOODmy prediction netlix going around 500 and continue bearish
*short term focus bull*
#elliotwave #enjoy

NETFLIX INC.: ANALYSTS PREDICT REVENUE GROWTH IN THE NEW QUARTERAmerican entertainment company Netflix Inc. shares remain in a corrective trend at around 422.00.
Analysts are positive about the prospects for the company's shares: for example, Barclays Plc. updated the forecast, raising the target price to 375.0 dollars from 250.0 dollars earlier, despite maintaining the Equal-Weight rating, and also noted that over the past 2 months, the capital of Netflix Inc. rose by 28.0%, which significantly exceeds the dynamics in the S&P 500 index (+6.0%). The capital gains were made possible by lowering fears of the number of subscribers, as the recent introduction of paid password sharing did not result in a large churn of users.
The publication of the financial results of Netflix Inc. is expected on July 19: analysts forecast revenue of 8.25 billion dollars, up from 8.16 billion dollars reported in the previous quarter, and EPS could be 2.85 dollars, slightly short of the 2.88 dollars recorded in the previous period.

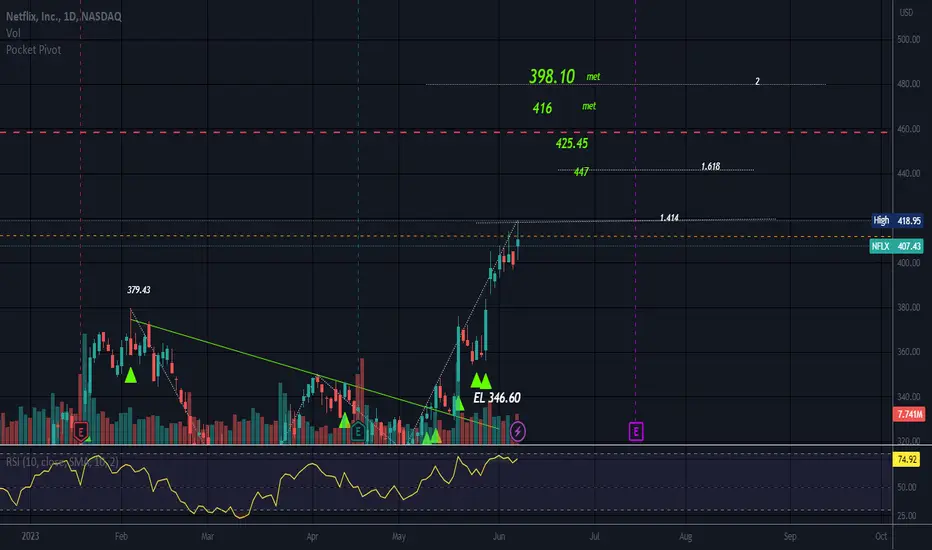
Symmetrical Triangle//W PatternTargets 1 through 4 have been met.
Price broke up from a triangle a while back, but it does look like a W formed.
Long 4th leg on the W that reached a bit above the 1.618 fib level.
There is al an ADC/D Pattern which could b a segment of a Harmonic Crab pattern which terminates close to the 1.618 of leg XA (the first leg down of the crooked W).
This pattern tends to reverse at D and is an extension pattern as the 4th leg end quite a bit above X.
I am learning not to take anything for granted ):
No Recommendation.

Shorting NFLX NFLX hit the last mentioned target jus over 400. Fading the breakout now. I think we may be transitioning back into a bear market. Even if not there's a fair chance of a pullback now we've spiked out (ABC correction in a bull trend).
Update to:

Bearish Alert : NFLXAt the top of this great bullish wave, on the hourly chart I got a new bearish alert.
It must be confirmed by a bearish crossover and a bearish price action of the ema 21 and 50

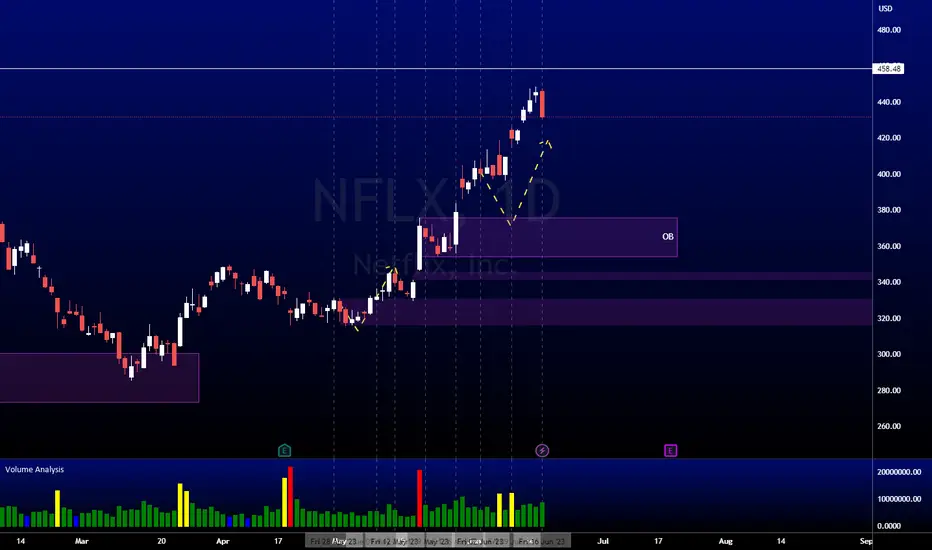
Symmetrical TrianglePrice broke up from a triangle and T1 and T2 have been met.
Possible W pattern. If so, price could reverse at the end of the 4th leg.
Candles getting smaller up there and this is referred to as Deliberation.
Resistance overhead.
No recommendation
Adrenaline Rush: Exploring the Effects as a Retail TraderTrading stocks and options can be an exhilarating venture, especially for retail traders. The fast-paced nature of the financial markets, combined with the potential for substantial profits, often leads to an adrenaline rush. This surge of adrenaline can have both positive and negative effects on traders, influencing their decision-making, emotional state, and overall trading performance. In this article, we will delve into the impact of adrenaline on retail traders and discuss strategies to harness its power effectively.
The Adrenaline Rush: Adrenaline, also known as epinephrine, is a hormone produced by the adrenal glands. It is released into the bloodstream in response to stress or excitement, triggering the body's "fight or flight" response. The surge of adrenaline leads to increased heart rate, heightened senses, and a boost in energy levels. For retail traders, the adrenaline rush is often experienced when placing trades, managing positions, or witnessing significant market movements. The potential for substantial gains or losses can create a thrilling and addictive environment, further intensifying the adrenaline rush.
Positive Effects of Adrenaline: Heightened Focus: Adrenaline can enhance concentration and focus, allowing traders to analyze market trends, news, and price patterns more effectively. This heightened state of awareness can enable them to make quick and informed decisions.
Improved Performance: The rush of adrenaline can provide a burst of energy and motivation, leading to improved trading performance. Traders may feel more confident and assertive, enabling them to execute trades more decisively.
Enhanced Resilience: Adrenaline can help retail traders cope with stressful situations and market volatility. It can enable them to stay composed and make rational decisions in the face of rapid market fluctuations.
Negative Effects of Adrenaline: Impaired Judgment: Excessive adrenaline can cloud judgment and lead to impulsive decision-making. Traders may be more prone to chasing trades, taking unnecessary risks, or overtrading, which can have detrimental effects on their profitability.
Emotional Rollercoaster: The intense adrenaline rush can also result in heightened emotional states, including excitement, fear, and anxiety. These emotions can lead to irrational trading decisions driven by fear of missing out (FOMO) or a desire to recoup losses quickly.
Increased Stress: Trading under the influence of adrenaline for prolonged periods can lead to chronic stress. Continuous exposure to stress can have adverse effects on mental and physical well-being, affecting overall trading performance.
Managing the Adrenaline Rush: Develop a Trading Plan: Having a well-defined trading plan with clear entry and exit strategies can help mitigate impulsive decision-making. Stick to your plan, regardless of the adrenaline rush, and avoid making emotional trades.
Risk Management: Implementing effective risk management strategies, such as setting stop-loss orders, can help limit potential losses during volatile market conditions. This approach can reduce the negative impact of impulsive decisions driven by adrenaline.
Practice Discipline: Cultivating discipline is crucial for retail traders. Establish trading rules and adhere to them consistently, even when the adrenaline rush tempts you to deviate from your plan.
Utilize Technology: Leverage technological tools, such as trading algorithms, stop-limit orders, and automated systems, to assist in executing trades more objectively. This can help reduce emotional interference caused by adrenaline.
Psychological Support: Consider seeking psychological support or participating in trading communities and mentorship programs. Engaging with experienced traders can provide insights into managing emotions and navigating the adrenaline rush effectively.
The adrenaline rush experienced by retail traders when trading stocks and options can be both thrilling and overwhelming. Understanding the effects of adrenaline on decision-making and emotional states is essential for maintaining consistent and profitable trading. While adrenaline can enhance focus and performance, it can also impair judgment and lead to impulsive decision-making. By implementing effective risk management strategies, maintaining discipline, and seeking psychological support, retail traders can harness the power of adrenaline and use it to their advantage.
Remember, trading is a marathon, not a sprint, and managing the adrenaline rush is key to long-term success in the markets.

NFLX AnalysisPrice did not play as analyzed last week. Right now, we see price showing a strong bearish impulse. However, this is not a confirmation to enter short. As price is showing a strong bullish momentum, it is risky to catch the top. Currently there is still buy-side liquidity at 458.48, and price can still continue higher to take it before going lower to mitigate the bullish POI at 375.87.
NFLX is accelerating its rise !NFLX is accelerating its rise !
This chart shows the weekly candle chart of Netflix stock in the past two years. The graph overlays the line between recent low points and low points, the horizontal line of the previous short start position, and the horizontal line of the long start position before making the top. As shown in the figure, Netflix's stock has closed positive for five consecutive weeks and has broken through multiple resistance levels. The next resistance level for Netflix stocks is the top horizontal line (489.68) in the chart, which is the weekly opening price for the week of June 14, 2021!

NFLX LongsNFLX Longs we are in a up trend making higher highs. Its making a indication that it will move higher off the 5 min orderblock lets see how it plays out.

Potential turning point on NFLX at $465Often we have the same distances from the 1x1 Line before we have a pullback.
You can see it like on the volume profile, where we have deviations from the PoC.
Or overbought and oversold conditions
Obviously these prices are too far away from the fair price.

NFLX way overboughtBear market rallies are fantastic so long as you take profits and don't drink the kool aid that everything is A-ok! It's not. $396-$400 retracement expected in coming weeks
Netflix As we get up into this overall rising brodening wedge netflix is starting to see a potential toppin area. This is a solid area to keep a close eye on between 450-452
Overall trend break, dropped netflix hard. Been in an uptrend rising heavily for a while. Got a big blast off the W pattern recently launching us up 140$ from 313 low
As we approach previous trend support this is a critical area to look for rejection in coming days and weeks

Bearish on NFLXNice Dudes , dont miss this beautiful chart and short setup on NFLX.....
best fibonacci vicinity and converging major trend lines......
on top of parallel channell i will put my short order .....
do money management and dont dive into one position anything can happen in moneymarket.
Goodluck

Netflix - NFLX - 'Netflix and Fill' the Gap'Netflix and Fill' the Gap. Price is attracted to the gap above. Do you think we will get a pullback first or just a run to fill the Gap? Price is showing strong momentum with price and the 50 day EMA above the 200 day EMA.

NFLX AnalysisPrice did not play out as analyzed last week. No changes to my original expectations, I'm expecting price to continue lower to make a bearish retracement before going higher. Potential target for the down move is the bullish POI at 375.87.

NETFLIX to 150$ THEN MOONbased on my high level TA
I can see MR Netflix is going to 150$
after that it will bounce to new ATH
if you wont buy netflix at 150$ what u will do then? watch Fargo season 2 or maybe breaking bad and save the world.
as always MR.WEOOO doesnt have money to buy so you guys enjoy the gains!!!!
good luck from MR. WeOOO
the one and only
the best of the best

NFLX TO 10!Netflix after breaking down major support prepares itself to pull back and go down to 10.
Research firm claims Netflix adding new subscribers According to a recent report by a research firm, Netflix has added a significant number of subscribers after their password crackdown.
This is excellent news for investors as it shows that Netflix is taking proactive measures to protect its content and attract new subscribers. As we all know, a growing subscriber base is crucial for the success of any streaming service.
With this in mind, I encourage you to consider investing in Netflix. The company has a proven track record of success and constantly innovates to stay ahead of the competition. By investing in Netflix, you can be a part of their continued growth and success.
I hope you will join me in investing in Netflix and taking advantage of this exciting opportunity. I look forward to your comments.
msn.com/en-us/money/technology/netflix-added-subscribers-after-password-crackdown-research-firm-says/ar-AA1cleMG?li=BB16M4hs

SasanSeifi 💁♂️NFLX👉3D ⏩ 457$ / 500$▪️ Hello everyone
The possible trend is indicated on the chart.
If the support range of 360$ is maintained, in the long term, the possibility of price growth up to the liquidity range of 457$ and the price range of 500$ can be considered.✌
❎ (DYOR)...⚠⚜
What do you think about this analysis? I will be glad to know your idea 🙂✌
IF you like my analysis please LIKE and comment 🙏✌

$NFLX is reaching the confluence of the resistance NASDAQ:NFLX is reaching the confluence of the upside resistance for the 4th wave pullback and beginning of a 5th wave downside as 50% of the latest swing down Fibonacci resistance has been reached
