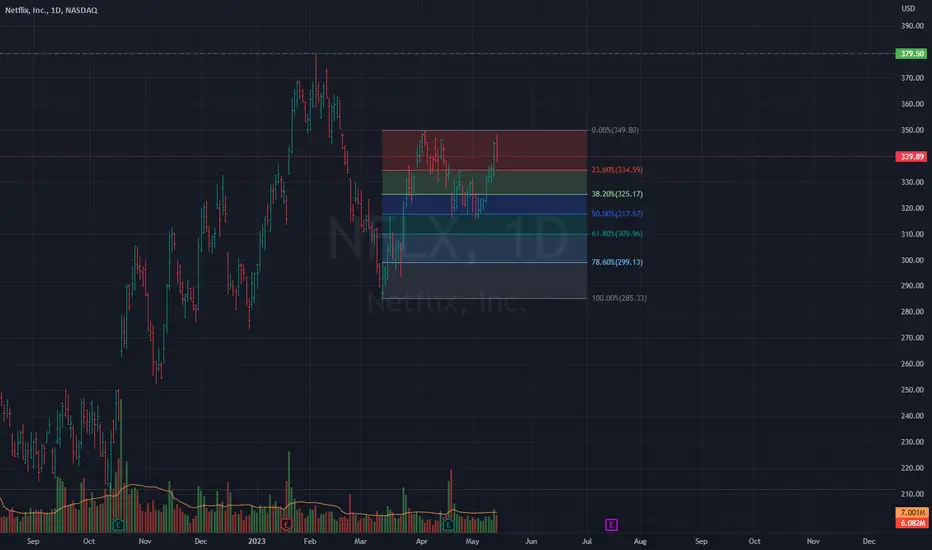
NFLX Entry, Volume, Target, StopWhen price clears: 349.80
With daily volume greater than average
Target: 379.50 area
Depending on your risk tolerance: 339.90 gets you 3/1 Risk/Reward.
This trade idea is not trade advice. This swing trade idea is strictly based on my ideas and technical analysis. No due diligence or fundamental analysis was performed while evaluating this trade idea. Do not take this trade based on my idea, do not follow anyone blindly, do your own analysis and due diligence. I am not a professional trader.
NFLX trade ideas
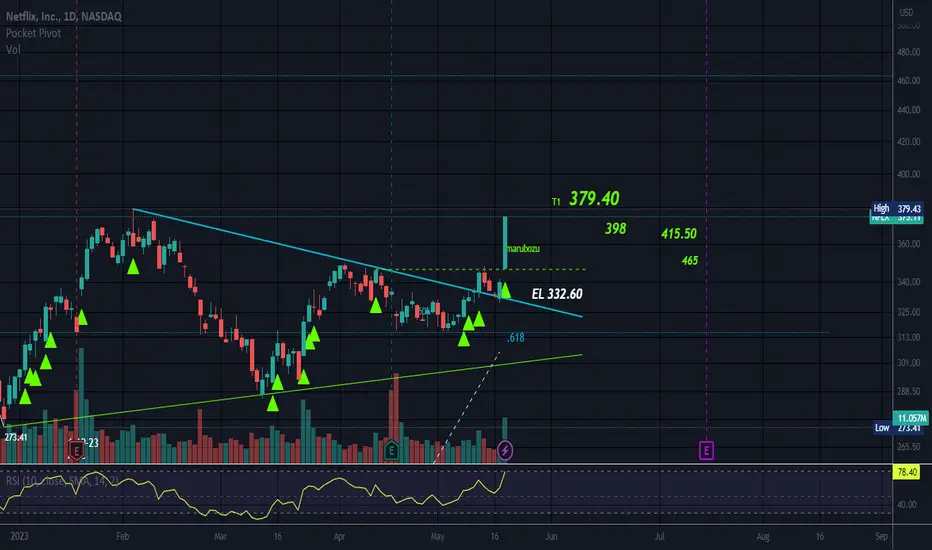
Symmetrical Triangle/OversoldPrice is above long entry level.
Targets in green are targets for a break to the upside with the larger type being T1.
Bullish Marubozu candle with both ends shaven right now.
No recommendation/oversold with RSI on 70/oversold or overbought conditions can linger for extended periods of time.

NFLX breakout daily and 1hr chartNFLX daily and hourly
Top watch going into the week. Daily 9/21EMAs crossed and we broke out of this trendline with an explosive move outside the upper Bollinger band. Ideally, I would like a pullback to the trendline or breakout zone between 332.5-334.5. I've also got my eye on 336.5 level on the hourly chart for a possible intraday setup, but I'd rather bounce it down at key support level. Leaning long on it this week. Once this stock gains momentum it moves very quickly, don't fight the trend.

NFLX AnalysisPrice playing out nicely as analyzed last week, taking out the buy-side liquidity and gave a nice reaction to the downside. Right now, I'm expecting a bearish retracement into the bullish POI at 331.23 before we look for a confirmation for price to go higher.

Netflix - there is a great potential for growthIdea: Long
Horizon: 2-3 weeks
Target 1: 349,74
Target 2: 363,82
Target 3: 379,19
Potential of the idea: 10%
Stop order: $ 314,2
Technical analysis
The price structure is in an upward movement, forming a ‘triangle with a squeeze’ figure along the trend, accordingly there is a high chance of continuing the upward movement. It is better to consider entering a position in the support zone 315.8 - 330.21. The RR ratio when reaching Target 1: 1 to 2. You can only enter after confirmation on younger time frames.
Fundamental factor.
Netflix’s announced plans for four summer investments of $2.5 billion in the production of Korean dramas, movies and reality shows are fueling interest in the service, which will positively affect the price of the asset.

NFLX.. broke outHas a gap to close at 350.. they'll be closing this by next week..
Nflx is apart of XLC sector like Googl and Meta... as you can see they've been carrying the market
Looking at XLC , it has a little more room left to go which I think Nflx will be apart of
I don't know if it goes higher than that or falls off a cliff from there but 350 is my target

NFLX long ideaNFLX daily and hourly
Top watch for me tomorrow. Daily 9/21EMAs crossing, wick down to support, and closing outside of the downward trendline. Leaning long on this. Watching how Disney moves to earnings tomorrow might affect the way NFLX moves. Looking for 334-334.5 zone to hold as support and launch this thing. Under 330 I think we revisit the daily EMAS 327-328 area.

Institutions are dumping NFLX within an apparent diamond patternI spotted this diamond a year ago after the earnings panic.
Since then, I realised that institutions have been dumping Netflix at a prodigious rate.
In fact, NFLX has gone from nearly 100% institutional ownership, down to 74% institutional ownership in around 15 months.
This translates to institutions performing a dump of just over 1.5% of institutional holdings every month on average.
I think this short has a lot of potential if I am correct about the diamond pattern and it's clear that the catalyst is going to be institutional deleveraging.
What I'm looking for to confirm this trade is an ABC move up.
That is to say, the dump back in October Q4 was an A wave down, we are now in a B wave (that subdivides into a smaller ABC move up) and confirmation of this trade will mean that we complete the ABC I have sketched out (zig zag pattern) up to roughly around the 400 range.
An ABC up in this manner means we have a B wave with a C wave decline yet to materialise and it's the C wave we should aim to capture with a short.
I consider this quite a long-term outline and I don't envision this C wave to materialise until next year.
My suspicion, is that NFLX is being harmed by the streaming explosion that has resulted in a massive influx of very aggressive competitors. I think that the password-sharing crackdown will ultimately do more harm than good and do nothing to help their earnings.
So, I'm not saying get in on this now, but the basic premise here is to wait to see if the ABC zig-zag upmove (representing a cyclical B wave) materialises. If it does, I consider NFLX could be an excellent short.


Levee Break Initial target 293 in coming weeks. If that breaks it opens door for downside to 246-267 (point target 267) by mid to late June.
Levels needs to breakdown on path to target: 327, 293, 277


NFLX AnalysisPrice playing out nicely as analyzed last week, taking out the sell-side liquidity and rallied, breaking market structure to the upside. Right now, I'm expecting price to rally towards the buy-side liquidity at 345 area.

Netflix NFLX Next MovePair : NFLX ( Netflix )
Description :
Bearish Channel in Long Time Frame as an Corrective Pattern with the Breakout of the Lower Trend Line and Retracement
Break of Structure
RSI - Divergence
Completed " ABC " Corrective Wave
Bearish Channel in STF with the Breakout of the UTL need to wait until it Completed its Retest
Impulse Correction Impulse

NFLX daily and hourly chartsLevels I am watching to trade options with tomorrow. NFLX daily and hourly charts.
Top watch for me tomorrow, I'm leaning long for day 2 continuation breaking out of this pattern on the daily. Watching this bull flag set up on the hourly chart for a nice move. We have room to push 334.5 and 338. Also watching 328 and 324.5 support zones for a bounce if the flag turns out to be a failed breakout.

$NFLX - bull and bear thesisNASDAQ:NFLX
Daily timeframe
* At the end of this triangle, ready to bust a move
Bull: A move back to $373, if breakout
Bear: A move back to $282, if breakdown

NFLX - Double TopA double top pattern which is considered bearish
This double top formed at a location of strong resistance
Daily chart

NFLX daily and hourly chartsNFLX
Ready to trade this either way. Watching this sweet looking bear flag. Or a breakout of the pattern on the daily remounting the 9EMA and testing the 21EMA like we saw with TSLA on Friday.

Netflix This stock has been weak since earnings. We had considlation from 325-335 for a solid week after the earnings drop to 300 Howver we finally failed 325 abs dropped back to retest the same 316 support area.
We tested it yeateday at close and today at open. It is showing some solid support for now howverr even off the rally today potential double bottom setup, we still contiue to make lower highs and reject the 324.55 today where I got into my short position.
I’m looking for a break of 316 and hold below as reistance to start it’s downward movement back towards 300$ and 292 as my expected low. I’d expect a big bounce from there ba k towards 332$ howbeee if we do get to 292 and bounce and fail 332 area again, the lows below 292 could drop this down towards 250$ overall
Either way my short idea is 322-324 short entry. Or break of 315.80 rejextion can short to 300$ Or place stops and try to bring towards 292

NFLX Double Bottom along with Bullish divergence I have found double bottom in NFLX chart, furthermore we can see bullish divergence on the chart by using RSI indicator, in this point we have to wait and see, if trend is reverse and buyers start taking control than we will take entry as per given plan otherwise I will not take entry at this point.

Netflix Staggers as the Nasdaq SoarsThe Nasdaq-100 hit a nine-month high yesterday, but one prominent name has been left behind: Netflix.
The first pattern on today’s chart is the series of lower highs since early February. (Marked with white arrows.) This demonstrates a lack of relative strength when compared to the broader index.
Second, consider the closing lows of February 10 and April 12. NFLX subsequently rebounded to both levels but failed to hold. Has old support become new resistance?
Third, the stock has been unable to recover from a bearish price gap following its last quarterly report on April 18.
Next, it just completed an inside week barely positive. Such tight price action may suggest it’s getting ready to move.
Finally, the lower study includes our 2 MA Ratio custom script. It recently turned red, meaning the 8-day exponential moving average (EMA) has dipped below the 21-day EMA. That’s a potential sign of a bearish short-term trend.
TradeStation has, for decades, advanced the trading industry, providing access to stocks, options, futures and cryptocurrencies. See our Overview for more.
Important Information
TradeStation Securities, Inc., TradeStation Crypto, Inc., and TradeStation Technologies, Inc. are each wholly owned subsidiaries of TradeStation Group, Inc., all operating, and providing products and services, under the TradeStation brand and trademark. TradeStation Crypto, Inc. offers to self-directed investors and traders cryptocurrency brokerage services. It is neither licensed with the SEC or the CFTC nor is it a Member of NFA. When applying for, or purchasing, accounts, subscriptions, products, and services, it is important that you know which company you will be dealing with. Please click here for further important information explaining what this means.
This content is for informational and educational purposes only. This is not a recommendation regarding any investment or investment strategy. Any opinions expressed herein are those of the author and do not represent the views or opinions of TradeStation or any of its affiliates.
Investing involves risks. Past performance, whether actual or indicated by historical tests of strategies, is no guarantee of future performance or success. There is a possibility that you may sustain a loss equal to or greater than your entire investment regardless of which asset class you trade (equities, options, futures, or digital assets); therefore, you should not invest or risk money that you cannot afford to lose. Before trading any asset class, first read the relevant risk disclosure statements on the Important Documents page, found here: www.tradestation.com .

NFLX- SELL strategyThe chart looks great, a large triangle with resistance $ 378 and support $ 311.
the chances are greater for breaking lower, RSI negative and so is the MACD amongst some others.
Strategy is SELL current and place stop above $ 380 and profit order $ 265 for now.

NFLX:Sell ideaSell idea on NFLX as you see on the chart after the breakout of vwap and support line.Thanks!
