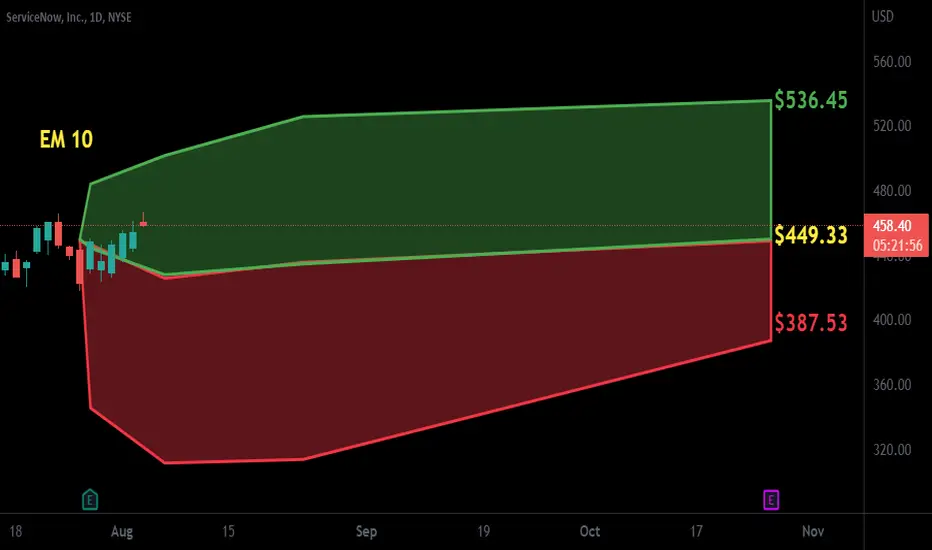
A Path out of ResistanceNOW targets:
1 week: 439 - 451
2 week target: 468-488
1 month target: > 540
Stop Loss for calls: underlying < 398 (sustained break or close)
Stop Loss for shares: < 337
NOWW trade ideas

Perfect Buy Points: IPO’s – The Primary BaseJS-Masterclass #8:
Perfect Buy Points: IPO’s – The Primary Base
When it comes to investing in IPO stocks, new issues don't play by the usual rules.
Companies making initial public offerings draw a lot of investor attention. That often results in unusual and brand-new chart patterns. Volatility can rise as investors size up demand for the new stock. Yet there are opportunities in these cases, if you can spot the correct characteristics amid the price-and-volume action.
The framework of a good IPO base is simple. The decline from peak to low usually doesn't top 20%, but the most volatile markets have produced declines of up to 50%. The length is often less than five weeks and can be as short as seven days. These two factors alone make IPO bases wayward cousins compared with proper bases, such as the cup with handle and flat base, which need at least five to seven weeks of work.
In an IPO base, the pattern typically starts within 25 days of the stock's first day of trading. Know the important similarities with regular bases. For example, the buy point is drawn by taking the prior high and adding 10 cents. The price gain on the breakout should be strong.
There are ways to evaluate these blind spots, however. Important factors include seeing a shallow correction within the base during normal market conditions, a large increase in price and a close near session highs on the breakout day, and heavy volume on the breakout day and week.
Also, the stock should generally form the base above its IPO price.
Example - ServiceNow (NOW)
The business software company, went public in June 2012, at 18 a share and has built its primary base during the period from the initial offering to April 2013 when the stock developed its first perfect buy point.

$NOW with a Bearish outlook following its earnings #Stocks The PEAD projected a Bearish outlook for $NOW after a Negative over reaction following its earnings release placing the stock in drift C with an expected accuracy of 33.33%.

WOW! i like thisOMG what a massive gap
-i like the MONTHLY_WEEKLY between my entry and STOP
- i want the gap to fill and the bounce

Bear trend with a Gap in the last sectionInteresting situation, the stock price is in a bear trend, the price reaches a lower level of the area of attention between the level price 411.15 and 453.29. Leaving a big gap between the close price of the day before. Statistically, the gap price is usually covered in the next sections. the trend looks very symmetrical and looks following the moving average of the 50 periods using it as a support. Let's see in the coming weeks.


ServiceNow - Up to 40% Opportunity to the Downside?Fundamental Indicators:
Revenue- demonstrates consistent long-term growth, 5-year average at 34%
Profits – 2022 TTM has reduced
Net margin - quite low for tech company with just 2.79%
P/E – extremely high at 553 when S&P500 is at 21
Liabilities - debt ratio is at 0.62 which is within normal limits, Net Debt/ EBITDA is negative – no problems with debt
Conclusion – it is very likely to continue bear move with this financial performance
Technical Analysis (Elliott Waves):
Since the completion of the global correction in wave 4 which completed in February 2016we can observe an explosive growth in wave
Main scenario suggests that wave 5 takes shape of an Ending Diagonal with ABC patterns in each motive sub-wave 1-3-5
Waves 1 to 3 have completed and wave 4 is currently developing as a complex series of patterns
This maybe a good opportunity for a short position if $521.04 holds confirming that it is an Extended Flat formation in the link wave X which suggests that there will be another move to the downside in wave Y with target area of $300-$360
This is a higher timeframe to reflect the full history of ServiceNow and to provide full wave count:
What do you think about ServiceNow and its short term prospects?
Also let me know if you would like to see other stocks, indices, Forex or Crypto analysed using Elliott Waves.
Thanks

Looking like it might try and breakoutSoftware stocks were on a tear last week. Even while market was cooling off there were a lot of software stocks making new swing highs. Posted $SHOP last week. $NET $TEAM had nice moves after ER's. If market wants to go sideways again and just not fall then keep an eye on software. That would be week one of a possible reversal. Dont want to jump the gun there but I like the way the charts are shaping up.
$NOW has downtrend line break as well as the top of the range right above it. If that breaks this should have a nice move higher. Keep it on watch next week.

ServiceNow to Start Another Wave Down. NOWI believe we are finishing off X Wave here, which supposes we are to start a new zigzag soon. A zigzag to the downside, because I do not see a single bit of evidence to suggest a bullish rally.
We are not in the business of getting every prediction right, no one ever does and that is not the aim of the game. The Fibonacci targets are highlighted in purple with invalidation in red. Confirmation level, where relevant, is a pink dotted, finite line. Fibonacci goals, it is prudent to suggest, are nothing more than mere fractally evident and therefore statistically likely levels that the market will go to. Having said that, the market will always do what it wants and always has a mind of its own. Therefore, none of this is financial advice, so do your own research and rely only on your own analysis. Trading is a true one man sport. Good luck out there and stay safe.

$NOW with a Neutral outlook following its earnings #Stocks The PEAD projected a Neutral outlook for $NOW after a Negative over reaction following its earnings release placing the stock in drift C with an expected accuracy of 50%.
RectangleEarnings 7-27 AMC.
Neutral pattern until a trendline is broken with a trend in that direction.
Mid Rectangle is 463.02 and some use this level as a stop if trading inside the rectangle.
No recommendation.
EPS (FWD)
7.31
PE (FWD)
60.22
Div Rate (FWD)
-
Yield (FWD)
-
Short Interest
2.11%
Market Cap
$88.20B
ServiceNow, Inc. provides enterprise cloud computing solutions that defines, structures, consolidates, manages, and automates services for enterprises worldwide. It operates the Now platform for workflow automation, artificial intelligence, machine learning, robotic process automation, performance analytics, electronic service catalogs and portals, configuration management systems, data benchmarking, encryption, and collaboration and development tools. The company also provides information technology (IT) service management applications; IT service management product suite for enterprise’s employees, customers, and partners; IT business management product suite; IT operations management product that connects a customer’s physical and cloud-based IT infrastructure; IT Asset Management to automate IT asset lifecycles; and security operations that connects with internal and third party. In addition, it offers governance, risk, and compliance product to manage risk and resilience; human resources, legal, and workplace service delivery products; safe workplace applications; customer service management product; and field service management applications. Further, it provides App Engine product; IntegrationHub enables application to extend workflows; and professional, industry solutions, and customer support services. It serves government, financial services, healthcare, telecommunications, manufacturing, IT services, technology, oil and gas, education, and consumer products through direct sales team and resale partners. It has a strategic partnership with Celonis to help customers identify and prioritize processes that are suitable for automation. The company was formerly known as Service-now.com and changed its name to ServiceNow, Inc. in May 2012. The company was founded in 2004 and is headquartered in Santa Clara, California.

NOW BUY for earnings runNOW continues to bounce off $406 ish support and hits a $511 ceiling within this range, oversold on several indicators no position yet. I would expect a bounce to 50 dma $461.66 then $468 to test cloud resistance. Service NOW reports earnings August 3, 2022

Buy NOWPre-Earnings Target = 498
Post Earnings Target = 556
/// Mid-Long term target coming off this expanded flat is upwards of 900

NOW: Big Buying OpportunityI have long been a pessimist of this stock solely because of its high P/E, but after this weeks sell-off of almost 20% it's not a big gamble to go long here. With a gap created, I think it's feasible to see NOW to get back to $470 before shorting again.
If you see what I see you know why, but if not feel free to message me and I'll explain further. Trying to keep these posts short and sweet for us pro traders
Not financial advice

$NOW Not Going to Be An Easy ShortThe bears are all over on this stock and the media are saying more downside is expected. I agree but not so quick. It is possible to get a short term upthrust to shakeout and then the price eventually would return to value level. If you are already a buyer, try to trim some on any strength when that presents.


NOW - short after break of red boxIf the curve is broken and the head and shoulder is broken then measured move to green box. The monthly MACD has crossed should help the bear case. If the bubble pattern plays out the below the black line. Lot of bubble out there.

NOW 460 PE head & shouldersIn a market where stocks like MU have a 7 PE getting taken to the woodshed one has to wonder how this can have a 460 PE!? I have traded service NOW for almost a year off and on both long and short, mostly short. Head & shoulder clear on chart as I posted 6 months ago, bear market rallies are an opportunity for bagholders to exit overpriced overvalued stocks.

Many Stocks Have Aleady Filled the Double GapsStocks like NOW have already filled the double gap. Most are now overbought on daily MACD's. IF markets start to sell off, MDB could fill the gaps on the downside.

NOW - Fall to Major Trend LineNOW has developed a strong trend line on the daily timeframe it is quite above this line right now (solid white line)
It has broken now below the dotted ascending white line, so I am assuming price decline will decline to the strong major trend line
Three bottoms along this line will be in red circles

Short Idea: ServiceNow ($NOW)Price close to 200EMA + Long term bearish scenario = Possible downtrend breakout and continuation.

NOW 450 PE head and shoulders bear market Service NOW stock looking tired from recently rally. Service NOW has posted great earnings repeatedly, no doubt. But 450 PE ratio is outrageous considering the bear market we are heading into. First target is $450, next target is a new 52 week low under $400
