NOW- STRONG BUYNOW is bottoming as well and similarly as AMZN stochastic RSI is positive on weekly chart. This gives good room for a recovery back towards $ 500-525.
Strategy BUY current $ 440-455 and take profit $ 515 for now.
NOWW trade ideas

NOWSeems likely for NOW to fall to this weekly volume shelf at support before getting any meaningful bounce. Stocks continue to slide.
280-300 support is likely where it falls to

$NOW with a Bullish outlook following its earnings #Stocks The PEAD projected a Bullish outlook for $NOW after a Positive over reaction following its earnings release placing the stock in drift B with an expected accuracy of 83.33%.

JICPT| Bullish setup of Now on sideway structureHello everyone. Now has got my attention as its price approached the bottom of the range, followed by a series of bullish candle sticks.
On the weekly, it's rebounding from the long-term MA.
On the daily, it's leaving the bottom area with $546 and $592 served as supply level.
What do you think? Give me a like if you're with me.

22/4/2022 NYSE NOWDesicion to Short. Entry Price = $475.30. Target Price=$488.80. Stop Price=$502.30.

$NOW with a Bullish outlook following its earnings #Stocks The PEAD projected a Bullish outlook for $NOW after a Positive over reaction following its earnings release placing the stock in drift B with an expected accuracy of 80%.

NOW failed to break neckline on head & shoulders= DEATH CROSS!!!Death cross officially printed last week, along with the Nasdaq. This is a SELL signal! Next stop $480. The PE has come all the way down to 491 lol. As multiples continue to compress on these high flyers this stock has a long road to go with many bounces and failed attempts to rally. Without help of the fed's perpetual 14 years of QE and artificially low interest rates these companies will have to learn to live within a budget without benefit endless free cash in this mother of all bubbles stock market casino!

Zigzag on NOW. NOWGoals 474, 424. Invalidation at 781
We are not in the business of getting every prediction right, no one ever does and that is not the aim of the game. The Fibonacci targets are highlighted in purple with invalidation in red. Fibonacci goals, it is prudent to suggest, are nothing more than mere fractally evident and therefore statistically likely levels that the market will go to. Having said that, the market will always do what it wants and always has a mind of its own. Therefore, none of this is financial advice, so do your own research and rely only on your own analysis. Trading is a true one man sport. Good luck out there and stay safe

NOW: Best Time to ShortI've been holding puts on this for a week now and it, like other tech stocks, are floating up in space in consolidation mode. This stock is one of the most volatile and I think it'll play out nicely when it drops. And it'll be a BIG drop. Looking at $480 as first target, then $411.
Not financial advice
ServiceNow Hits Resistance After EarningsServiceNow is exactly the type of cloud-computing growth stock that benefited from the pandemic. Is it now rolling over as the crisis fades?
Consider the dive under $500 in January. NOW rebounded on strong quarterly results and an upgrade from Piper Sandler last week. Yet, prices failed to reclaim $600.
That level could be important because it’s near two lows in December. It’s also near the 200-day simple moving average (SMA).
Speaking of the 200-day SMA, the 50-day SMA is falling toward that key line: a potential “death cross.”
Third, notice how stochastics are sliding back from an overbought condition.
Finally, you have the valuation argument because NOW trades for about 475 times earnings. (Near the top of the overall S&P 500, according to TradeStation data.) That’s a potential headwind given the rising interest-rate environment.
TradeStation is a pioneer in the trading industry, providing access to stocks, options, futures and cryptocurrencies. See our Overview for more.
Important Information
TradingView is not affiliated with TradeStation Securities Inc. or its affiliates. TradeStation Securities, Inc., TradeStation Crypto, Inc., and TradeStation Technologies, Inc. are each wholly owned subsidiaries of TradeStation Group, Inc., all operating, and providing products and services, under the TradeStation brand and trademark. When applying for, or purchasing, accounts, subscriptions, products and services, it is important that you know which company you will be dealing with. Please click here for further important information explaining what this means.
This content is for informational and educational purposes only. This is not a recommendation regarding any investment or investment strategy. Any opinions expressed herein are those of the author and do not represent the views or opinions of TradeStation or any of its affiliates.
Investing involves risks. Past performance, whether actual or indicated by historical tests of strategies, is no guarantee of future performance or success. There is a possibility that you may sustain a loss equal to or greater than your entire investment regardless of which asset class you trade (equities, options, futures, or digital assets); therefore, you should not invest or risk money that you cannot afford to lose. Before trading any asset class, first read the relevant risk disclosure statements on the Important Documents page, found here: www.tradestation.com .

NOW head & shoulders 510 PE ratioYes, the quarter growth was impressive, but on 5.9b in annual sales revenue and a mere $230m in NET INCOME with a $114.3 billion market cap. It will take 495 years of net income to catch up to this market cap. There's no bubbles here, just keep buying!!!! We are in a bear market, accept it or not. This stock is going to have a very difficult time breaking past the neckline and printing any new highs in this environment. Nearest profitable competitor CRM has twice the market cap but 1/4th the PE. When insiders are selling SO SHOULD YOU!! finance.yahoo.com

Swing puts on a highly overvalued software stock(thank you @ShortSeller76 for this idea)
Since I do not follow this stock and am buying options on it for the first time, I am keeping very small positions. Also the volumes are low and spreads are wide, so this is further reason to use less capital. I am keeping my capital risk low while the reward potential high. According to my brokerage data, this stock is 88% institutional owned so selling could mean heavy selling, the stock is overvalued, and its high earnings surprises over past year may indicate peak growth.
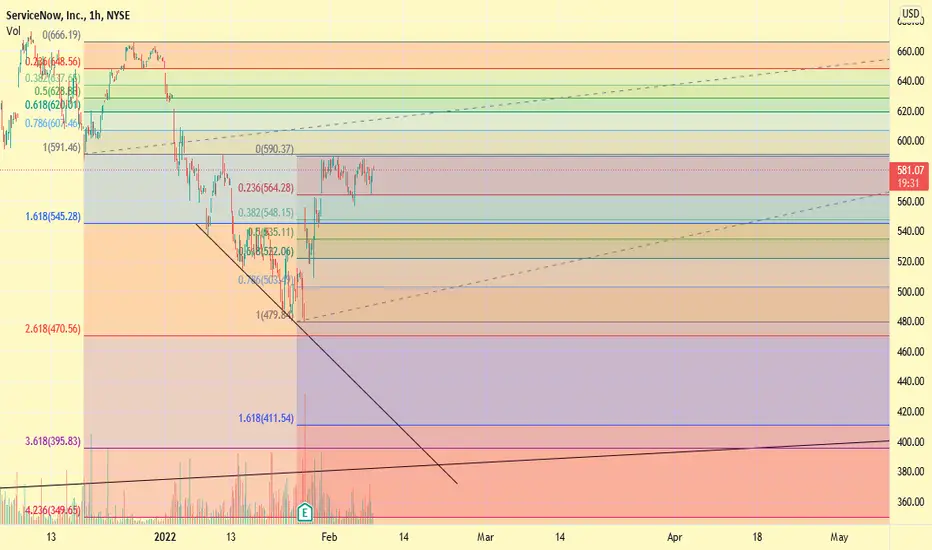
Daily chart:
> Price is up against 200sma, while 10sma is still under 20sma
> RSI jumped from under 30 to test 50 thus far but I expect it to reverse down since RSI went under 33.33.
> Stochastic %K gave a bullish warning in its rise between 26-28 Jan, and usually it reverses down before rising again. I stress - this is an indication, not a prediction.
> Technically, I see good reason to buy puts with stock between 580 and 588.40.
30min chart:
> 588 is a reversal area after a 5-wave move up
> RSI shows the 3 price peaks (rectangle) in this move, and in this case the move up is counter to the daily downtrending ma's
> Stochastic %D is above 80 again and should turn down soon.
Taken altogether, my ideal trade would be to hold this as a longer swing down for the stock to reprice after future earnings. However I could be wrong about this and options are too expensive that far out. This stock may also reprice lower if markets sell off more. Due to theta decay and unpredictable IV-based changes, and to manage risk, I am using two different expiries.
The TRADE:
> BTO 4Feb 550 puts at $3.20
> BTO 18Mar 450 puts at $5.40
> Exit 4Feb puts if stock goes over high of day.
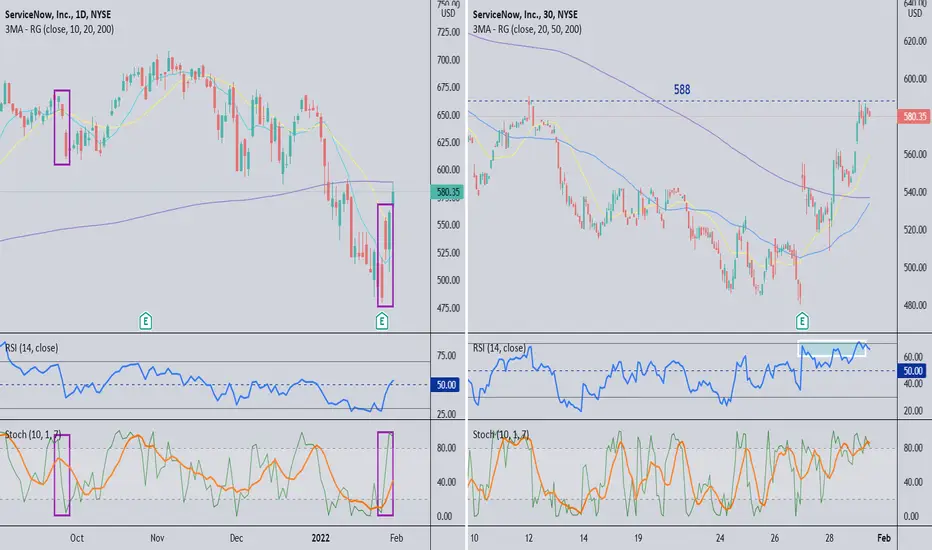
short NOW possible head and shoulders Volume drying up after earnings run, stock appears to be getting tired here and hitting resistance. I am short via puts and have February 25 $570 puts. Good luck! The 50dma appears to be crashing down on to the 200dma, this is a bearish SELL signal if confirmed. Possible head and shoulders in play which could take some time to play out with 513 PE Good luck!

Possibly short NOW Monday or Tuesday after 3 day ER runWaiting for earnings run to diminish Monday/ Tuesday to see if it can pierce through overhead resistance high $560's, 200dma additional resistance at $588.99 and 50 dma at $607.24. If this level fails $423 is support on a very volatile stock with a 495 PE!!! in an environment of "value" rotation away from PE.

Short NOWAnalysts predict that ServiceNow can whether any economic conditions, but let's be realistic... NOW has one of the HIGHEST P/E ratios of any stock I follow and if it can't break above resistance which is around 562, I see this stock plummeting to under $400 real fast. I bought PUTS this morning as NOW was approaching $542. I'm comfortable if NOW reaches 562, because this stock moves in either direction very quickly.
Not financial advice

Service Gone...Both bottom zones are quite far apart but for now only one thing is clear...service rekt, expect lot's of down use other tickers to confirm bottoms easier...but it don't look good.

Offshore Watchlist: ServiceNow (NOW)ServiceNow is an American software company based in Santa Clara, California that develops a cloud computing platform to help companies manage digital workflows for enterprise operations.
Preferred on the price clearing and holding $707.90.


TrendyTrades: NOW Bullish Analysis If we can continue to hold above this level (fib) than NOW looks very bullish and we can see it reaching the next fib level at 744. Currently at 587 and so this is a long term analysis based off the weekly/daily chart

$NOW with a Bullish outlook following its earnings #Stocks The PEAD projected a Bullish outlook for $NOW after a Positive Under-reaction following its earnings release placing the stock in drift A
If you would like to see the Drift for another stock please message us. Also click on the Like Button if this was useful and follow us or join us.

NOW $600s Soon? Keep Watch!As you can tell, $566 is a key price in the past few months.
We have seen double top bounces from $566 resistance.
If we get past this level, say around $570, we can definitely see this stock going to $600.
Be wary, this stock has shot back down from $566, so this is very important to see how the price moves in the upcoming days.
Things to note, Daily chart, RSI showing overbought, we may get a slight dip once past $566.
Currently have no position.
Please let me know what you guys think in the comments. Let me know other stocks I can post. Thank you!

RSI very over bought! needs to cool off a bitlooks like a potential double top scenario here on NOW, bears are trying to take it lower now and profit taking may begin. look for a test of 560 or lower in short term if we continue to see weakness after the rejection. goodluck! dont forget to like and follow if you enjoy my ideas <3

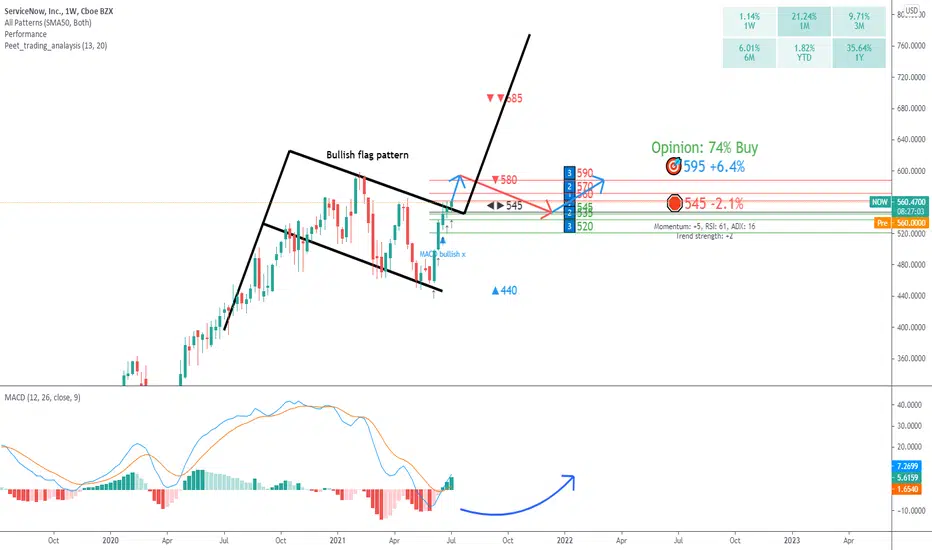
NOW: bullish flag pattern?Upside price momentum supports the bullish trend direction.
Increasing trend strength also supports the bullish trend.
RSI leaves enough room for further upside price potential.
Recent Bullish MACD crossover acts as further support.
A price action below 545 will change the trend direction to bearish.