NTES - Inverted Head and Shoulders +50% PTNice inverted head and shoulders, looking ready to pop!
Price target ~150-160
NTES/N trade ideas

$NTES - super long play (6 months)Unusual options
6/18 - $125 strike
9/17 - $120 strike
ATR is down
stochastic is bottomed out
watching for low entry
My ideal call purchase: 9/17 call option at $115 strike

ABC BullishI have had this for a few weeks and there have been a few scary days for sure.
Support has held so far and my stop is at 102.77. Resistance overhead. Whenever a security has pulled back so far, I suppose there is always a bit of R overhead. Folks are stuck up there and in probable financial pain. It is not surprising when they will sell on rallies to relieve their wallet of the pain they are experiencing. It is hard to hang through it though and makes buying close to support important in most cases.
It appears C is C but next pull back day, or rainy market day, will tell the tale I suppose.
Not a recommendation.
Negative volume and OBV are both high.
Trading can be risky business, and I guess investing can be too. The market has been riddled with uncertainty, and it makes me feel, well, uncertain..lol. Nothing is a given that is for sure and Mr Market has not been handing us a whole lot of no brainers as of late (o:
The cup and handle pattern broke out a while back and targets were met before the deep pull back. There was also an inverse head and shoulders a while back.


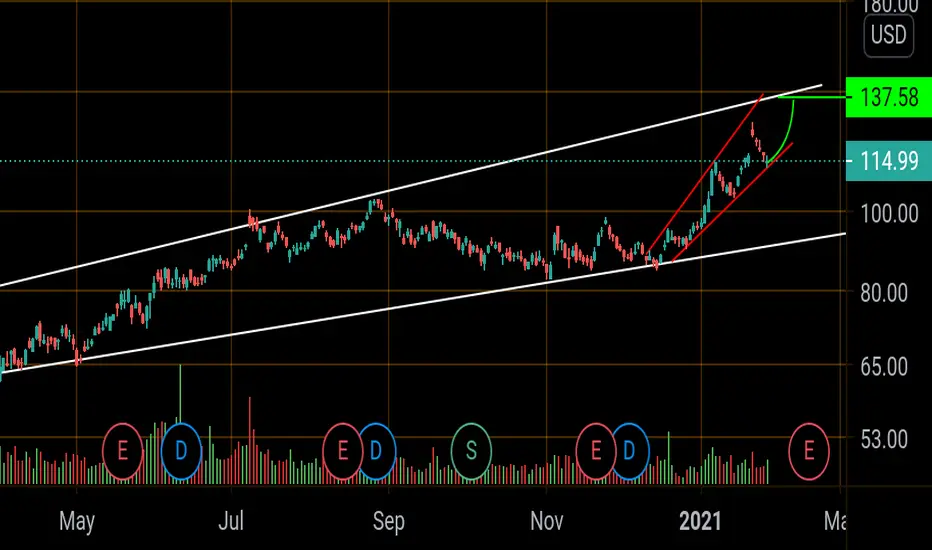
Ntes channel update White lines are the major channel trend .
Red lines are the secondary channel.
Had a healthy pullback last few day and bounced off the channel support (Redline).
I think this will be its last leg up to the top of its primary channel (137) and then a pullback to the mid 90's
Trade Update: What a gameNTES has been a fantastic trade to say the least. A range reversal trade that has turned into a full on breakout. On todays strength I think its a good time to move my stop up to the gap at 117.56. Anytime a stock goes parabolic you know a pull back can come at any moment.


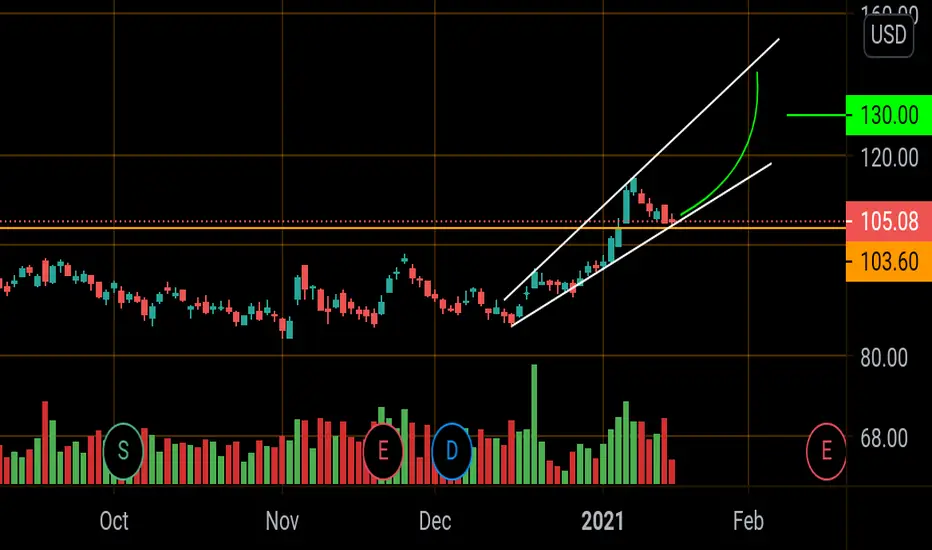
Channel tradeI traded this stock a few times before it split 4 ways back in october. After the split in moved sideways a bit so I set an alert and was surprised when my alert kicked in last week when it crossed 97$. Never got in the trade and I was peeved when it shot up to 20$ in 4 days. It's at the bottom of it's new uptrend channel , selling pressure lowered and OBV is crossing.
Gold line /Support
Greenline/ Target
Inverse Head and ShouldersNTES has formed a cup but there is no handle...yet.
It is possible that the handle is at the top of the cup but I did not try to guess where the handle is. When the handle is at the cup high, it often leads to an explosive break out. But it is also possible the stock will pull back and form a handle in the near future.
In a bullish stock and a bullish market, the 1.272 fib level and above can come in to play
Also an inverse Head and shoulders and has surpassed neckline. (NL) The neckline which was resistance, now serves as support..
Overbought conditions are close on daily RSI. RSI is set on 80 and 30. Stocks can hover there for a while and may dip in and out of overbought conditions for a prolonged period of time. It is not overbought on weekly or monthly,
The inverted head and shoulder pattern is formed in the downtrend. It’s formed because of the change in how investors perceive the stock or the stock market. The stock is trading lower or at the bottom. Not the case here as NTES was not at the bottom. This drives some investors to buy the stock. The stock prices rise to form the pattern’s left shoulder.
The temporary downtrend drives the stock down. Investors buy the stocks because they anticipate that the trend will reverse. The stock price increases. The psychological or fundamental factors drive the stock prices. As a result, the head of the pattern is formed.
The stock corrects and reaches the same bottom level as the left shoulder. Since it’s at the support level, it rises back to the neckline level—or resistance level. This forms the right shoulder. The right shoulder is approximately the same height as the left shoulder.
Not a recommendation

$NTES - new faveI've been watching and playing options in ATVI and EA for a month.
NTES is now following their trend.
Played options today for 15% gain in 30 min. Was a nice easy win to start the year

NTES long term outlook BullishTechnical
NTES is looking very bullish on the weekly,
Currently showing elliot waves cycle on wave 4
Consolidation around this level
Getting ready for that wave 5
Targets 130-140
Again long term - this is a weekly chart the drawings mapped could are months to years out
Fundamental
AI narrative has been picking up steam, expect this one to grow significantly over the next few years
Solid long term play


$NTES with a neutral outlook after earning release The PEAD projected a neutral outlook for $NTES after a positive under reaction following earnings release placing the stock in Drift A
If you would like to see the Drift for another stock please message us. Also click on the Like Button if this was useful and follow us or join us.

Can NTES head back toward November highs?After entry by our model in November we felt great after a quick rise to 96 only to watch the gains disappear. We have held steady in the face of volatility hoping for a completion of an upwave toward 102. China stocks have been in consolidation broadly but if they regain momentum ntes should be a winner.
Ingenuity Trading Model is an algorithm used in- Stock, Forex, Futures, and Crypto markets. The model is a Geometric Markov Model : Focuses on reversal and continuation wave structures
In probability theory, a Markov model is a stochastic model used to predict randomly changing systems. Markov Models are used in all aspects of life from Google search to daily weather forecast. The randomly changing systems we focus on are the equity, futures, and forex markets. The geometric element of the model is the fractal sine wave structure you can find on any chart you look at across any market and across all time dimensions.
Our model focuses on the current sine wave formation (current state)- geometric price formation along with its volume and volatility over a given time period and using that information to predict the future state- future price movement. For questions or more information feel free to contact me in the comment section or via private chat

NetEase. Long from 87 soon.Monthly
Uptrend
Over last 5 years become more volatile
Since it is Game industry.
Weekly
Uptrend
I expect slowing activity and weak earning of Feb 2021 and buy from them.
Daily
Open LONG 87
SL 81
TP 120
RR 5


$NETS Range Breakout$NETS Range Breakout - need a close today > $427 for confirmation.
Possible medium term target: $475-$500 range
Note: Not investment advice.

$NTES NetEase Inc - Bullish Options Flow$NTES NetEase Inc - Bullish options flow today with a breakout to a fresh 52 week high, closing above $500 for the first time ever.
Just under 1k $340.00 strike (very deep-in-the-money) Sept 18th calls traded today for a total premium outlay of about $16M or ~$17,500 per contract. It is highly likely that this was a large hedge fund that made this trade.
An options trade this deep-in-the-money is essentially leveraged stock trading. There is no gamble, there is no extrinsic/time value baked in. The premium paid is almost 100% intrinsic value with a very high delta.
Near term target: $540.00-$550.00 range
Note: Not investment advice.


Descending wedge pattern, one of my favouriteHere, I want to show traders the power of this pattern ; the descending wedge pattern.
Now, please note that this is a pattern , just a pattern and barring any unforseen circumstances, it is likely to break out of the bearish wedge and goes higher (a bullish move).
Now, you witness a 15 min IPO shares -Netease newly listed in HK.
Here's a few more examples :
1. JFIN You can get a 5 fold returns if you are nimble enough OR if you are late to the game, you end up paying a high price as sellers come in fast and furious.
2. EURUSD
A short term trade. Notice once it reaches the resistance line and if one does not take partial or full profits, you are at the mercy of the Market.
3. Dada Nexus - A very short spike followed by share price tumbling down. If you had bought this IPO and had no intention to hold it for long term, then you are subject to this price volatility. Are you OK ? Can you sleep at night ?If not, don't wager on it.
4. The talk in town - Genius Brand
5. The fear index, VIX
This one caused much panic in the recent market with its sharp spike up from 26 to 44, bringing SPX500 down nearly 10%.
6. EURCHF
Here, you gained more than 400 pips profits for holding on to it for nearly a month.
7. SPX500 An 800 point profits for holding on for 3 months
I hope these trades give you a clearer idea what you need to do. Once executed, your job is not complete. Just because it breaks out, it does not mean it must goes up. As traders, you need to react fast to the market and sell, reduce positions, etc to protect your positions.
