Will ON Breakdown or Retest At USD65.62 ?Disclaimer: This is only my personal analysis/judgement and this analysis could be wrong. Please invest/trade at your own discretion.
Based on the chart, we can see that the price lies above the trendline and also above EMA10,21,50 and 200. This shows that this stock currently moving in an uptrend direction which is a good condition.
This stock already reached an all-time high on 28 Dec 2021 then, the price drop after that (29 Dec 2021-31 Dec 2021). But, it looks like a retracement because the price drop with a low volume and the RSI did not fall steeply and still maintain above 60% level.
So if we want to go long, I suggest that we have to wait the price Re-Test at USD65.62 first and breakout the resistance price USD67.04. Then, we can use a resistance price USD67.04 as our entry signal.
ON trade ideas

ON: Bullish Flag (30%) Ascending Triangle (77%) OnSemi is a semiconductor company part of the Information technology sector.
Left hand side graph shows a confirmed bullish flag on the daily with a possible total gain of 30% and a price target of 77.98$$.
Right top graph shows the weekly chart with a confirmed ascending triangle and possible gains of 77% for a price target of 76$$.
Both daily and weekly graphs show a similar positive trend and similar price targets.
The information technology sector is shown on the bottom right graph (weekly chart). This time we have price action running within an ascending channel with an obvious uptrend. This reinforces the possible gains for OnSemi. Information technology is carrying stocks within the sector with a pretty good momentum with no end in sight.
Help if you can! Joins me on Patreon for "one on one" discussions about stocks.
Stay humble, have fun, make money!

a rational tradeso $ON is without a doubt an amazing company so I'm not betting on it to die
just mean reversion
I have a 12/17 put because just look at it.
overbought, big gap, little support, crazy run, QQQ at the top of it's channel
everyone thinks semi's can't fall with NVDA and QCOM and AMD but just mean reversion is needed with such fast moves
I may buy when it hits $50 (which is my target) because it's great
just a chill trade

BUY Opportunity - Great setup post earning1. Long-term uptrend
2. Strong Bullish candle with huge volume post earning
3. Wait for a pullback to determine the right entry to get ON board

ON BUY 51.9 ON Semiconductor's (ON) fiscal third-quarter results exceeded Wall Street estimates with double-digit revenue growth driven by strong automotive and industrial demand, while the chipmaker provided an upbeat fourth-quarter financial outlook.

On semiconductor I've had it since right before last earnings
I'm very pleased, so far.
Wondering if I should stay or re-rack
hmmmm
Thanks
Kaz

Strong SupportAt least short term we are facing a good support here. So a sufficient retracement shall be expected.

$ON very tradable 9pretty chart, bullish trade for next week. Semis will likely follow $NVDA if it breaks ATH
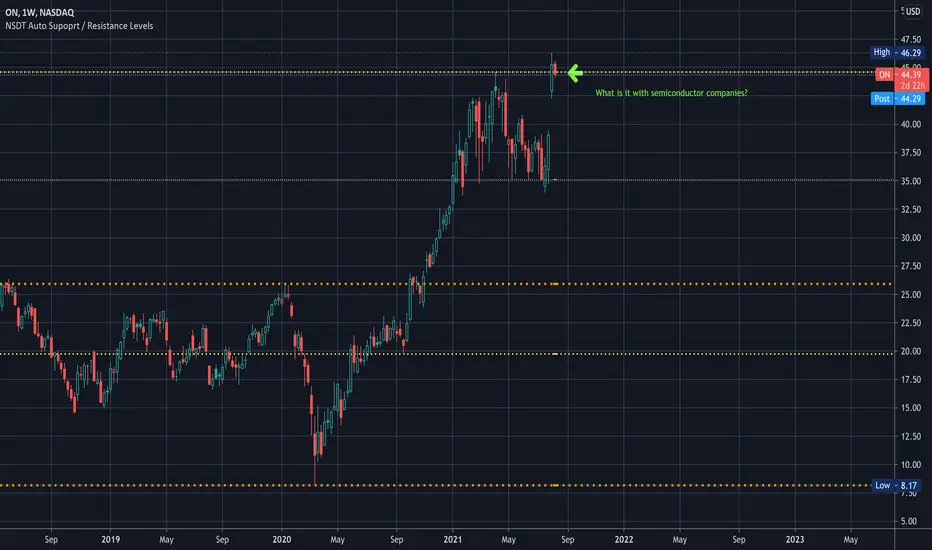
SUPPORT & RESISTENCE in one... What is it with the SemiConductor industry...?
This is support and resistance all in one... let's see what happens... I have no position...
On Semi - Blowoff Top - House of CardsOverhyped Ponzi Pogs. Same as the rest. Cash exit while you can. #chipwars

TARGET HIT $ON @ 43.61 for 20..01% Profit in 47 daysTARGET HIT $ON @ 43.61 for 20..01% Profit in 47 days
Woooot!! I'll take it 💃🏻

🟢 ADDED to $ON NEW Target 43.61 for 20.1% (Risk Level - Med)🟢 $ON Target 43.61 for 20.1% (Risk Level - Med)
Additional add level @
Or double position at 29.74
-----
—
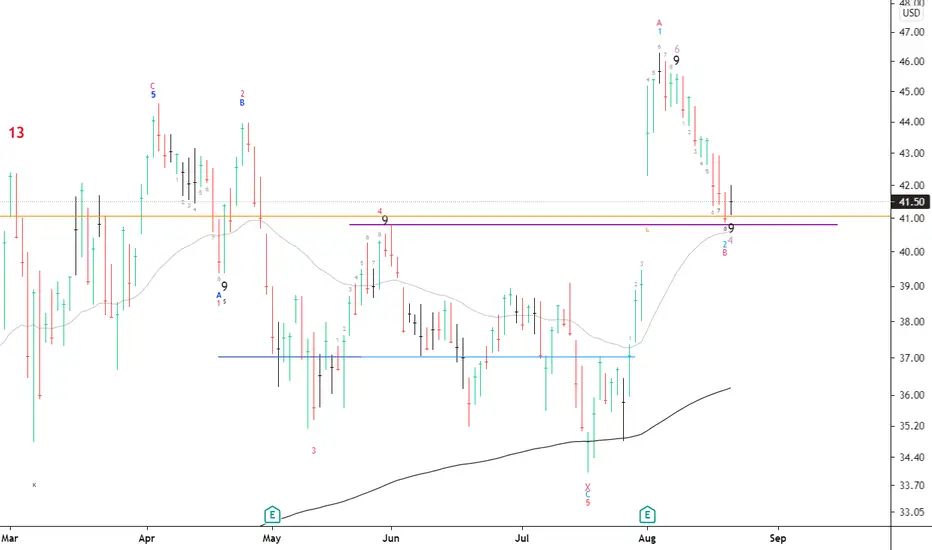
On the far right of the chart is my Average (Grey) Current Target (Green), and Next Level to add (Red) Percentage to target is from my average.
Numbers with an A are places that are a good idea to add if you can.
Numbers with a D are places where you should double your position.
I start every position with .5 - 1% of my account and build from there as needed and as possible.
I am not your financial advisor. Watch my setups first before you jump in… My trade set ups work very well and they are for my personal reference and if you decide to trade them you do so at your own risk. I will gladly answer questions to the best of my knowledge but ultimately the risk is on you. I will update targets as needed.
GL and happy trading.

Possible another leg upHigher low is forming. It did not break in the last trading days. I can see another leg up before the next earnings.
Target: $44
Stop loss: $37
Easy risk manageable trade.
For self-education use only. Not financial advice.

NEW POSITION $ON Target 44.34 for 19.71% $ON Target 44.34 for 19.71%
Or double position at 29.74
—
On the far right of the chart is my Average (Grey) Current Target (Green), and Next Level to add (Red) Percentage to target is from my average.
I start every position with 1% of my account and build from there as needed and as possible.
I am not your financial advisor. Watch my setups first before you jump in… My trade set ups work very well and they are for my personal reference and if you decide to trade them you do so at your own risk. I will gladly answer questions to the best of my knowledge but ultimately the risk is on you. I will update targets as needed.
GL and happy trading.


ON rally after earningsSector is bullish on a Fundamental Macro point of view. EPS is expected to be up 14% from last year.

$ON Back to the trading range?ON bounced off the daily 8 EMA last week, but it's in a bull-flag formation at the moment. I would like to see a stronger decline in volume in the next few days, for ON to go back down to the range it had been trading for a month, in order to cool off indicators before ER and get ready for a move higher. This bull flag could be breaking out any day, but so far indicators show a little bit of cooling off before that happens. Anything below the trading range on the chart, should be a change of trend to the downside.

$ON Breakout Retest Bounce PT $50-$52$ON ON Semiconductor Corp
Broke through ~$42.30 resistance last week...appears to have successfully retested that level as support today (combined with 9d ema line support).
Beautiful setup with a high probability of a bounce from here. Note: a close back below ~$42.30 would negate this setup.
Near term target: $50-$52 range possible by end of April (16%-21% return)
Note: This is NOT investment advice. Educational only.

$ON HAD BREAKOUT N IN THE INITIAL RETEST STAGEON #NASDAQ its on. #semiconductor Another breakout on the move. Looks like a possible retest giving us a good chance of getting in.with a possibility of 20% upside for now,

