TradingView Show: Trade Ideas You Can't Miss with TradeStationJoin us for a timely TradingView live stream with David Russell, Head of Global Market Strategy at TradeStation, as we break down the latest rebound in the markets and what it could mean for traders and investors. In this session, we’ll dive into:
- New sectors to watch, like homebuilders
- Prior insights on companies like Coinbase and Micron
- What trades are setting up, why, and educational concepts to plan for them
- Upcoming economic news and more to have on your calendar
- Key charts, indicators, and technical patterns to watch for signs of sustained momentum
- Essential strategies for navigating market recoveries, corrections, and upcoming Federal Reserve decisions
Bonus: Discover our latest broker integration update with TradeStation—now supporting equity options trading directly on TradingView. This upgrade brings advanced tools like the strategy builder, options chain sheet, and volatility analysis to your fingertips, making it easier to trade through uncertain market conditions.
This session is sponsored by TradeStation, whose vision is to provide the ultimate online trading platform for self-directed traders and investors across equities, equity index options, futures, and futures options markets. Equities, equity options, and commodity futures services are offered by TradeStation Securities Inc., member NYSE, FINRA, CME, and SIPC.
OPEN1 trade ideas

$OPEN asymmetric risk/reward- Market cap is super low and rate cuts could fuel a multi bagging opportunity
- Risk of going bankrupt is not a concern for at least 2 years.
- Good R/R for a swing.
OPEN WEEKLY TRADE SETUP — 07/23/2025
🏠 OPEN WEEKLY TRADE SETUP — 07/23/2025
📈 Volume Surge + Call Flow = Bullish Bias Confirmed
⸻
🔍 MARKET SNAPSHOT
All major models signal STRONG WEEKLY BULLISH bias, supported by:
• 📊 Weekly RSI = 85.9 (RISING) → 🚀 Momentum confirmed
• 📉 Daily RSI = 83.3 (FALLING) → ⚠️ Overbought zone, short-term pullback possible
• 📈 Volume Ratio = 6.7× Last Week → Big accumulation
• 🔁 Call/Put Ratio = 1.35 → Flow favors upside
• 🌪️ VIX = 16.1 → Normal regime = Clean premium action
⸻
🎯 TRADE IDEA — CALL OPTION PLAY
{
"instrument": "OPEN",
"direction": "CALL",
"strike": 2.50,
"entry_price": 0.26,
"profit_target": 0.39,
"stop_loss": 0.13,
"expiry": "2025-07-25",
"confidence": 80%,
"entry_timing": "Open",
"size": 1 contract
}
⸻
📊 TRADE PLAN
🔹 🔸
🎯 Strike 2.50 CALL
💵 Entry Price 0.26
🎯 Target 0.39 (+50%)
🛑 Stop Loss 0.13 (risk control)
📅 Expiry July 25 (2DTE)
📈 Confidence 80%
⚠️ Risk High gamma + overbought daily RSI
💡 Size Tip Keep risk to 2–4% of account capital
⸻
🧠 MODEL CONSENSUS
• ✅ All models agree: Weekly trend = UP
• ✅ Heavy call flow centered around $2.50
• ⚠️ Caution on timing: falling daily RSI = maybe wait for early dip?
⸻
💬 Drop a 🟩 if you’re riding OPEN
📈 Drop a 🕒 if you’re waiting for the dip
🚀 Looks like momentum wants to go higher — but gamma’s real, manage tight!
#OPEN #Opendoor #OptionsTrading #CallOptions #WeeklySetup #BullishTrade #GammaRisk #VolumePlay #TradingIdeas #AIPoweredAnalysis

Open Door Cloud Trend Amazing StudyOpen was one of my holdings that surprised to the upside due to certain Hedge Fund Speculators, as seen on my Chart.
This one could be a 100 bagger - he said. And possible correct.
Huge volume and range - shows how that this is now a Meme Stock.
As always if you are unsure please consult with your own personal investment Advisor before making any Trades or Investments as most are 12 months or more views.
Should you appreciate my comments and chart studies - please smash that like button. It's just a click away.
Regards Graham

OPEN Long to 10.69Down ~98% from 2021 highs, changes to the business model, VC money is all sold (likely), and a chart to die for. I like it to IPO price, should tap within 18 months.

Trump firing Jerome is bullish for $OPEN - Trump firing Jerome is bullish for physical assets like real estate, gold, materials.
- Trump would most likely appoint a FED chair which will lead to lower interest rates.
- Lower Interest rates (Macro tailwinds) + Improving business model (fundamentals) + technical breakout = 🚀

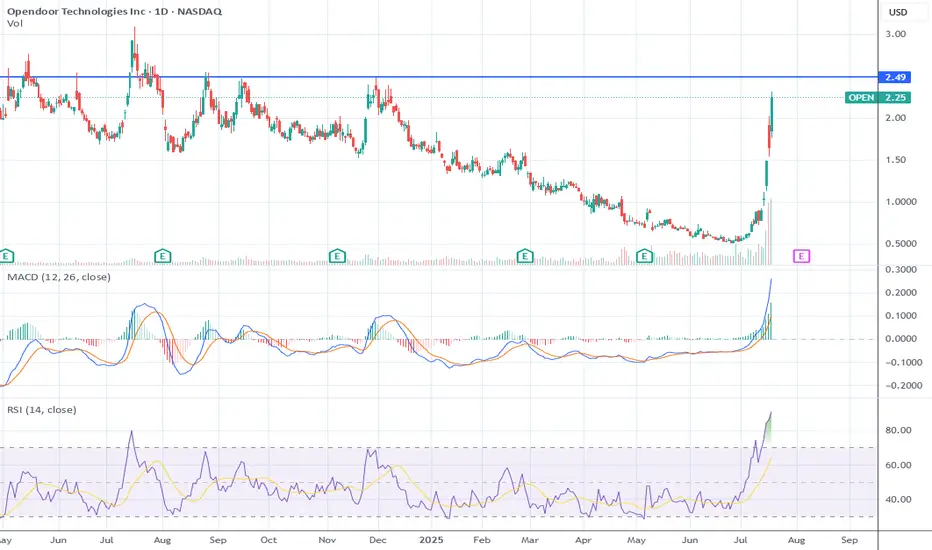
$2.50 Battle Zone: Breakout Fuel or Bull Trap?Candlestick Context & Psychology
This rally comes after a huge drift lower. That context matters a lot. Here's why:
After long downtrends, sharp rallies are common (“dead-cat bounce” or true reversals). The last 3–5 candles (large white Marubozu) show massive momentum. But the latest candle is starting to show upper wicks → this often means the first sellers are showing up into strength.
There are good signs in terms of volume and price action, but we’re also in a danger zone for “exhaustion”. The strongest moves often attract late buyers, meaning that when upper shadows begin appearing after large candles, it’s often the first sign of a reversal or at least consolidation.
Boxes & Structural Resistance
Prior Darvas range: $0.40–$1.00 → broken cleanly. Current price is attacking $2.50, which is not just a round number but prior supply from a breakdown zone in April–May 2023. A clean close above $2.50, with volume expanding, would indeed “clear the air” for higher moves.
But if it stalls or wicks hard here, it suggests trap potential.
🔢 Fib Extensions Say This
Measured from $0.40 → $2.31:
🎯 127% = $2.71
🎯 161% = $3.09
🎯 200% = $3.63
If $2.50 breaks, these are logical targets. But remember, $2.50 is a battle zone. If sellers defend it → we could see a sharp drop back to $1.90–$1.65 retracement zone.
On Eric Jackson & News
Fund managers being bullish can help sentiment short-term. But price action > opinions. If big funds were heavily accumulating, we’d expect steady volume and a controlled advance—not this vertical surge. Right now, the chart screams short-covering and retail momentum, not yet sustained institutional accumulation.
Tactical Take
If $2.50 breaks + closes strong (esp. on above-average volume): I agree —it opens the door for a run to $2.70–$3.09.
If price gets rejected at $2.50 (upper wick, reversal candle): Expect a violent pullback toward $1.90–$1.65.
RSI at 90+ says late longs are entering now → reward/risk here is terrible for new longs. Only aggressive traders can play breakout momentum above $2.50 with a tight stop. I wouldn’t be surprised if smart money uses this rally to lighten up positions into late buying enthusiasm.
Bottom Line
$2.50 is the line in the sand. Above = greenlight for momentum. Rejection = possible air pocket lower.
OPEN Risky AF!Sharing my crazy Thoughts ._.
the blue Lines Aka Red Zones consider As Strong Major Resistances and price will respect it !
Either by price Re-test or Reject.
Pink Line Consider As Strong Support level.
MY scenario of upcoming Days.
Stock Reject by Blue Line. and Re-test Pink Line as the support level.
Although anything in between happens i update.
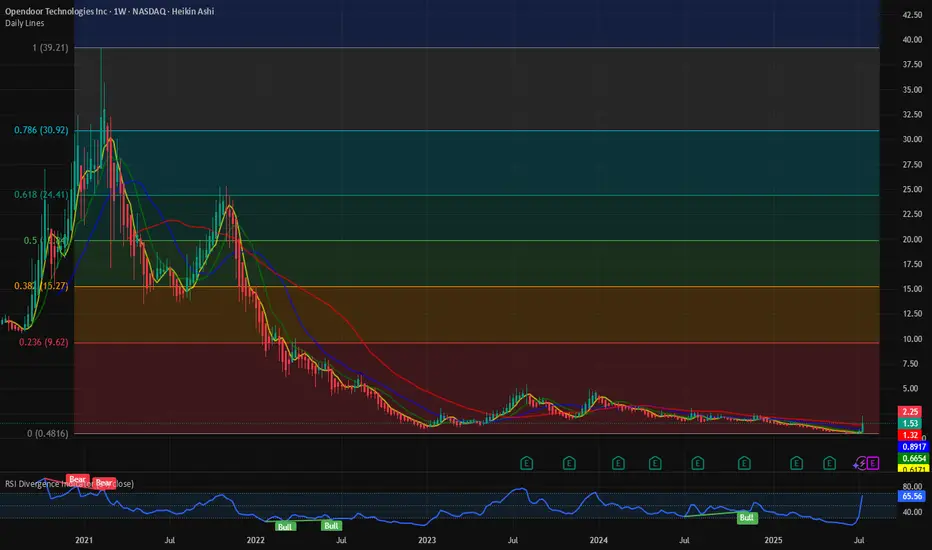
$OPEN: Ongoing short squeeze. What are the Fib levels telling? Are these the sign of a mature bull market? Drone cos, Space cos, SPACs, Biotech and Penny stocks are rallying. NASDAQ:OPEN is one such stock which hit the lowest of 0.5 $ last week before rallying more than 200% until July 18, 2025. NASDAQ:OPEN has a high short interest of almost 20% and short interest ratio is only 1.8 days to cover. Which means with 20% of the float short and the shorts needing 1.8 days to cover it might be ripe for a short squeeze if there is coordinated action by the bulls and a lot of call buying.
This might be a repeat of the meme stock rally scenario which we saw in 2021. But irrespective of the short situation from a technical standpoint what are the charts telling us. We go back to the tried and tested Fib Retracement levels to check the next price levels to watch for.
In my opinion the next price level to watch will be 9$ which might be a psychological level too. Many fund managers can only buy stocks if they are only above 10$. So, at that price we might see sellers offloading their gains. With next earnings call on Aug 5th and the Wallstreet bet crowd having a firm hold on the stock, we might see some explosive price action in the days and weeks to come before this settles The RSI is @ 60 which is not overbought, we can easily see 9 $ by end of summer if the social buzz continues.
Verdict: Buy NASDAQ:OPEN or Hold on to it if you have it. Offload some @ 9$.
OPEN (Opendoor Technologies)Opendoor (OPEN) is emerging from a brutal real estate cycle with a leaner, smarter operation and a business model that could thrive as the housing market finds footing. While the company is still working toward consistent profitability, the current setup offers asymmetric upside due to improving fundamentals and a high short interest that could fuel a sustained rally.
1. Positioned to Ride the Next Real Estate Cycle
OPEN's iBuyer model was stress-tested through the worst of 2022–2023’s housing headwinds: rising rates, low volume, and margin compression. But now, with mortgage rates potentially peaking and homebuyer demand gradually returning, OPEN is well-positioned to scale again. Inventory controls, smarter pricing algorithms, and a lower cost basis mean they’re entering this phase with greater discipline than during the 2021 boom.
2. Short Interest is a Powder Keg
With short interest hovering above 25–30% of float, OPEN has the structural setup for a squeeze. Any catalyst — like a Fed pivot, surprising earnings beat, Zillow partnership expansion, or a positive housing data print — could trigger aggressive short covering. The stock has already shown it can move 10–20% intraday on relatively modest news. If bulls start leaning in, the technical chase higher could be violent.
3. Cost-Cutting + Tech Moat = Path to Profitability
Management has aggressively cut costs and moved toward a "marketplace" model, including its Opendoor Exclusives platform, which reduces inventory risk. While still early, the company's tech-driven pricing and transaction platform remains years ahead of traditional agents. In a sector that still relies on phone calls and paperwork, Opendoor has a chance to be the Amazon of home transactions.

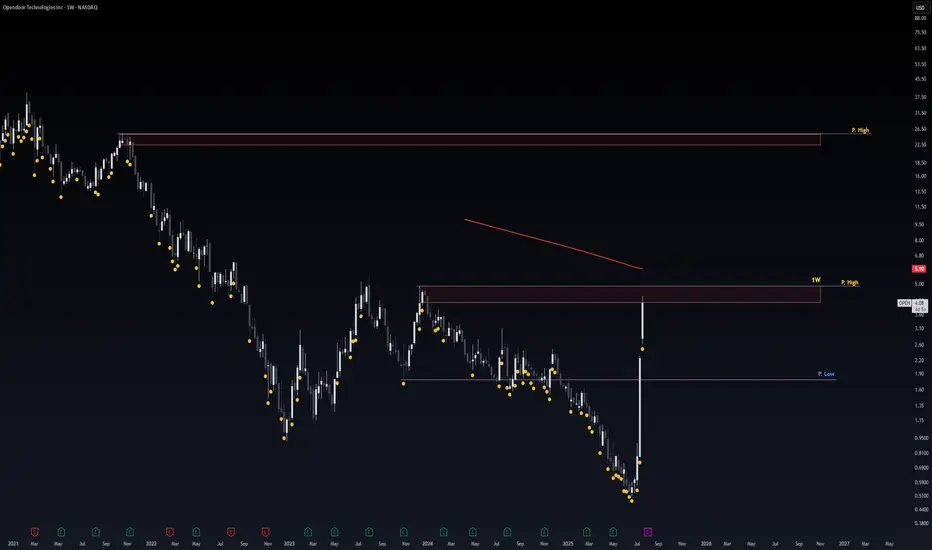
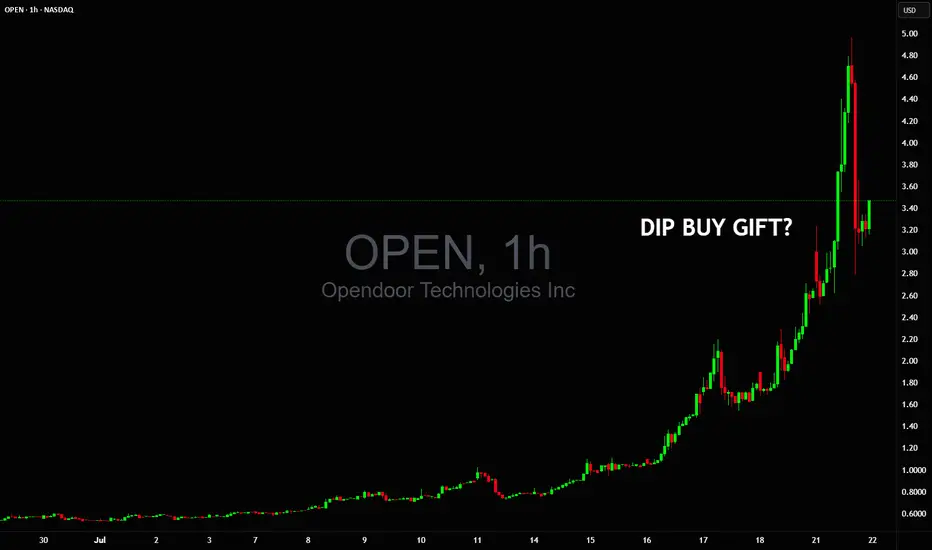
Could this dip $5 to $3 be a buy gift before double digits?Could this dip $5🔻$3 be a buy gift before NASDAQ:OPEN goes into double digits on NYSE:GME style vertical squeeze? 🤔
We haven't seen such 1 day volume in years so nobody really knows what's next 👀
$OPEN Approaching Significant Resistance Range TestI believe the $2.5-$3 area may show resistance, as shown by the highlighted box covering the 2 large weekly resistance wicks in Jan 23 and Jul 24. We are moving swiftly and easily toward that range but that area may be significant and present the first real test. Past that range should be smoother sailing to $5.
I am not a financial advisor and this is not financial advice. I have been wrong before and will be wrong again; I trade within this reality and control my risk. I have a position in this stock and like it.

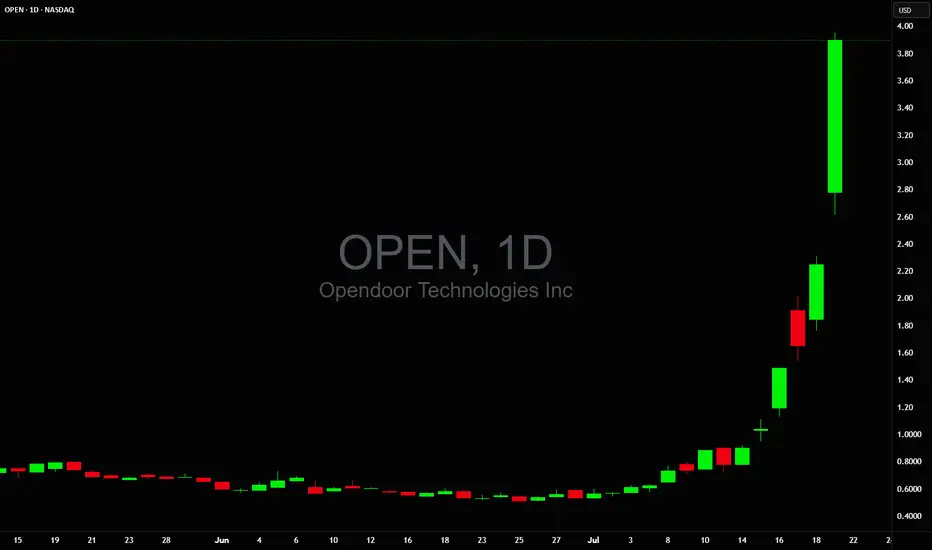
$0.50 to $4.00 up nearly 1,000% in the past trading days😲 $0.50 to $4.00 up nearly 1,000% in the past trading days 💥 600 Million shares traded today so far
People must be thinking NASDAQ:OPEN means stock of OpenAI, hey everyone this is not ChatGPT stock
Short Squeeze Data For OPEN| Metric Value
Short Interest : \~135.8 M shares (\~19–21% of float) |
Days to Cover: | \~1.5–1.8 days
Avg Volume: | \~56 M shares/day
Today’s Volume: | \~426 M shares (7.5× average)
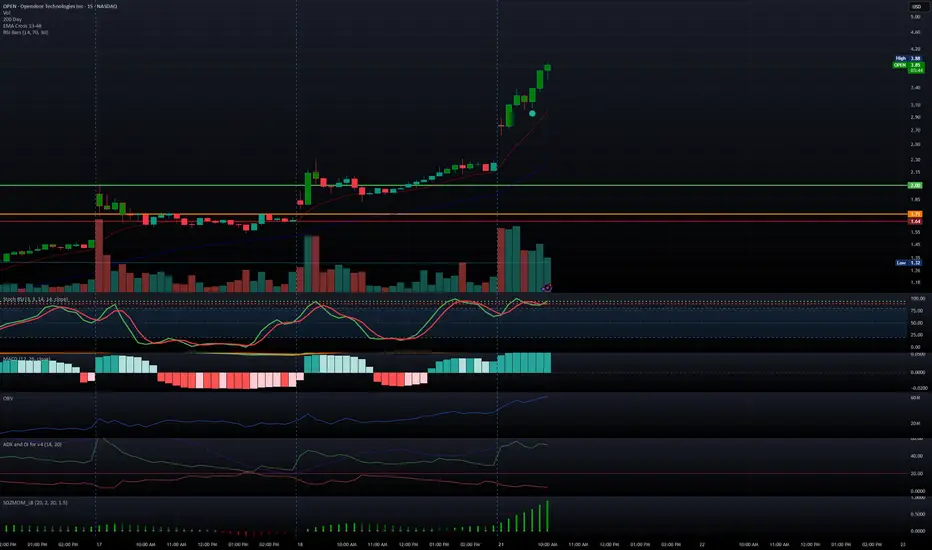
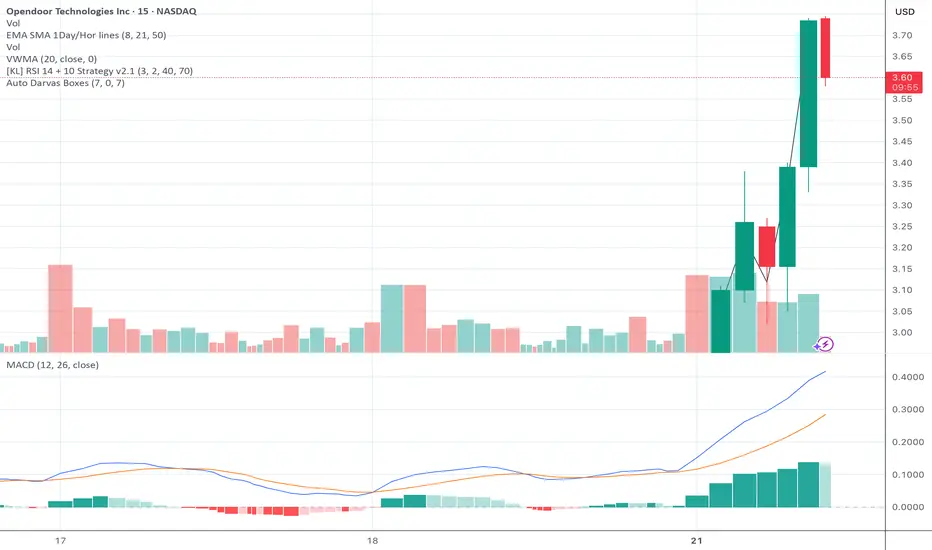
OPEN: textbook breakout from consolidationSpotted this on the scanner today. After ranging between 3.20 and 3.35, NASDAQ:OPEN broke out with solid volume and momentum, pushing up to a high of 3.70 for a clean intraday move of about 12 percent.
The setup included a clear Darvas box formation, a MACD crossover confirming momentum shift, and price action pushing above VWMA and key EMAs. Volume increased right as the breakout occurred, confirming buyer interest.
Support now sits around 3.47 at VWMA, and 3.35 as the top of the previous range. If price holds above 3.60, continuation into the 3.80 to 3.90 zone is on watch.
Strong breakout structure with clean technicals and follow-through. Worth keeping on the radar.
$OPEN WEEKLY TRADE IDEA – JULY 21, 2025
🚨 NASDAQ:OPEN WEEKLY TRADE IDEA – JULY 21, 2025 🚨
🔥 Massive Bullish Flow + RSI Explosion = Momentum Play of the Week!
⸻
📊 Trade Details
🔹 Type: Long Call Option
🎯 Strike: $3.50
📆 Expiry: July 25, 2025 (4DTE)
💰 Entry: $0.81
🎯 Profit Target: $1.62 (💯%)
🛑 Stop: $0.49 (🚨40% risk cap)
⚖️ Confidence: 80%
📈 Size: 1 Contract (2–3% account allocation)
🕰️ Timing: Enter Monday Open
⸻
📈 Why This Trade?
✅ Call/Put Ratio = 2.26 (🚀 Bullish bias)
✅ RSI (Daily: 93.6 / Weekly: 81.4) = 💥
📊 Weekly Volume = 2.8x average (🔥 Institutional interest confirmed)
🧨 Call Flow Dominance: $3.50 strike leading in premium activity
⚠️ Gamma Risk: Moderate – Expect possible spike
⏳ Theta Decay: Manage exposure! Only 4 DTE.
⸻
🧠 Model Consensus:
🟢 STRONG BULLISH SIGNAL
⚠️ RSI EXTREME – quick profit taking or tightening stops may be necessary
📌 Most models = 85–90% confidence, a few warn of overbought signals
⸻
💡 Strategy Tips
🔸 Use tight trailing stop if spike occurs early
🔸 Lock profits >30–50% if reversal candles print
🔸 Avoid spreads – naked calls favored for gamma exposure
⸻
🏁 Verdict:
This is a momentum-fueled gamma squeeze setup.
NASDAQ:OPEN 3.5C – Risk $0.49 to make $0.81+
Fast move expected. Don’t blink ⚡
⸻
#OPEN #OptionsTrading #CallOption #WeeklyPlay #TradingSetup #GammaSqueeze #FlowBasedTrade #UnusualOptionsActivity #modntumstocks

Opendoor Technologies | OPEN | Long at $0.60Opendoor Technologies $NASDAQ:OPEN. This is purely a swing trade for a company that has been posting declining earnings and revenue since 2022 and does not anticipate becoming profitable in the next 3 years. Since the stock is now under $1, it's at-risk of being delisted from the Nasdaq. I am entering this play because there is a chance the recent price hit near $0.50 may be a temporary bottom and there is enough short interest (near 18%) for a spike near its book value of $1.00. Quick ratio is 0.75 (i.e. company may have difficulty meeting its short-term obligations without selling inventory or acquiring additional financing). While the company may be forced to do a split (a major risk for this purchase), I can see other eyes viewing this as a potential "quick play" for a reversal near its book value.
At $0.60, NASDAQ:OPEN is in a personal buy zone for a swing trade.
Targets:
$0.87 (+45%)
$1.00 (+66.7%)

OPEN BUYBUY OPEN at .45 to .40, riding it back up to 2.45 to 5.40 as Profit Targets, Stop Loss is at .20!
If anyone likes mumbo jumbo long useless analysis, than this is NOT for you.
Also, if you are afraid of risk, failure, and want only a 100% sure thing, than
run as fast as you can from here and from the markets,
because it is definitely NOT for you.
WARNING: This is just my opinion of the market and its only for journaling purpose. This information and any publication here are NOT meant to be, and do NOT constitute, financial, investment, trading, or other types of advice or recommendations. Trading any market instrument is a risky business, so do your own due diligence, and trade at your own risk. You can loose all of your money and much more.

$OPEN ready to go bananasNASDAQ:OPEN
Looks killer across time frames. Bottomed out and sitting in the weekly buy zone w/ the 10/20 hma curling. Daily 10/20 a nubbin' away from flipping. TSI positive as well. Bullish daily divergence on 1/28. Algo can't stop spitting purple buy diamonds.
Macro: Worst housing market since the 90s. Trump has aways been a real estate guy, there's no way he won't pump the housing market at some point. He'll be relentless in pushing the Fed to lower rates. All wins for OPEN.
www.tradingview.com

Open Door Potential POPOpendoor is publicly traded on the NASDAQ under the symbol OPEN. Its stock performance often reflects factors such as housing market trends, interest rates, and competition within the proptech and real estate industries.
The company has experienced volatility, particularly due to the cyclical nature of the real estate market and external economic factors like inflation and mortgage rate changes. Investors view Opendoor as a disruptive player in the real estate space with significant growth potential, albeit with risks tied to market conditions.
Currently, price has broken out of a year long consolidation falling wedge pattern, which can signal a bullish breakout if we manage to hold price above $2.
Additionally, Open Door could potentially rally in the near future due to several factors, including:
1. Recovery in the Housing Market
If the real estate market stabilizes or improves, Opendoor could benefit from increased transaction volumes and home price appreciation. Lower mortgage rates or government policies that boost housing demand might also drive a rebound.
Here are additional reasons why Opendoor (OPEN) stock could potentially rally:
2. Improved Financial Performance
If Opendoor demonstrates better-than-expected earnings, reduced losses, or achieves profitability sooner than anticipated, investor confidence could drive the stock higher. Cost-cutting measures or increased operational efficiency may also contribute.
3. Expansion of Market Share
Opendoor's ability to capture a larger share of the real estate market by expanding into new cities or increasing its customer base can be a catalyst for growth. Enhanced marketing or improved user experience might help attract more buyers and sellers.
4. Partnerships and Innovation
Strategic partnerships, such as integrations with other proptech companies, lenders, or real estate agencies, could bolster its platform's value. Innovations in its technology or services, such as enhanced AI for pricing accuracy, may also attract more users.
5. Positive Economic Data
Macroeconomic factors like declining interest rates, increased consumer confidence, or higher housing demand could positively impact Opendoor’s business and outlook.
6. Regulatory Changes Favoring Proptech
If regulatory changes make real estate transactions easier or more digital-friendly, Opendoor could benefit from accelerated adoption of its platform.
7. Short Squeeze Potential
Opendoor has occasionally been a target of high short interest. A strong earnings report or other positive news could trigger a short squeeze, pushing the stock price up sharply.
8. Acquisition Speculation
The company’s unique position in the iBuyer space could make it an attractive acquisition target for larger tech companies or real estate players looking to expand their digital footprint.
9. Investor Sentiment and Momentum
Positive analyst upgrades, increased institutional buying, or heightened retail investor interest (e.g., via social media platforms) could contribute to a rally.
I will be taking a long trade entry here on this stock with a stop below the gap zone under $2.
Only time will tell how this one trends.

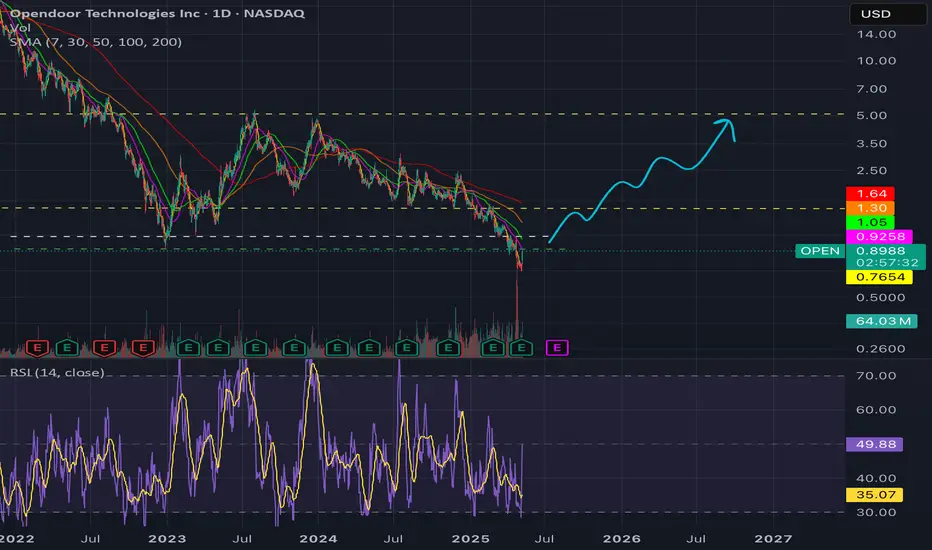
OPEN - Possible Cup & Handle Pattern Forming?OPEN ( NASDAQ:OPEN Opendoor) Looks to Print a Possible Cup & Handle Pattern which is Bullish.
Should this pattern execute, I have plotted the potential Price Value Area Targets and shown the Upside.
Remains a Risky Trade or Investment, however the Macro Factors of a Lower Prime Rate % should support this Strategy.
As always, please get a few outside Expert's Advice before taking Trade or Investment Decisions.
Should you appreciate my Chart Studies, Smash That Rocket Boost Button. It's Just a Click away.
Regards Graham.

OPEN - Falling Wedge on the Daily ChartThe price has been fluctuating within a broad range but shows a general downward trajectory as indicated by FALLING WEDGE. There's a noticeable struggle to break above the supply zone, suggesting that any rally towards this zone might be met with selling pressure.

Bearish pennant ~> $1 targetBearish pennant: flagpole = target.
Fibonacci -0.61 = target.
Both of these technicals show us we are going to the $0.98 area shortly :) daily chart 50ema/200ema show we are also in downward momentum. Enjoy!
