PAM Took LossHi everyone, just a quick update on PAM — today the price hit my stop-loss, so the trade has been closed.
Sometimes the market just doesn’t go our way, and that’s okay. Losses are part of the process. The most important thing is sticking to your strategy and letting the market play out.
This one didn’t work out, but we move forward. Stay consistent, stay disciplined — in the long run, that’s what brings results!
PAMP/N trade ideas
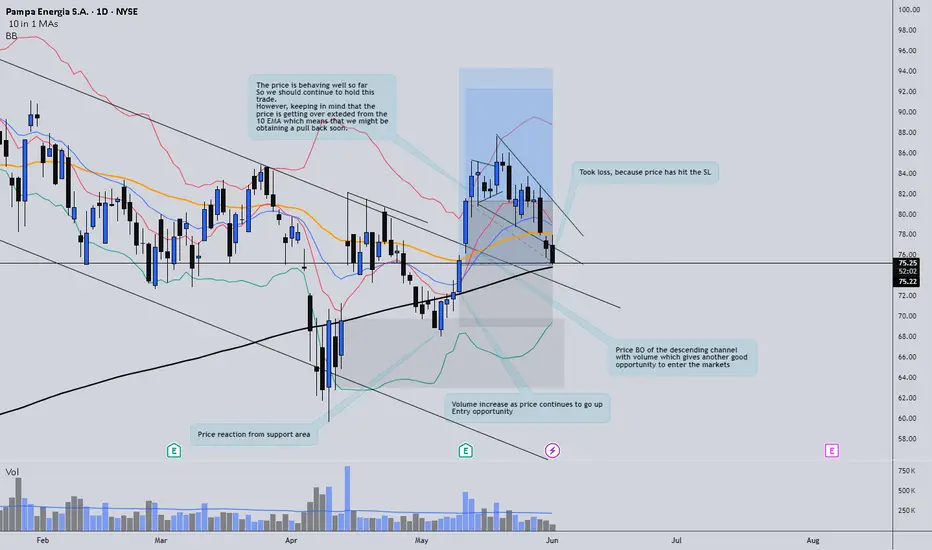
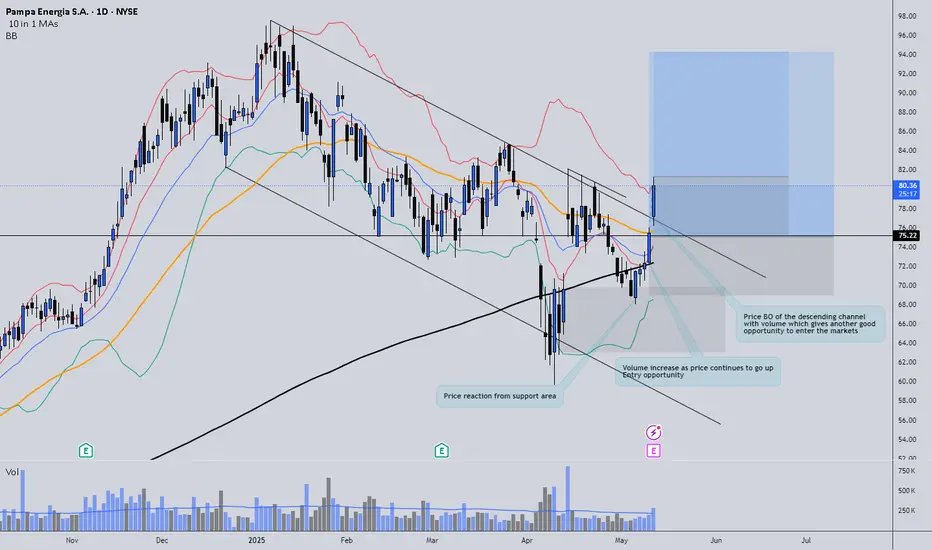
PAM bullish entry, however, earnings day beware.Pampa Energy (PAM) is showing a strong investment opportunity.
The price recently reacted off a newly formed support area and has now broken out of a higher time frame descending channel—giving us the chance to enter at a favorable level. This breakout, combined with increasing volume, signals strong bullish interest.
However, it’s important to stay cautious: today is earnings day. Despite the bullish momentum, earnings can shift market direction quickly. A positive report could propel the price higher, but a negative surprise could trigger a sharp reversal.
I entered the trade yesterday and added to my position today. To manage risk, I’ve moved my stop-loss to just below today’s entry candle. Now, it's a matter of patience and discipline—letting the market reveal its next move.
Pampa Energia S.A. - [PAM]Price Action & Trend
Price Trend: The chart shows that the stock is in an overall uptrend, especially visible since mid-July. This is indicated by the consistent higher highs and higher lows.
Recent Movement: The price recently experienced a significant upward movement, pushing above the $50 level and closing near $53. This bullish move suggests a strong buying interest.
Bollinger Bands
Bollinger Bands (Red and Green Lines): The price is currently near the upper Bollinger Band, which often suggests that the asset is overbought in the short term. However, a breakout above the upper band can indicate a continuation of the uptrend, especially in strong bullish markets.
Volume
Volume Analysis: The volume has been increasing along with the price, especially during the recent upward surge. This confirms the strength behind the move, as higher volume often accompanies strong price movements.
Key Levels
Support Levels: The key support level is around $50, which was a recent resistance level and might now act as support.
Resistance Levels: The immediate resistance level is near $54.17, the high of the most recent trading session. If this level is broken, the next significant resistance could be around $58, near the upper band of historical prices.
Candlestick Patterns
Bullish Candles: The recent candlestick is bullish, with a strong close near the high of the day. This indicates strong buying pressure.
Potential Reversal Signal: Watch for any bearish reversal patterns near the $54-$55 area, as this could indicate a short-term pullback.
Conclusion
Bullish Bias: The overall technical indicators point to a continuation of the uptrend, with strong support around $50 and potential for further gains if the price can break above the $54-$55 resistance area.
Caution: Given the proximity to the upper Bollinger Band, there might be a short-term pullback or consolidation before any further upward movement.

PAM starting to breakoutPAM was recently taken lower with concerns over demand for oil. However, profits have increased from 2020 to 2021. Add to this the elevated price of oil along with Exxon and Chevron reporting record profits and the outlook for PAM is solid as it operates through: Electricity Generation, Distribution of Energy, Oil and Gas/Petrochemicals. Debt to assets trending down from 2020 to 2021 and PE < 4 with consistent cash flows.
Daily and weekly volume have started to trend up along with the price on target to hit the ~25 range soon which would be the 3rd time since April this year. Weekly energy is in the 60s and RSI hook showing positive upward slope. Daily the downward trendline has been broken to the upside and closed above that level.

PAMPAInteresting Utilities stock that is consolidating, if you plot a weekly chart, you would probably note the spike on volume over this area.

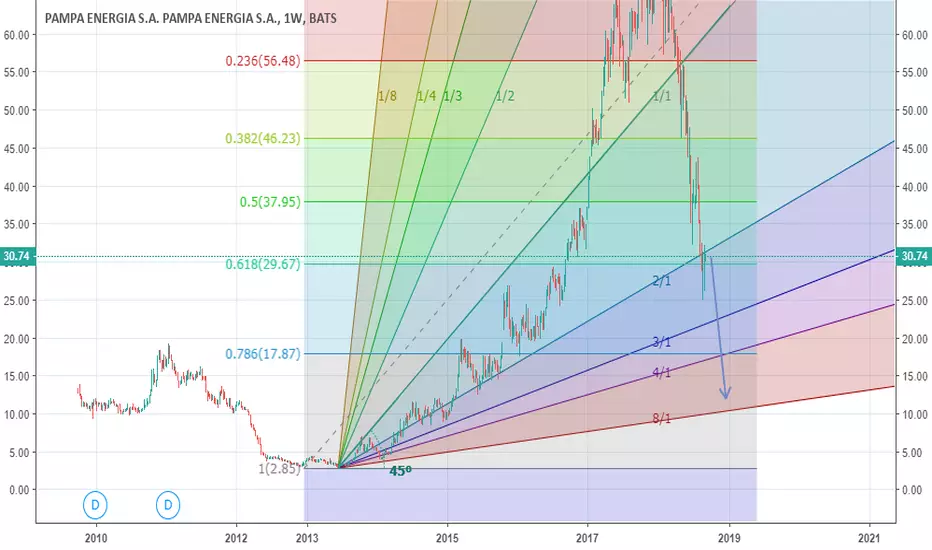
Pampa Energia is building nice momentum we need to rideIt is setting up for long rally we would like to ride using fibonachi.

Buy $PAM - NRPicks 14 MarPampa Energía S.A., an integrated electricity company, is engaged in the generation, transmission and distribution of electricity in Argentina. It operates through the electricity generation, electricity distribution, oil and gas, petrochemicals, and holding and other businesses segments.
For context, the unemployment rate in Argentina decreased to 11.7% in the third quarter of 2020 from 13.1% in the prior period, decreasing from the highest unemployment rate since the third quarter of 2004. The monthly inflation rate in Argentina fell to 3.6% in February 2021 from 4.0% in January and in line with market expectations and is close to present its GDP growth (Y / Y).
- Income in 2020 $ 1.07B
- ADJ EBITDA $ 750M
- P / S 0.82
- P / B 0.57
- P / E 10.01
- Sales past 5Y 100.60%
Technical:
Support at $ 12.70
MACD Level (12, 26) 0.05
Average RSI levels

Options Idea: Sell The PAM Sep. 18, 2020 10.0 Put @ $0.40Pampa Energia (PAM) is reversing a long-term downtrend, and beginning to trend upwards. After hitting a low of $8.72 in March, we’ve been seeing higher highs and lower lows for the last 4 months. This is an Argentine stock and it’ll probably see a bump higher after the government finishes its sovereign debt restructuring. Also, PAM has a share buy-back program in place and management has been very aggressive about buying back their ADRs when they get close to the $10 zone, which is the strike we've chosen for our naked put.
Warning : PAM options are not liquid. So if you decide to enter into this trade, you’ll probably have to take all the way to Sep 18. Since there isn’t much liquidity, so probably won't be for everyone, but we think the current set-up offers a good risk/reward ratio.
20-PAM-02
Opening Date: July 27, 2020
Expiration Date: September 18, 2020
DTE: 53
IV: 76.42%
IV Percentile: 42%
Odds of Winning: 77.87%%
Odds of Losing: 22.13%%
Win: > 9.60 @ Expiration
Loss: < 9.60 @ Expiration
Reg-T Margin: $290
Chart Legend
Green Area: 100% Win Zone. If we finish above or in the green area, we keep 100% of our initial credit. The size of the green area is the size of credit (our maximum win).
Yellow Area: Danger Zone: We still win, but we have to give back some of the initial credit taken in.
Red Area: If we finish in this area we have a loss. The size of the red area is the size of our maximum loss.
1 standard deviation, 2 standard deviation, 3 standard deviation projections from Opening Date to Expiration Date are included.

A largo desde zona de acumulaciónComprando poco a poco, armando posición esperando a que salga en largo un papel que está barato


PAM NYSEPampa Energia muy prolija en Fibonacci. Las baja actual fue de 882 dias, tipicamente la MISMA baja temporal que tuvo en la anterior. Ya reboto...

Pampa Energia $PAMThere is no any reversal signal yet, it is still bearish. $9.33 is strong support though.


PAMPAM otro papel que ya esta más abajo del mínimo post paso. Los 8.70usd fueron piso y de ahí hizo un Bull Trap, nos dio señal de compra y volvió a caerse. MACD por ahora sigue en venta y el RSI tiene divergencias alcistas. Manos grandes siguen llevando a estos precios. Si vuelve a los 8.70usd podría ser precios de entrada o si vuelve a cruzar la WMA21 a base cierre

PAMPAM vision 15', por ahora los 10.50usd fueron resistencia, si la pasa tiene otra cortita en los 11usd, de pasarla ahi si se pone linda !


Pampa Energia share buybacks ought to be good for the pricePampa Energia (an Argentinian electrical utility and petrochemical producer) is a tough company to gauge, because it's a foreign company and its earnings are unpredictable. It appears very inexpensive with a P/E under 1.5, but analysts expect losses for the next two quarters. Forward P/E is 4.5. The company has a merger in process with PEFM, to be completed in July. Unfortunately I can't find much analysis of the merger.
Oddly, this stock trades a little differently on Argentina's stock exchange than it does on the New York stock exchange. Here's the chart on the Argentinian exchange, BYMA:
It looks like American traders reacted much more to the merger between Pampa and Petrobras back in 2016. Excluding the anomalous period from 2016 to 2018, the two charts look more similar. However, Pampa is still down more since its last earnings on the US than on the Brazilian exchange.
Given the lack of good information available on this company in English, I won't be buying any. But just taking a crack at a prediction for curiosity's sake, I'd guess the stock will start to move higher. Here are some things that should help. First, oil prices are in an uptrend. Second, analyst ratings on the stock have been rising, and it's now got an 8.7/10 summary score from Thompson Reuters. Third, Pampa has been buying back shares at the current price. Yesterday it bought about a million dollars' worth. And fourth, Pampa has support around $15.
This is a longer term play; look for a test of the trend line sometime in the next eight months.


INDECISIÓN -> DOJIHEY MA PEOPLE!!! // QUE ONDA MI GENTE?!?!
El precio se mantiene en el canal alcista y le cuesta romper las resistencia dinámica (techo del canal alcista), y a su vez, también le está costando romper con la resistencia estática en $15.30.-
La vela de hoy es DOJI y expresa indecisión por los compradores y vendedores, o una batalla campal entre Osos y Toros. Los que tengan la cabeza más fría van a ganar esta guerra emocional.
Estamos esperando un regalo de navidad mejor y se que Papá Noel está leyendo esto.
-----------
The price is still in a ascending channel but we can clearly see that is not easy to break that dynamic resistance or even the static one that is $15.30.-
Today we've received a Doji Candle from the market and that's mean indecision. We are waiting for a better gift for Christmas and I know that Santa Claus is reading this.
SEE YOU SOON!

PAM: Risk reward is tremendous...One name I think has amazing potential is $PAM, among the oil stocks that I can see performing well in 2020. I'm publishing this one here, if it holds over the red dashed line on chart I would hold a long position in this stock. Risk is $2.07 per share, so size it according to your risk tolerance.
Cheers,
Ivan Labrie.

PAM PAMPA ENERGY SA NYSEPAMPA ENERGY NYSE STOCK
PROJECTION. 1X 2X 7X AT LEAST
UNDERVALUATED STOCK
FUNDAMENTAL ANALYSIS SOLIDS
PRICE 13-14 USD TO ENTER MIDDLE / LONG TERM.
AT LEAST 50% TO 100% WITH LOW RISK.
ACCION AFFECTS IN ITS PRICE FOR THE VALUE OF THE ARGENTINE CURRENCY.


short PAMI expect PAM to fall to 12 by early December taking into account Argentina macroeconomic as well as FX situation and volatility in EM.