PDD look good around 74-76PDD should take support between 74 and 76, which is a fantastic opportunity. The chart indicates the levels.
PDD/N trade ideas

PDD Holdings Upcoming EarningsAnticipating PDD Holdings Inc.'s imminent earnings report, I'm adopting a bullish stance, buoyed by the company's recent performance and heightened market enthusiasm. With PDD's robust marketing campaign for the Temu app in the US, I believe there's a potent catalyst for positive earnings results. My strategy is twofold, involving meticulous observation of the earnings report's impact on stock prices. Employing a dual trendline approach, I've tactically positioned a stop-loss level to shield against potential downturns. Conversely, I've pinpointed a take-profit threshold, harmonizing with historical price trends and pivotal resistance levels. An intriguing technical development further fortifies this position—the looming potential of a 50-day and 200-day Moving Average crossover. Should this transpire, it could validate the stock's upward trajectory. Admittedly, trading carries inherent risks, and this analysis hinges on upcoming earnings performance. My strategy remains dynamic, adapting to market nuances for optimal gains while prudently managing risk factors. Regardless, the price action will be worth observation and potential entry.

MBV-SP500-CLIMBER: PDDIntroduction:
This trading idea is based on a Long-Only strategy that utilizes the Dynamic Movement Index (DMI), supplemented by the Average Directional Index (ADX) and an Average True Range (ATR)-based Trailing Stop-Loss.
Strategy Overview:
Main Indicators: DMI, ADX, ATR
Time Frame : Variable, based on the DMI length (Default: 14 days)
Objective: To take long-term positions in bullish market phases
Optional Trading Hours and Seasonality:
Yellow Background (Trading Days) : Positions are only opened on trading days highlighted with a yellow background on the chart.
Blue Background (S&P 500 Seasonality) : Positions are only opened during periods highlighted with a blue background on the chart.
Strategy Details:
ADX and DMI : A Long signal is generated, taking into account the optional trading hours and seasonality, when the ADX exceeds a defined threshold and the positive DMI is greater than the negative DMI. This indicates a strong upward movement.
ATR-based Trailing Stop-Loss : The Stop-Loss is dynamically set with a multiplier of the ATR value below the current price and updated to secure profits.
The strategy script is available for free on TradingView.
You can find it under the name: "MBV-SP500-CLIMBER"
Please share your optimizations with the TradingView community by leaving comments under the script.
Please provide feedback on the strategy, especially on the trading signals, in the comments.
---
Einleitung:
In dieser Handelsidee beruht auf einer Long-Only-Strategie, die auf dem Dynamic Movement Index (DMI) basiert, ergänzt durch den Average Directional Index (ADX) und einen Average True Range (ATR)-basierten Trailing Stop-Loss.
Strategie-Überblick:
Hauptindikatoren : DMI, ADX, ATR
Zeitfenster : Variable, basierend auf der DMI-Länge (Standard: 14 Tage)
Ziel : Langfristige Positionen in bullishen Marktphasen
Optionale Handelszeiten und Saisonalität:
Gelber Hintergrund (Handelstage): Positionen werden nur an den im Chart mit einem gelben Hintergrund hervorgehobenen Handelstagen eröffnet.
Blauer Hintergrund (S&P 500-Saisonalität): Positionen werden nur während der im Chart mit einem blauen Hintergrund hervorgehobenen Zeiträume eröffnet.
Strategie-Details:
ADX und DMI : Ein Long-Signal wird unter Berücksichtigung der optionalen Handelszeiten und Saisonalität generiert, wenn der ADX einen definierten Schwellenwert überschreitet und der positive DMI größer ist als der negative DMI. Dies signalisiert eine starke Aufwärtsbewegung.
ATR-basierter Trailing Stop-Loss : Der Stop-Loss wird dynamisch mit einem Multiplikator des ATR-Wertes unter dem aktuellen Preis gesetzt und aktualisiert, um Gewinne zu sichern.
Das Strategie-Skript ist auf TradingView kostenlos verfügbar .
Sie finden Sie unter dem Namen: "MBV-SP500-CLIMBER"
Bitte teilen Sie Ihre Optimierungen mit der TradingView-Community, indem Sie Kommentare unter dem Skript hinterlassen.
Bitte geben Sie Feedback zur Strategie, insbesondere zu den Handelssignalen, in den Kommentaren.


$PDD: Strong earnings and strong chartNASDAQ:PDD has had a great quarterly report despite the slowdown in China as of late, chart wise the setup points to a weekly advance but possibly also a quarterly timeframe trend.
You can see the levels where you can bid on retrace next week, if tested, but I would consider entering long positions right away as well, there's various ways of engaging after a trend signal triggers. Ultimately, the odds of continued upside justify entering sooner rather than later, given the reward to risk and probability being on your side.
The bonus here is that after this weekly advance pans out you could be in for the ride in a longer term trend, offering the setup some 'call option' upside long term. I would suggest trimming exposure after 8 weeks or after all targets are hit, as long as the idea isn't stopped, to then ride a low risk but smaller long term position.
Best of luck!
Cheers,
Ivan Labrie.


PDD likely pull back to reality on the short term. NASDAQ:PDD is showing bearish divergence in the RSI after a consistent upward movement in a considerably bullish trend. The RSI is weakening showing less momentum. Additionally the oscillators such as stochastic and MACD are flashing sell signals.
I suspect NASDAQ:PDD will have a slight correction down over the coming weeks to fill the gap on the Nov 27th, and touch the 50MA. I would be looking to buy as the price nears $125.
In the future I would be careful trading this stock around the earnings date March 13th and also when the IPO lockup period ends in May.


Pullback scenarios for longI see two scenario playing out for a long term bullish trade.
Bias: Bullish
Why: Neckline breakout of inverted head & shoulders with a positive earning gap.
Scenario A: Price action is currently showing a bullish flag after the huge earnings gap up. We can see price retrace to test the end of the gap. With a high possibility of bouncing and breaking the bull flag structure to a new high.
Note: 12/8 ended with a green volume day above average breaking the latest downtrend volume structure.
RSI is still show PDD in an overbought scenario, most severe since Aug/Sep 2019'.
MACD is turning to a SELL signal at the top of the indicator.
Given the indication for a dire pull back...
Scenario B: Price action retraces to fill gap, bouncing to retrace back to the I-H&S neckline or 200 EMA before a rocket launch to $170 price target.
Thoughts?
Pure speculation. Trade responsibly.


If History RepeatsIf history repeats itself, this chart is doing what it did in 2020.
I see NASDAQ:PDD is increasing in the EPS 4.8% in 2022 and the forecast is an 18.52% EPS growth in the next 5 years. This company is earning $4.47 per share at the moment.
The market cap is at193B and the enterprise value is at159B which shows me they have more cash than debt. Going into a recession of any type, this is a plus.
I do hate to see that insider management nor directors do not own this company.
What do they do? PDD Holdings Inc., a multinational commerce group, owns and operates a portfolio of businesses.
It operates Pinduoduo, an e-commerce platform that offers products in various categories, including agricultural produce, apparel, shoes, bags, mother and childcare products, food and beverage, electronic appliances, furniture and household goods, cosmetics and other personal care, sports and fitness items and auto accessories; and Temu, an online marketplace.
It focuses on bringing businesses and people into the digital economy. The company was formerly known as Pinduoduo Inc. and changed its name to PDD Holdings Inc. in February 2023.
PDD Holdings Inc. was incorporated in 2015 and is based in Dublin, Ireland.
They are currently increasing their employment yearly with 2022 at a 33% growth of employment rate.
This is one that could retrace the same path of support and resistance that are marked in the yellow lines.

5 Investors Betting Big on Pinduoduo (PDD) StockNASDAQ:PDD is soaring higher after a blowout third-quarter earnings report.
Let’s take a look at Pinduoduo’s largest shareholders:
1. Sequoia Capital: 48.23 million shares. Sequoia acquired 45.04 million shares during Q3.
2. Baillie Gifford: 35.66 million shares. Baillie acquired 4.5 million shares during Q3.
3. BlackRock: 27.87 million shares. BlackRock acquired 3.73 million shares during Q3.
4. Vanguard: 24.10 million shares. Vanguard acquired 6.63 million shares during Q3.
5. FMR: 17.63 million shares. FMR acquired 4.33 million shares during Q3.

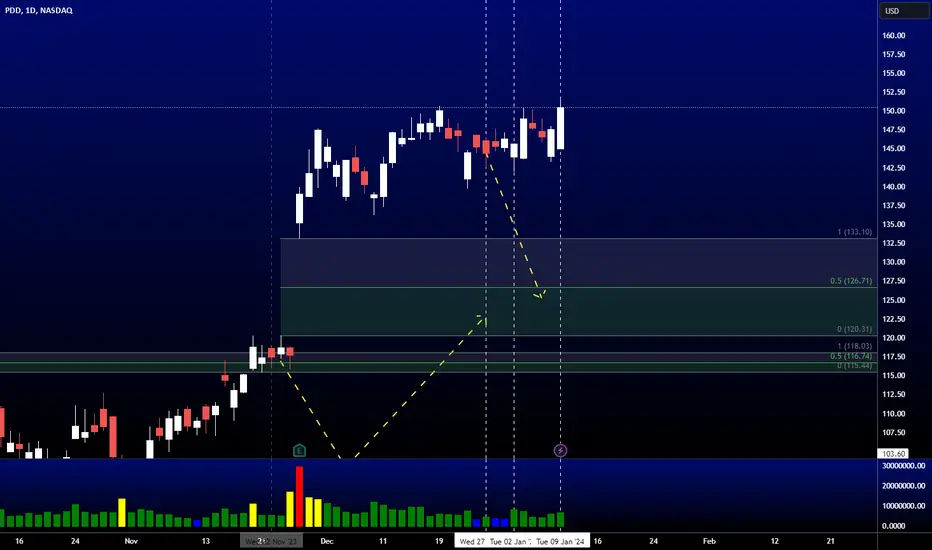
PDD AnalysisPrice played out nicely as my last analysis, giving us a +20.66% move to the upside. Price is currently on the premium range and has filled the FVG made in July 2021. I'm expecting a bearish retracement from here into the bullish OB at 103.6 since price is on the premium level, and target has been met.

💵 E a r n i n g s J o u r n a l📶 S T A T I S T I C A L A N A L Y S I S
Current 50-Day Market Trend: long/buyers/positive.
Next Swing: negative swing to support.
Next Wave: buy wave to the range.
Next 50-Day Market Trend: long/buyers/positive.
Trade Type: Touch & Go don't wait for a close.
💵 E A R N I N G S A T A G L A N C E
Market Capitalization: 152.987B
Release Date: 11/23 BMO
Quarter: FQ3'23
_______________________________________________
Revenue Anticipations: positive surprise of Revenues.
Revenue Surprise-Confidence: on a scale of 0-9, #7
Revenue 2-Year Trend: the company trend in Revenues is positive.
_______________________________________________
EPS Anticipations: positive surprise of EPS.
EPS Surprise-Confidence: on a scale of 0-9, #7
EPS 2-Year Trend: the company trend in EPS is positive.
_______________________________________________
📝 S Y N O P S I S
🟢 Buy ~ If the earnings report is above the Wall Street consensus, I expect the market will buy the +surprise.
⚪ Neutral ~ If the earnings report is released with complicating press, I expect the market will avoid the surprise and invest in alternative securities.
🔴 Sell ~ If the earnings report is below the Wall Street consensus, I expect the market will sell the -surprise.
🔎 R E S E A R C H D E P T H
Technical Analysis: daily chart.
Fundamental Analysis: EPS & Revenue data.
Press/News: none.
Social Media: none.
☝️ P R O V I S I O N
The analysis presented is incomplete work thereby can't safely trade in the Market by itself.


PDD - Tight Coil🔍 Tight Bull Flag : The price action on PDD's chart has shaped up into a tight bull flag, characterized by a consolidation phase (the flag) following a strong upward move (the pole). This pattern typically suggests that bulls are gathering strength for another rally.
📊 Robust Volume : What's even more promising is the substantial increase in trading volume. This suggests that market participants are actively accumulating PDD shares, further fueling the bullish case.
First target is at $112.


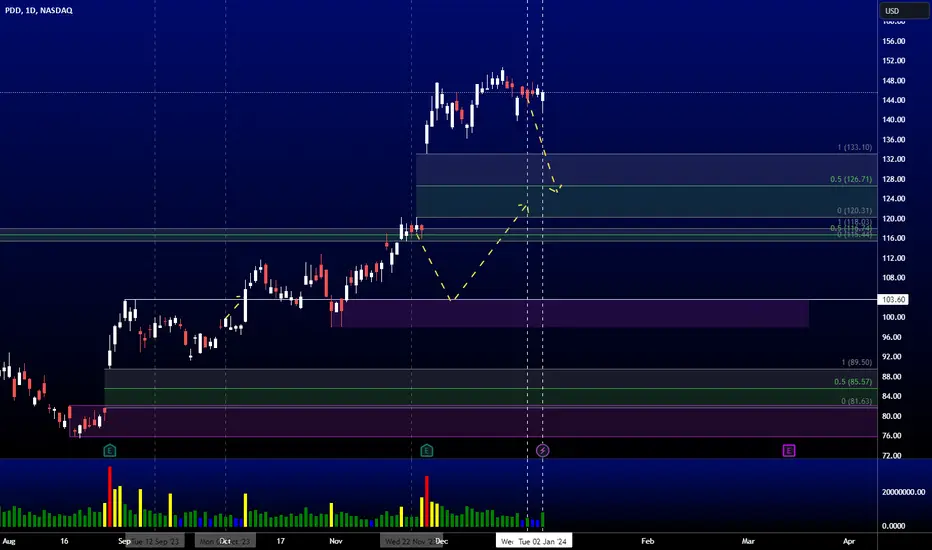
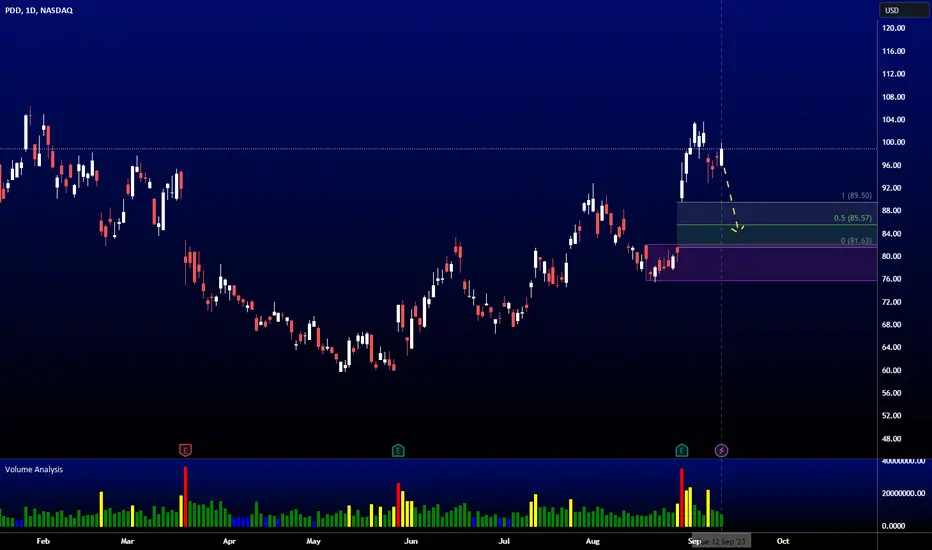
PDD AnalysisPrice is on a nice uptrend with decent pullbacks. There is a fair value gap at 85.57 waiting to be filled. I'm expecting price to make a nice bearish retracement to fill the fair value gap before continuing the uptrend. Alternatively, price could continue lower into the bullish POI at 82.19 before going higher.
$PDD - Rising Trend Channel [MID-TERM]🔹Moving average indicator has provided a POSITIVE signal, indicating a continued upward trend.
🔹Resistance at 104 could potentially trigger a NEGATIVE reaction, but an upward breakthrough of 104 indicates a POSITIVE signal.
🔹Once breakout resistance at 46 is considered a POSITIVE signal.
🔹Technically POSITIVE for the medium long term.
Chart Pattern:
◦ DT: Double Top | BEARISH | 🔴
◦ DB: Double Bottom | BULLISH | 🟢
◦ HNS: Head & Shoulder | BEARISH | 🔴
◦ REC: Rectangle | 🔵
◦ iHNS: inverse head & Shoulder | BULLISH | 🟢
Verify it first and believe later.
WavePoint ❤️
