M PatternEarnings 10-18 BMO.
Analysts appear positive on earnings. Analysts are known to be lagging indicators like moving averages.
Popped up today with a spinning top/a candle of indecision.
M pattern....this pattern started teetering at the .886 fib level but tails o candles did go below the .886, yet no candle bodies per say are below the .886.
The alternate bat hits the 1.113 which price has not hit the 1.113 as of yet.
Peak 2 is lower than peak 1 differentiating this from a shark pattern.
No recommendation
PG trade ideas

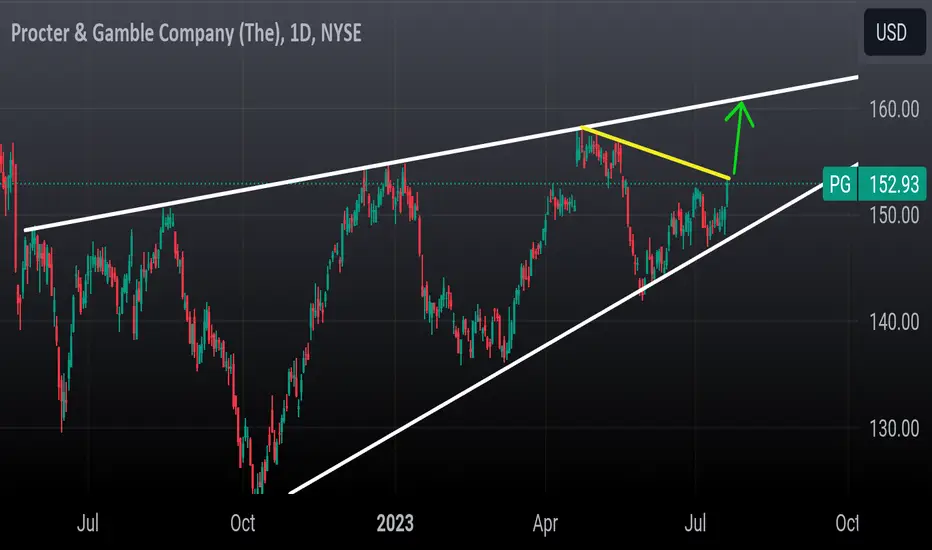
PROCTER & GAMBLE Great medium term investment.PG is having a strong red (1d) candle that crossed again under the 0.618 Fibonacci level.
In the last 10 months, the stock has been trading inside a Rectangle with the price being on the last step (0.786 Fibonacci) before the pattern's bottom.
The price is already a solid medium term buy but depending on the MACD, it may provide an even better opportunity.
Trading Plan:
1. Buy when the MACD (1d) makes a Buy Cross.
Targets:
1. 158.00 (top of the Rectangle).
Tips:
1. Last rebound was made on a single bottom candle (May 31st) without any retest. Today's pull back seems more like January with multiple tests, indicating that the probability of one last low is a little higher.
Please like, follow and comment!!

PROCTER & GAMBLE The 1D MACD gives the buy signal.Last time we looked into Procter & Gamble (PG) was December 2022 (see chart below) and called for a massive sell-off to $140:
As you can see that took place almost perfectly, with the price dropping even lower from $155 to $136. We hope you took advantage of this analysis and if you didn't short, at least got a comfortable buy entry as the price rebounded and reached $158.
The price is currently on a 2-month selling sequence after the August 10 rejection on Resistance 1 (158.45) and is approaching the bottom of the Channel Up. The horizontal Support (1) is at 142.00 and the 1W MA200 (red trend-line) marginally above 140.00 and rising. Technically Support 1 is the true Support level but under this pressure we can't rule out a 1W MA200 test to gather long-term buyers.
In any case, since almost 18 months, the buy signal with the lowest risk has been given when the 1D MACD forms a Bullish Cross. That is the buy entry confirmation for investors. Until then, the price can keep declining surrounded by negative fundamental market conditions. Take advantage of the MACD to get the most optimal position and target 158.45 (Resistance 1).
-------------------------------------------------------------------------------
** Please LIKE 👍, FOLLOW ✅, SHARE 🙌 and COMMENT ✍ if you enjoy this idea! Also share your ideas and charts in the comments section below! This is best way to keep it relevant, support us, keep the content here free and allow the idea to reach as many people as possible. **
-------------------------------------------------------------------------------
💸💸💸💸💸💸
👇 👇 👇 👇 👇 👇

Procter&Gamble to turnaround at previous swing low?Procter and Gamble Co - 30d expiry - We look to Buy at 142.52 (stop at 138.52)
The primary trend remains bullish.
Although we remain bullish overall, a correction is possible with plenty of room to move lower without impacting the trend higher.
The previous swing low is located at 141.90.
141.90 has been pivotal.
Preferred trade is to buy on dips.
This stock has seen good sales growth.
Our profit targets will be 152.52 and 154.52
Resistance: 146.50 / 148.00 / 150.00
Support: 143.90 / 141.90 / 140.00
Please be advised that the in formation presented on TradingView is provided to Vantage (‘Vantage Global Limited’, ‘we’) by a third-party provider (‘Everest Fortune Group’). Please be reminded that you are solely responsible for the trading decisions on your account. There is a very high degree of risk involved in trading. Any information and/or content is intended entirely for research, educational and informational purposes only and does not constitute investment or consultation advice or investment strategy. The information is not tailored to the investment needs of any specific person and therefore does not involve a consideration of any of the investment objectives, financial situation or needs of any viewer that may receive it. Kindly also note that past performance is not a reliable indicator of future results. Actual results may differ materially from those anticipated in forward-looking or past performance statements. We assume no liability as to the accuracy or completeness of any of the information and/or content provided herein and the Company cannot be held responsible for any omission, mistake nor for any loss or damage including without limitation to any loss of profit which may arise from reliance on any information supplied by Everest Fortune Group

A Short Bounce Before a Long DivePG formed a rising wedge. After a double top formation when also RSI divergence came in (yellow line on RSI chart), PG's downtrend began.
PG has broken out of lower trend line of the rising wedge, which will now act as resistance.
PG has gone down for six straight days. During downtrend, stocks usually fall for an average of five straight days. There is a region of consolidation around 145-46 region (green rectangle). PG may, therefore, bounce from this region. However, it will resistance at 151-152 from the lower trend line of the rising wedge and the resistance consolidation zone (red rectangle).
After hitting 151-152, PG should come down again.
PG has gone below 200 SMA.

PG longI am bullish on Procter and Gamble. it entered to strong bullish zone and can bounce up from here.

PG bearish divergences formingPG has been in an uptrend , but we can observe the bearish divergences developing.
If they play out, we will see a breakdown of the rising wedge.
Once it happens, the short position can be taken.
Enter short ONLY if the successful breakdown occurs.
If it doesn't happen , the uptrend will continue.
Approx. Target for shorts is shown on the chart , but keep in mind that everything depends on the breakdown point.
Do you agree?
Good luck

PG - POTENTIAL TREND REVERSALU.S. appeals court judges questioned a 2.5-year pause in a shareholder lawsuit against PG&E Corp officers and directors. The lawsuit concerns statements about the utility's wildfire prevention. A pension fund sued 44 corporate leaders in 2018. The case was paused until the end of PG&E's bankruptcy, but judges now question the need for this delay. Shareholders claim billions in damages, and insurance funds have decreased. PG&E's financials improved in Q2 2023, but the lawsuit's fate remains uncertain.
Looks like the best time for trend reversal.
Risk Disclosure: Trading Foreign Exchange (Forex) and Contracts of Difference (CFD's) carries a high level of risk. By registering and signing up, any client affirms their understanding of their own personal accountability for all transactions performed within their account and recognizes the risks associated with trading on such markets and on such sites. Furthermore, one understands that the company carries zero influence over transactions, markets, and trading signals, therefore, cannot be held liable nor guarantee any profits or losses.

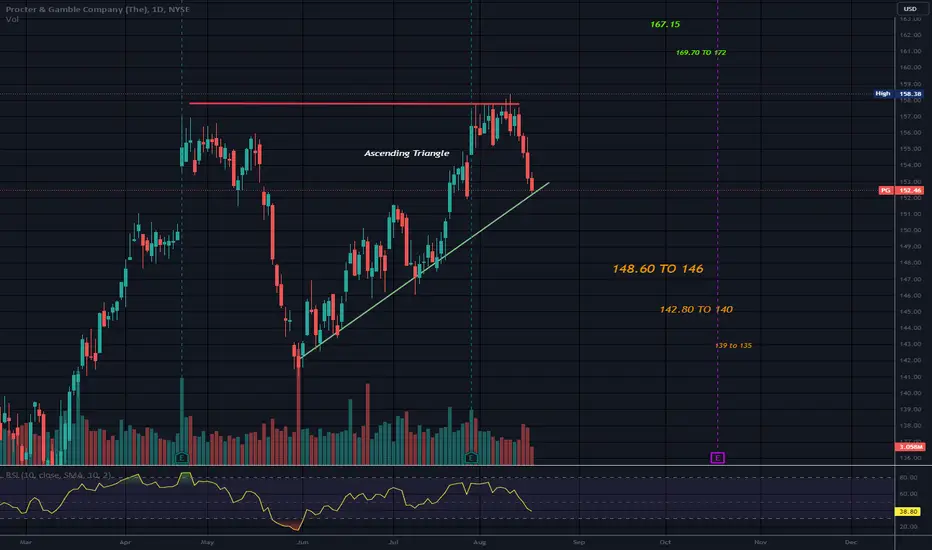
Potential double top in P&GConsumer staples are the second worst-performing major sector this year. (They lag only Utilities, according to TradeStation data.) Today we’re considering a potentially bearish pattern in one of the big names in the space: Procter & Gamble.
PG briefly traded above $158 in April without staying there. The same thing happened again last month. The result could be a double-top reversal pattern.
The stock next dove toward $152 and retraced half its drop toward $155. It then hit resistance at its low from August 4. That kind of price action may suggest sellers are taking charge.
Third, consider the series of higher lows since early June. PG is threatening to break that rising trendline and its 50-day simple moving average. Is that a sign of weakness over the intermediate term?
Finally, MACD has been falling since mid-August.
TradeStation has, for decades, advanced the trading industry, providing access to stocks, options, futures and cryptocurrencies. See our Overview for more.
Important Information
TradeStation Securities, Inc., TradeStation Crypto, Inc., and TradeStation Technologies, Inc. are each wholly owned subsidiaries of TradeStation Group, Inc., all operating, and providing products and services, under the TradeStation brand and trademark. TradeStation Crypto, Inc. offers to self-directed investors and traders cryptocurrency brokerage services. It is neither licensed with the SEC or the CFTC nor is it a Member of NFA. When applying for, or purchasing, accounts, subscriptions, products, and services, it is important that you know which company you will be dealing with. Please click here for further important information explaining what this means.
This content is for informational and educational purposes only. This is not a recommendation regarding any investment or investment strategy. Any opinions expressed herein are those of the author and do not represent the views or opinions of TradeStation or any of its affiliates.
Investing involves risks. Past performance, whether actual or indicated by historical tests of strategies, is no guarantee of future performance or success. There is a possibility that you may sustain a loss equal to or greater than your entire investment regardless of which asset class you trade (equities, options, futures, or digital assets); therefore, you should not invest or risk money that you cannot afford to lose. Before trading any asset class, first read the relevant risk disclosure statements on the Important Documents page, found here: www.tradestation.com .

P&GAMBLE, High Volatilty-Stock, Huge Triangle-Breakout Incoming!Hello, Traders Investors And Community, welcome to this analysis about the recent events, the current formation, and what we can expect in what the last weeks have shown us highly volatile stock PROCTER&G. As I mentioned already in past analysis about the stock-market we are progressing in historical levels within the whole market where we can observe big differences within the individual stocks and its price-levels, as some looking more bullish and have taken out all-time-highs already there are some stocks which show high downside potential. A big factor in these differences is the corona-crisis where we have gainers and losers either profiting out of the crisis or not because of the bad lineup in the real economy. Within P&G we have a stock which is consolidating in an increasing tightening range that will show a huge breakout the next times, although the bearish breakout is possible there are some stronger signs which making the bullish breakout more attainable.
When looking at my chart you can see that the stock is trading in this huge symmetrical triangle with the tightening pace and the current consolidation above the 100 and 30-EMA you can see marked in my chart with orange and light-green which is a decent bullish signal at the moment which can be the determining factor contributing to the upcoming bullish breakout. When looking at the past weeks and months we can examine that this is a highly volatile stock showing the big price swings in the past which can prove profit full for an intelligent trader with the right arrangement in the market. Compared to the leading index S&P 500 and other stocks we have a definite consolidation in this stock at the moment which can change as mentioned but compared to other stocks like BERKSHIRE or J&JOHNSON we have the confirmation of the underlying trend and tendency still awaiting within P&GAMBLE here. Counting all these factors together and in comparison with the other stocks, we can come to the conclusion that a breakout to the upside and visiting of all-time-high levels is more possible with this stock than the breakout to the upside.
COMPARISON STOCK: Stronger Than The Market: J&JOHNSON (4-Hour Timeframe):
COMPARISON STOCK: Weaker Than The Market: BERKSHIRE (4-Hour Timeframe):
After the stock has confirmed the breakout it can be traded with an entry immediately after the breakout or with a revisit of the higher boundary and a conservative entry, traders should decide according to individual risk-preferences. Remember that the breakout has to show with solid volatility to the upside a mere piercing and fall back into the triangle will indicate a fake breakout. When considering the corona-crisis factors the stock is a consumer durable which can show an anticlinal market-movement as consumer goods had a high demand in the lock-downs, this demand can increase again when there are coming new corona-restriction waves. We saw this demand also with the high bounces to the upside in this stock during the corona-breakdown period. So according to the current situation we have also a more bullish environment within the fundamental side of things, therefore, it will be interesting how this scenario plays out properly.
In this manner, thank you for watching, support for more market insight, good day and all the best!
Even the smallest shift in perspective can bring about the greatest prosperity.
Information provided is only educational and should not be used to take action in the markets.

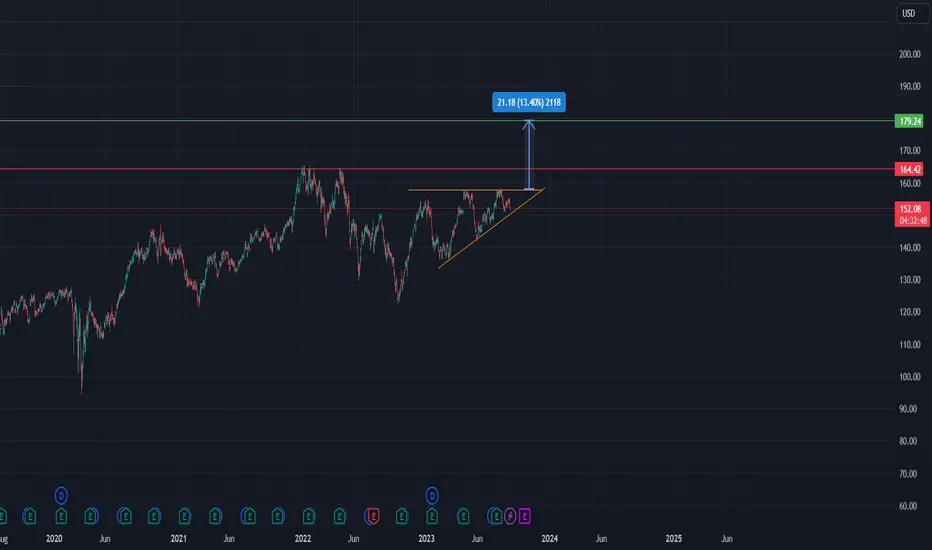
PG ascending triangle bullishP&G has been in a bullish trend for quite a long time. There is a possibility that it could break all-time high when breaking the ascending triangle pattern.
If the break out happens ,then we can enter the long position. Our estimated target is 179.84.
Do you agree? Let us know in the comment section
$PG with a bullish outlook following its earnings #StocksThe PEAD projected a bullish outlook for NYSE:PG after a positive under reaction following its earnings release placing the stock in drift A with an expected accuracy of 66.67%.

Ascending TriangleTop line is virtually flat.
Bottom line slopes up. Price is at support today,
All 3 triangles types, symmetrical, descending and ascending are neutral until broken.\\No recommendation.
This is a loose triangle. Tight triangles perform better.
Price is close to a gap that may provide support.
PG The Procter & Gamble Company Options Ahead of EarningsAnalyzing the options chain and the chart patterns of PG The Procter & Gamble prior to the earnings report this week,
I would consider purchasing the $152.5 strike price Calls with
an expiration date of 2023-8-4,
for a premium of approximately $2.97.
If these options prove to be profitable prior to the earnings release, I would sell at least half of them.
Looking forward to read your opinion about it.

PGDow jones breaks out , value and Health rocket higher.
Looking for PG to tag 160 in the next 2 weeks. Earnings is Friday.
Some tough resistance at 155 but once it breaks over that it's gone to resistance
PROCTER & GAMBLE: Starting a strong bullish leg.Procter & Gamble is off to a strong rebound on the 1D MA50 with the 1D timeframe backing it up on very healthy bullish technicals (RSI = 64.041, MACD = 0.370, ADX = 25.513). With the 1D MACD just completing its 2nd Bullish Cross in more than a month, slightly over the 0.00 level, we will take this opportunity to buy and target the top of the longer term Channel Up (TP = 161.50).
## If you like our free content follow our profile to get more daily ideas. ##
## Comments and likes are greatly appreciated. ##

P&G Target $135Procter & Gamble is in a weekly uptrend but was hitting its „head“ on the 158.00 resistance. After consolidating there it fell through the local higher low, building a new lower low and is currently retracing to that former local low which acts now as a resistance. The stock showed large sell volume on that resistance last friday which suggests we might se another break down to the current support at 135.00.
We have two problems to consider in this trade:
1. The XLP (Index for Consumer Staples, with P&G as its biggest position) is currently more on a support than resistance and might suggest an upward move. That could mean P&G breaks through the 150.00 and is heading higher.
2. The yellow trend line was not broken yet. As a price action trader this is more of a minor problem to me because trend lines are artificial and only an indication for specific price action but should not be mistaken as price action itself.
I therefore suggest to wait what happens today. If we see further downward movement, the trade could be taken. If we remain at the 150.00 resistance without larger sell volumes we should skip this one. Also, do not forget that consumer staples show steady performance during recessions and inflation periods because of the nature of their products. Not a primary concern for technical traders but it should be kept in mind.
—
🐻 Trade Idea: Short - PG
🔥 Account Risk: 1.00%
📈 Recommended Product: Knockout / Option
🔍 Entry: +/- 147.00
🐿 DCA: No
😫 Stop-Loss: 155.00
🎯 Take-Profit #1: 135.00 (75%)
🎯 Trail Rest: Yes
🚨🚨🚨 Important: Don’t forget to always wait for strong confirmation once possible entry zone is reached. Trade ideas don’t work all the time no matter how good they look. Do not get a victim of FOMO, there is always another trade idea waiting. 🚨🚨🚨
If you like what you see don’t forget to leave a comment 💬 or smash that like ❤️ button!
—
Disclaimer & Disclosures pursuant to §34b WpHG
The trades shown here related to stocks, cryptos, commodities, ETFs and funds are always subject to risks. All texts as well as the notes and information do not constitute investment advice or recommendations. They have been taken from publicly available sources to the best of our knowledge and belief. All information provided (all thoughts, forecasts, comments, hints, advice, stop loss, take profit, etc.) are for educational and private entertainment purposes only.
Nevertheless, no liability can be assumed for the correctness in each individual case. Should visitors to this site adopt the content provided as their own or follow any advice given, they act on their own responsibility.

PROCTOR & GAMBLE IS SOON TO SEE GOOD TIMES AHEADTECHNICALS -
HIDDEN BULLISH DIVERGENCE -
Procter & Gamble has formed a nice Positive Divergence or Hidden Bullish Divergence pattern on the Monthly chart indicating upside momentum on the chart
STRONG SUPPORT LEVEL
It has also Reversed Twice from a Strong Support zone which had earlier acted as Resistance level indicating further upside potential for the stock
REVERSAL FROM 50D SMA
It has also tested 50 Day Moving Average and has reversed from it nicely
FUNDAMENTALS -
NON-CYCLICAL STOCK -
It is in the sector of Consumer Non-Durable Goods (healthcare & hygiene) which is an all-weather sector making the stock immune even to the upcoming recession (if it comes at all)
EBITDA & NET PROFIT -
Its EBITDA & Net Profit Margin growth stands at 24% & 17% which beats almost 90% of its peers and ROE is at 31% which is the industry standard
DIVIDEND YIELD -
If that's not enough then the stock also gives a dividend with yield at 2.72% and it has paid dividend for 133 years and raised dividend for 67 consecutive years, what could be a better alternative than such a stable dividend paying stock during the upcoming downturn in the market (if it comes)


PG Earnings Play - LongPG recently bounced off key fib levels to continue up the channel. Earnings will be reported on 7/28 which gives us a good size window to jump in and let this ride up.
Reasons:
• Bounced off key fib level
• Continues to follow an upwards channel
• Earnings within 6 weeks
Comment below and let me know your thoughts.

Procter & Gamble is soon to see good times Ahead
TECHNICALS -
Procter & Gamble has formed a nice Positive Divergence or Hidden Bullish Divergence pattern on the Monthly chart indicating upside momentum on the chart
It has also Reversed Twice from a Strong Support level which had earlier acted as Resistance level indicating further upside potential for the stock
It has also tested 50 Day Moving Average and has reversed from it nicely
FUNDAMENTALS -
It is in the sector of Consumer Non-Durable Goods (healthcare & hygiene) which is an all-weather sector making the stock immune even to the upcoming recession (if it comes at all)
Its EBITDA & Net Profit Margin growth stands at 24% & 17% which beats almost 90% of its peers and ROE is at 31% which is the industry standard
If that's not enough then the stock also gives a dividend with yield at 2.72% and it has paid dividend for 133 years and raised dividend for 67 consecutive years, what could be a better alternative than such a stable dividend paying stock during the upcoming downturn in the market (if it comes)

Proctor & GambleLast 2 weeks have been rough on value and most health stocks. When Risk assets (Tech) outperform, stocks like value and health which are consider defensive tend to underperform or outright correct.
I think in the upcoming g next 2 weeks there will be a rotation back into value.
Here's PG on the weekly approaching trendline support, fibonacci support , weekly 50sma and daily 200sma all around 143 area .
Im looking for a pop up to 150 in the next week before a minor pullback then a leg Higher to 160.
Price usually doesn't go straight up, there's usually a accumulation pattern (Double bottom , inverted H&S) like I've showed in the yellow box
142 stop loss

PG on downtrend continuanceOn the 2 hr chart, PG was fighting heavy resistance for month. The supply /resistance zone is
on the chart from the Luxalgo indicator. Multiple touches but the zone was not broken.
Price has retraced down beyond the 0.5 Fib level. PG is tracking well with XLP the consumer
staples ETF shown as a thin black line on the chart.
The Luxaglo Echo indicator, a predictive AI tool suggests that price will retest the 0.5 Fib level
and then descend to the support /demand zone with a volume mean of 149.5.
I will take a short position with put contracts with a strike of $ 154 above the Fib 0.5 level
with DTE of 6 = 5/26.
For the stock position, I will set a sell limit of $153 also with a stop loss of $ 154 with the
the target for 2/3 of the position at $ 150 and the remaining third is to watch to see if the
zone brakes. I believe that this is a safe trade in a low-volatility stock set to capture
profit advantaging the prevailing trend running in concert with the subsector ETF.
