PLNTRipped back into the channel, closed my short at the open. Should have went long but had other priorities. This one is back on the watchlist for now. I should mention that, generally, when my setups fail, they fail HARD in the opposite direction. Just in case anyone out there is dumb enough to trade what I trade lol.
PLNT trade ideas

PLNTTrying to bust through the double top/200 sma/old channel resistance. Staying short here unless continuation tomorrow. Still think we see a brutal month in this name but will take my L if and when I need to.
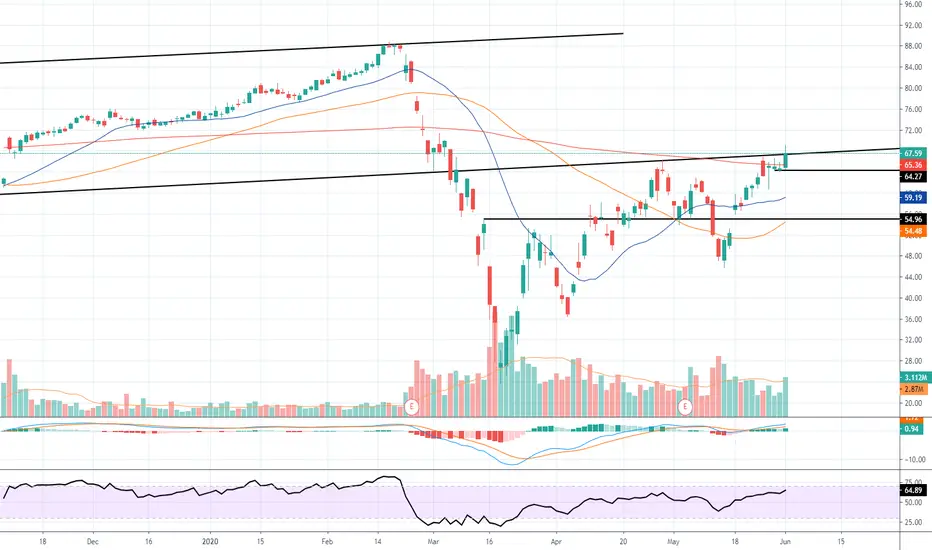

PLNTDouble topping at underside of 1.5 year channel trendline and 200 sma? I'm interested below today's lows.


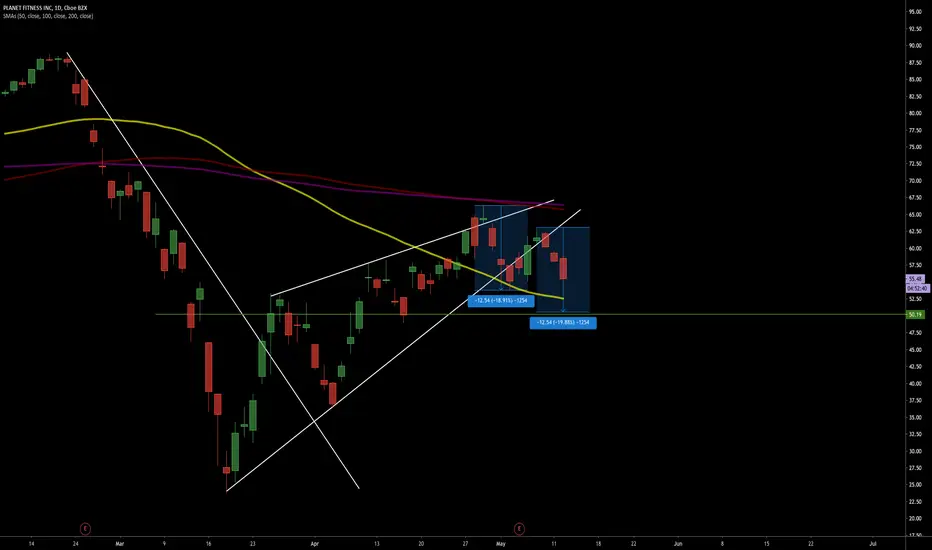
PLNT ShortCompleted H&S pattern for sure with the drops for the last two days. We're up nearly 100% on puts. Expecting a small retest of about $50 before continued momentum down. Indicators showing that there is still room down.

PLNT moving down finallyGyms are going to suffer for a while even if they start to officially start reopening.
On chart, an H&S type pattern showing for the last few weeks seems to be completing. Suggested move to downside on oscillators: Sell/Buy, A/D, MACD, RSI.
Our timing was off, but we're green now. Position is in June 19 $50P

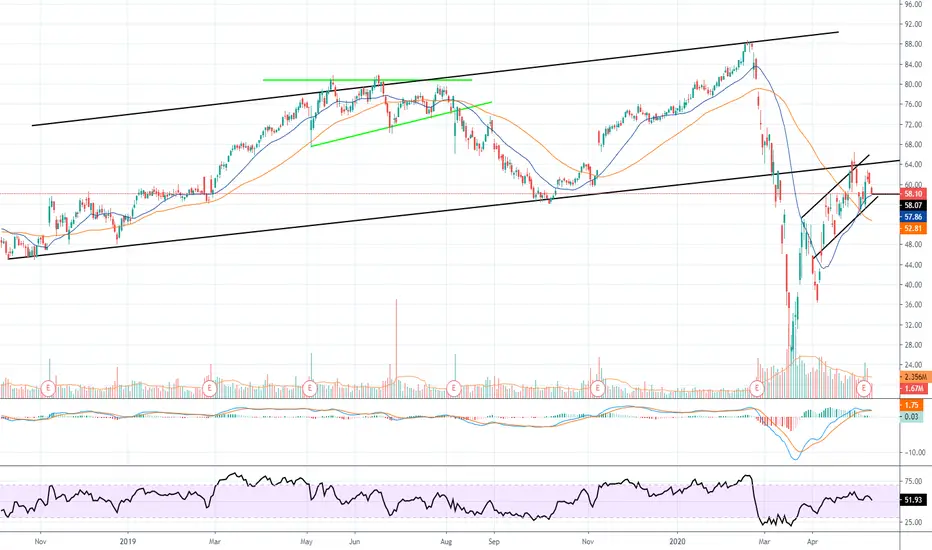
PLNTSeems like a pretty clear breakdown and retest of this channel it's been in since the end of 2018. Will look to get short on a break of today's low.
PLNT shorthonestly better test-case than $T due to PLNT's earnings coming out today at 4:30pm.
I called a lucky rally, didnt expect for it to pump up way past $55, but it did.
Especially since their franchisees are getting absolutely fuckt during this CV lockdown.
5% royalties to corp might be good, IF they actually turn some kind of profit, but given a 5:1 debt to operating income if this doesnt start their future demise idk shit.

Planet Fitness is up almost 100% since April 1?!Planet Fitness doesn't seem to have a great reputation as far as gyms go. It's basically like the cheapest option out there from what I've heard. Still, it's enjoyed quite the run up from its price of $35 at the start of April.
You probably have noticed a pattern in the TAs that are posted here. Accumulation/distribution on this has remained FLAT despite the huge run up since the beginning of April. To me, this is an indication of an underlying weakness in the stock. However, I would like to see a little more downward momentum before shorting this with serious money. However, a few small positions here and there don't seem like a bad idea. IV is relatively low and short-term May 15 puts aren't too pricey. However, I may wait a little longer to see how it plays out before buying a large position as I am not sure what it will do up to earnings.


PLNT - Stochastic has your back when other oscillators don't.I placed a swing trade today based on a hunch that my gym is going to suffer membership decline on a scale which has yet to be priced in. When RSI, ADX, MACD, and my other favorite oscillators failed to confirm my bias on the daily chart after the fact, good old Stochastic came through with a clean overbought crossover sell signal. It also happens that the 50-day SMA is lingering close above, approaching quickly, and we are at some pretty stiff resistance going back as far as Sept 2018. My short entry was $56.33, will get out on a close above resistance.


PLNT Fibonacci RetracementBrief Analysis on PLNT. Assuming it had already reached a SIGNIFICANT LOW, the 23.6% resistance line at $38.92 looks to be the next stop. If it breaks through that first resistance, it is headed to the high forties, however, if it fails to break the resistance assume a fallback to the high/mid 20's.


PLNTBounce time for Planet Fitness? Lot of volume down here. RSI oversold. We'll see if the trend holds.
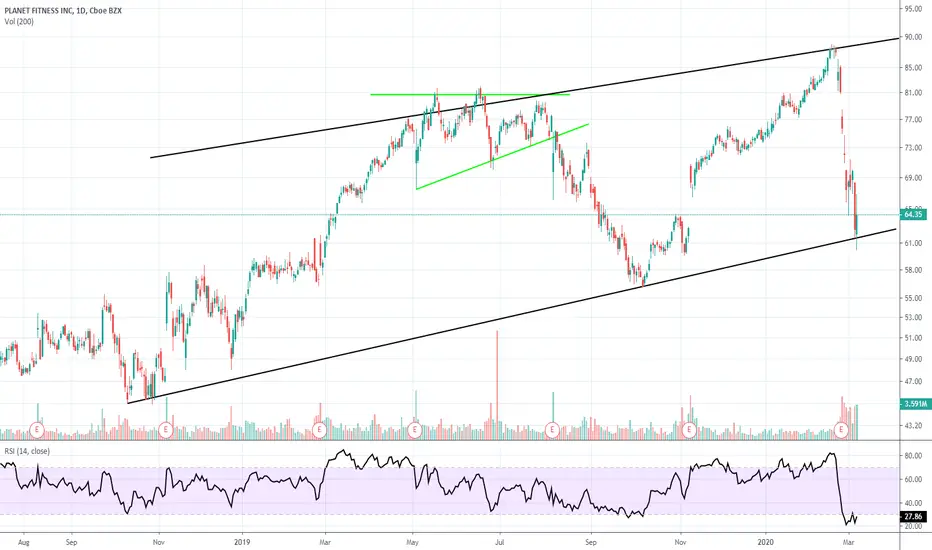

Planet Fitness Breakout pre Earnings
Possible entry level $83.40
Target price $97.54
Stop loss $79.95
Company profile
Planet Fitness, Inc. engages in the operation and franchise of fitness centers. It operates through the following segments: Franchise, Corporate-Owned Stores, and Equipment. The Franchise segment includes operations related to the company's franchising business in the U.S., Puerto Rico, Canada, the Dominican Republic, and Panama. The Corporate-Owned Stores segment deals with the operations with respect to all corporate-owned stores throughout the U.S. and Canada. The Equipment segment sells equipment to franchisee-owned stores. The company was founded by Michael Grondahl and Marc Grondahl in 1992 and is headquartered in Newington, NH.

Bullish ChannelCurrently trading in a bullish channel with trendline and 20sma support. Can make a run at ATH as long as channel support holds.

PLANET FITNESS 1D RANGE TRADESRanges are repeatable trading chart patterns.
Ranges are consolidation chart patterns that can breakout either direction.
Each chart pattern will have defining trendlines of the support/resistance levels creating the pattern.
What ever time frame you are trading this chart pattern, wait for a candle close outside of the trendline in the direction of the breakout candle. (Our time frame preference is the Daily chart).
Add volume indicator - Volume is the amount of $ that went into a particular candle or in Forex the # of trades that took place.
Add ATR indicator - Volatility is the amount of price movement that occurred. Use the ATR to measure the price movement.
When you see descending Volume bars and descending ATR line (which indicates volatility) this shows
a dis-interest in traders to invest in this pair creating consolidation which creates the chart pattern.
Trade Management after there is a breakout candle close.
1 - Position size (compare volume bar to volume ma line).
a - Breakout candle must be 100% of average volume for a full position size.
b - If 75% of average volume then ½ position size. (To find 75% of Volume
look at the charts volume settings – divide smaller # into larger # = 75%+)
2 - Enter two trades.
3 - SL for both trades will be 1.5 x ATR.
4 - 1st trade TP will be 1 x ATR.
5 - No TP on 2nd trade – letting profit run and adjusting SL to follow price.
6 - When 1st TP hit – move 2nd trade SL to breakeven.
7 - Adjust the 2nd trade SL to follow price.
*8 – After Breakout candle – if price closes back into chart pattern close trade
*9 - When breakout candle is more than 1 ATR from breakout candle open.
a - Enter 1st trade at candle close with ½ position size.
b - Enter 2nd trade with a pending limit order that is 1 ATR of breakout candle open.
c – Price should pullback to that pending limit order for 2nd trade.
d – If Price returns back into chart pattern close trade before SL is hit.
