Palantir - The unstoppable company!💣Palantir ( NASDAQ:PLTR ) is just too strong:
🔎Analysis summary:
Since mid 2022, Palantir managed to rally more than 2.500%, creating new all time highs every single month. Eventually this rally will slow down, but before this happens, Palantir could rally another +100%. This is a classic example of stock market behaviour and you should take advantage.
📝Levels to watch:
$200
SwingTraderPhil
SwingTrading.Simplified. | Investing.Simplified. | #LONGTERMVISION
PLTR trade ideas

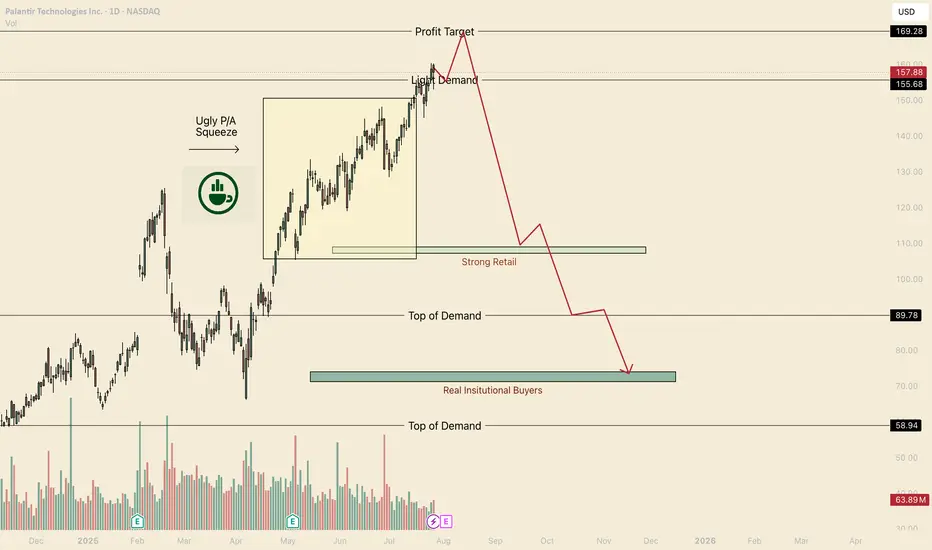
Hot Take, PLTR is a BubbleHello I am the Cafe Trader.
Price Action suggest we haven't had a proper buyer since $90.
Now I know that this can sound a bit off putting (especially if you bought above $90).
Even if this crashed, I am not suggesting you sell your long term position. I would instead look into hedging your position, giving yourself some exposure to the downside.
Consider these 2 non-biased reasons before writing me off.
Point 1
Price action suggests we have been in a short squeeze since April. Although in the short term I do see current retail buyers taking this to 169.
Point 2
If we do not land new Strong Buyer (someone that can support the price) all of this squeeze will come crashing back down to where they can support the price.
Conclusion
If we close below 152.50 on the day, this would suggest that bears have or are in control. This would expose many to tons of risk.
Here are my long Term prices for PLTR
Aggressive = 120
Fair = 107.50 - 108.50
Good = 89
Steal = 71-74.50
That's all for PLTR take a look at my other articles if you are interested in more!
Happy Trading!
@thecafetrader
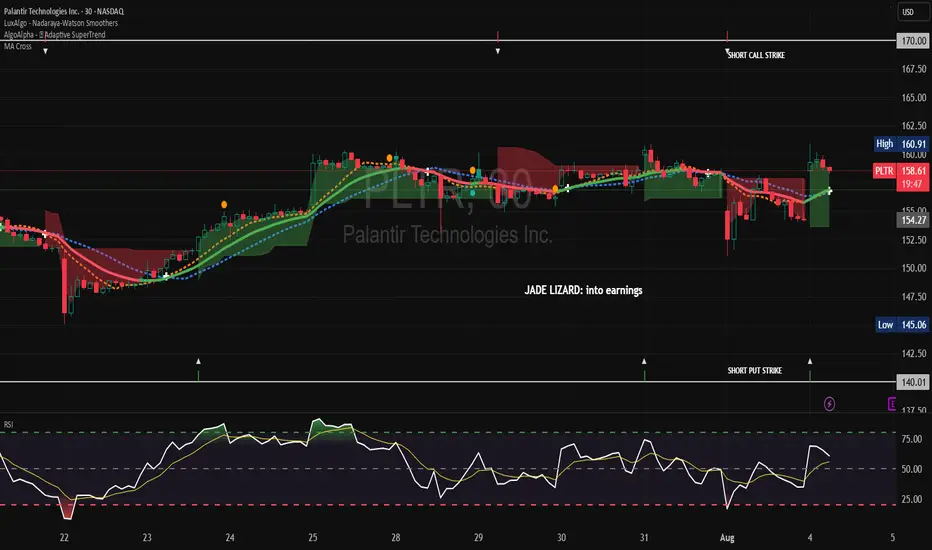
A Jade Lizard Play for Earnings (4-dte) on PLTR.
This is 4-DTE with a wide $140 short Put and $170 Short Call spread.
A slightly bullish strategy combining an out-of-the-money short put and out-of-the-money bear call spread. When created properly, this strategy has no upside risk. It is best suited for oversold stocks with high implied volatility.
Palantir is a cult? Ticker: NYSE:PLTR
Current Price: $173
Market Cap: $380B+
P/S: 116x
P/E: 500x+ trailing, 234x forward
Bear Thesis:
Palantir is now trading at a level that makes even Nvidia look cheap. This is a classic parabolic AI play driven by retail FOMO, not by fundamentals. The company needs to maintain 30%+ annual growth for years just to justify today’s valuation. One miss, and the whole tower comes down.
Problems:
1. Valuation is insane, far above anything justified by cashflow or realistic comps. DCF and sum-of-parts models put fair value between $20 and $30. That’s up to 85% downside from here.
2. Analyst average price target sits at $108. Plenty call for $40–$75 if growth stalls or the hype fades.
3. Heavy reliance on US government deals. Any cut to defense budgets, a change in admin, or a headline scandal and half their contracts can disappear.
4. Competition is coming hard. Google, Amazon, Microsoft all pushing enterprise AI. Palantir’s moat is shrinking.
5. Stock acts like a meme: options-fueled squeezes, no connection to cashflow. If market sentiment turns risk-off, these multiples get crushed.
What could trigger the unwind:
• Any earnings miss, weak guidance, or margin compression
• Defense budget cuts or bad headlines
• AI trade rotation or a macro correction targeting high-flyers
• Commercial growth disappoints
Bear Targets:
• $108: analyst average (still aggressive)
• $40–$75: if narrative breaks, AI hype dies, or execution slips
• $20–$30: where most bear DCFs cluster, fair value based on realistic growth
Bottom Line:
PLTR is pricing in perfection in a market that rarely delivers it. If you’re long here, you’re paying tomorrow’s prices for today’s story. This is one of the most crowded trades in AI right now, and history says these always end the same way. Protect your capital.

PLTR Approaching Critical Levels. Can the Breakout Sustain?Aug 7PLTR Approaching Critical Levels – Can the Breakout Sustain? 🔥
🔍 Technical Analysis (1H & 15M View)
PLTR has been in a strong uptrend, respecting the upper trendline of the rising channel on the 1H timeframe. Price is consolidating below $180 after a clean breakout from the $172.5–$176 range. Bullish momentum remains intact as MACD crosses upward again with histogram flipping light blue. Stoch RSI is mid-range, allowing room for another push.
* Key support: $176.21 and $172.27
* Resistance ahead: $183.00–$185.00 zone, aligned with projected trendline
* Trend structure: Higher highs and higher lows — buyers remain in control
* Volume is consistent on green candles, showing strength behind moves
15-Minute Chart Insight:
Price is flagging just under the $180 resistance after a measured move. A breakout above $180 could trigger a squeeze toward $183–$185. A clean 15-min close below $176 would weaken this structure and invite a pullback to $172.27.
Bias: Bullish while price holds above $176.21
🧠 Options & GEX Sentiment (Based on Tanuki GEX Map)
* GEX Resistance Zones:
* $182.5 → $185.0 (GEX9 + GEX7): This is the strongest gamma resistance cluster — a breakout here would be explosive.
* $179.5–$180 also marks a wall with high net positive GEX.
* Support Zones:
* $172.5–$176.21: Shallow demand zone, supported by options flow.
* $162.5–$160.0: Stronger GEX and HVL support, likely defended by dealers.
* Options Sentiment:
* IVR: 12.6 → Low implied volatility
* IVx Avg: 53.9 → Currently below average IV
* CALL$: 20.6% dominance → Mild bullish tilt
* GEX sentiment: All green (📗📗📗📗) — supports upside continuation
✅ Game Plan
* Bullish Setup:
* Entry: Above $180.2
* Target: $183.3 → $185
* Stop: $176.2
* Bearish Setup (only if rejected hard):
* Entry: Break below $175.5
* Target: $172.27 → $170
* Stop: $178
Scalpers can look for breakout retests on 15M or use VWAP bounce entries if price pulls into $176.2–$177.0 zone.
This analysis is for educational purposes only and does not constitute financial advice. Always do your own research and manage your risk before trading.
PLTR - Rising wedge formation leads to potentially larger move🧠 PLTR WEEKLY TECH+FUNDAMENTAL BRIEF
Ticker: NASDAQ:PLTR | Sector: AI / Big Data / Defense Tech
Date: July 27, 2025
🔍 Chart Watch: Rising Wedge Risk
Palantir is trading within a rising wedge formation, a pattern often signaling bearish reversal if upward momentum fades. Recent price action has tightened within this channel, and volume has been declining—a potential warning sign.
🔧 Key Technical Levels
Short-Term Resistance: $145–146
Short-Term Support: $140.50 → $137 → $132
Breakout Target: $150–155
Breakdown Risk: Below $137 could trigger $132–128
Trend Watch: If price holds wedge support, PLTR could climb toward the $150–155 range. A breakdown targets prior support at $135 or lower. Watch volume for confirmation.
💼 Palantir Fundamentals Snapshot
Q1 2025 Revenue: $884M (+39% YoY)
U.S. Commercial Growth: +71% YoY
Operating Margin: 36%
Free Cash Flow Margin (Projected): >40%
Cash Position: ~$4B
Profitability: GAAP positive for 7 straight quarters
Valuation: Forward P/S ~92–120x, Forward P/E ~200–230x
⚠️ High valuation implies heavy dependence on earnings momentum and contract wins. Any slip could lead to outsized pullbacks.
🧠 AI & Government Catalysts
Palantir continues to dominate the intersection of AI deployment and government data operations.
Notable Drivers:
$795M U.S. DoD Contract
Deep integration with agencies including CDC, IRS, Army, ICE, NHS
AI tools (AIP) deployed across sectors; strong commercial traction with Accenture, SAP, Microsoft Azure
Positioned as a critical AI infrastructure provider for NATO & U.S. defense modernization
AI Bootcamp strategy converting trial users into full deployments at scale
📆 What’s Ahead?
🔜 Upcoming Catalysts:
Q2 2025 Earnings (Early August):
Expected revenue: ~$937M (38–54% YoY growth range)
Federal Government Contracts:
Expansion of Project Maven, battlefield AI systems, and civilian data tools
AI Legislation & Spending Bills:
Ongoing policy developments could support longer-term tailwinds
🧭 Summary & Outlook
Timeframe Support Levels Resistance Levels Outlook Summary
Short-Term $140.5 → $137 → $132 $145–146 → $150–155 At wedge support. Breakdown could target low $130s unless buyers defend.
Near-Term $144.8–149.1; then $137 $159–160 → $170 (post-earnings) Strong fundamentals, but rich valuation demands execution.
🧩 Bottom Line:
PLTR remains an AI and defense-tech heavyweight. However, its current chart setup suggests caution in the near term. Watch for decisive moves around $145 and $140. Long-term bullish thesis remains intact, but the next move may hinge on Q2 earnings and AI contract flow.
Stay nimble.
PLTR WEEKLY TRADE IDEA – AUG 2, 2025
📈 **\ NASDAQ:PLTR WEEKLY TRADE IDEA – AUG 2, 2025** 📈
⚡️ *Earnings Week Setup – Mixed Signals, But Bullish Flow*
---
🧠 **SENTIMENT SNAPSHOT**
• Call/Put Ratio: **2.29** = Bullish
• Volume Ratio: **1.1x** = Weak breakout support
• VIX: **20.38** = Normal vol, clean setups possible
📉 **RSI DIVERGENCE WARNING**
• Daily RSI: **56.3 (falling)** – losing steam
• Weekly RSI: **71.2 (overbought + falling)** – 🔻Bearish divergence
➡️ *Momentum fading, caution advised*
📊 **INSTITUTIONAL FLOW**
• Strong call buying ahead of earnings
• But... price not confirming = possible **profit-taking**
⚠️ **EARNINGS RISK ALERT**
• Earnings = this week
• Could inject volatility or invalidate setup – size small & use stop
---
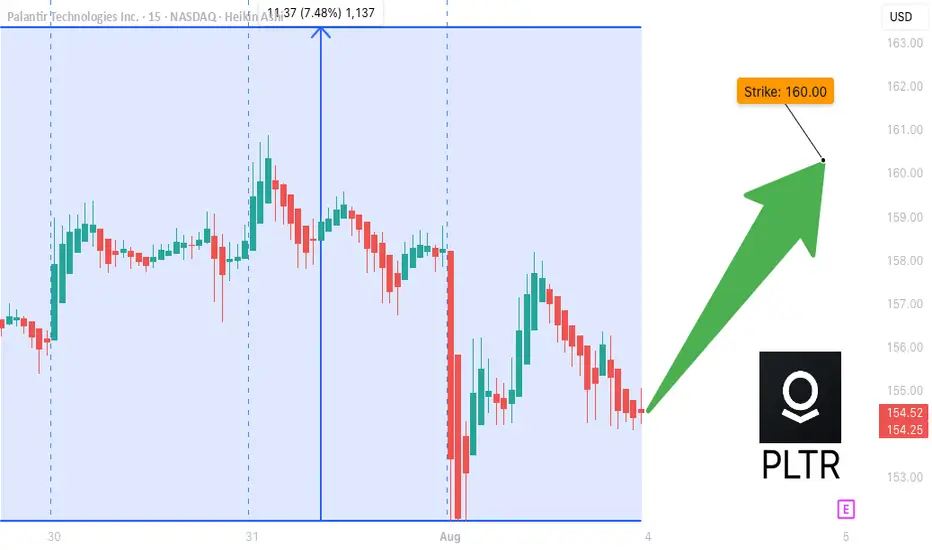
🔥 **TRADE IDEA** 🔥
🟢 Direction: **CALL (LONG)**
🎯 Strike: **\$160**
💰 Entry: **\$6.80**
🏁 Target: **\$12.25** (80%+ gain)
🛑 Stop Loss: **\$3.40** (50% risk)
📆 Expiry: **08/08/2025**
⚖️ Confidence: **65%** (moderate risk, macro-backed)
⏰ Timing: **Buy Monday Open**
---
🔎 **STRATEGY TAGS**:
\#PLTR #WeeklyOptions #EarningsPlay #MomentumTrade #SmartMoneyFlow
---
📌 Final Thoughts:
Mixed momentum + strong call volume = **potential breakout**, but **momentum cracks** say **don’t chase blindly**. Small size, tight stop, defined risk = smart approach here.
🚀 *Save + Follow for more option setups each week!*
PLTR Earnings About To Print
## 🚨 PLTR Earnings Incoming: +80% Confidence Call Setup into AI Boom 🚀
**🧠 Palantir Technologies (PLTR) Earnings Analysis – August 8, 2025 (AMC)**
**📈 Position:** \$165 Call | 🎯 Entry: \$6.45 | 💰 Target: \$22.58 | 🛑 Stop: \$3.23
**🕒 Entry Timing:** Pre-Earnings Close | Expiry: Aug 8, 2025
---
### 🔍 Quick Breakdown:
* 📊 **Revenue Growth:** +39.3% TTM – AI sector leadership
* 💰 **Margins:** 80% Gross | 19.9% Operating | 18.3% Net
* 🧾 **EPS Beat Rate:** 88% | Avg Surprise: +10.7%
* 📉 **Debt-to-Equity:** 4.43 – watch rates & debt risk
* 📈 **RSI:** 66.88 – strong momentum, near breakout
* 📊 **Volume:** Above average – institutional accumulation
* 🧠 **Options Flow:** Heavy \$165/\$170 call OI = bullish gamma exposure
* 🛡️ **Support:** \$151.94 | 📌 Resistance: \$161.24
* 🔭 **Macro Tailwinds:** AI + defense demand + sector rotation into tech
---
### 🧠 Trade Thesis:
Strong fundamentals + bullish options flow + tech sector tailwinds = **High-probability breakout**
🧨 **IV Rank: 0.75** – Big move priced in
💡 Likely to squeeze if results exceed expectations
---
### 💼 Trade Setup (Recap):
```
💎 Ticker: NASDAQ:PLTR
🔔 Direction: Long Call
🎯 Strike: $165
💵 Entry: $6.45
🎯 Profit Target: $22.58 (250%+)
🛑 Stop Loss: $3.23
📅 Expiry: 2025-08-08
📆 Earnings: August 8 (AMC)
🧠 Confidence: 80%
```
---
### 📌 Hashtags for TradingView:
```
#PLTR #EarningsPlay #AIStocks #TechMomentum
#OptionsTrading #GammaSqueeze #CallOptions
#UnusualOptionsActivity #Palantir #EarningsSetup
#TradingViewIdeas #VolatilityPlay #RiskReward
#AI #DefenseStocks #SwingTrade
```
---
💬 **TL;DR:** PLTR earnings are set to rip. Revenue surging, margins healthy, call options stacked, and momentum rising. Are you in before the AI-driven explosion?

PLTR Holding Strong. TA for Aug. 6PLTR Holding Strong – Can the Momentum Continue? 🚀
Technical Overview (30-Min Chart)
PLTR has been in a strong uptrend, riding a steep ascending channel from the $151 support region. After hitting a high of $176.33, price has slightly cooled off but remains above $171, indicating healthy consolidation rather than a breakdown. MACD is showing a gradual loss in bullish momentum, while Stoch RSI is oversold—suggesting potential for another leg higher if buying pressure resumes.
Key support lies at $167.50–$165 (previous breakout area), while resistance remains at $176–$180 (channel top).
GEX / Options Sentiment
* Major Call Walls: $177.5, $180 – heavy gamma resistance where market makers could slow price movement if breached.
* Highest Positive NETGEX: $176.3 – aligns with the channel resistance, making it a critical breakout level.
* Strong Call Positioning: 72% concentration at $165–$177.5 range keeps the bias bullish above $167.
* Put Support: $155 – heavy protection level where downside could stall if selling pressure picks up.
Trading Plan
Bullish Scenario (Higher Probability if Above $167)
* Entry: On reclaim of $173 with strong volume or breakout above $176.5.
* Target 1: $177.5 (Call Wall test)
* Target 2: $180 (next gamma wall)
* Stop Loss: $166 close basis.
* Options Idea: Short-term weekly calls targeting $177.5+ strikes if breakout confirmed, keeping expirations tight (1–2 weeks).
Bearish Scenario (Only If Breakdown Below $165)
* Entry: On break & close below $165.
* Target 1: $160.7 (minor support)
* Target 2: $155 (Put wall)
* Stop Loss: Above $167.
* Options Idea: Short-term puts targeting $160–$155 zone, tight expiration to capture momentum drop.
Summary
PLTR remains bullish as long as $167 support holds. Watch for breakout above $176.3 for a gamma-driven push to $180. Options flow shows strong call dominance, but failure to hold $165 could flip sentiment quickly.
Disclaimer: This analysis is for educational purposes only and not financial advice. Always manage risk according to your trading plan.

PLTR: Temporal Patterns🏛️ Research Notes
The fact that price touched and reflected up from the curve that mimics exponential growth, forced me to focus on the precursors that could explain the geometry of such decisive move.
Let's strip the chart and document how exactly chronological chain of human emotions were progressing across vast cycles.
Essentially, the composite sub-cycles patterns are the same but stretched towards denser probability point. It's not just percentages that matter, but how it was structured on the way down. Evidently that was enough to trigger exponential growth. (BTW, since that super-bottom price is up 2950%)
So, that force made the time tick differently in the following bigger cycle. Manifests in frequency of reversals of sub-waves and changing scaling laws.
Particular parts of large curves with gradient of last reaction move can be connected to further express how two forces push the price toward some mutual angle.
Publishing interactive chart as low as 1h TF to observe in details.
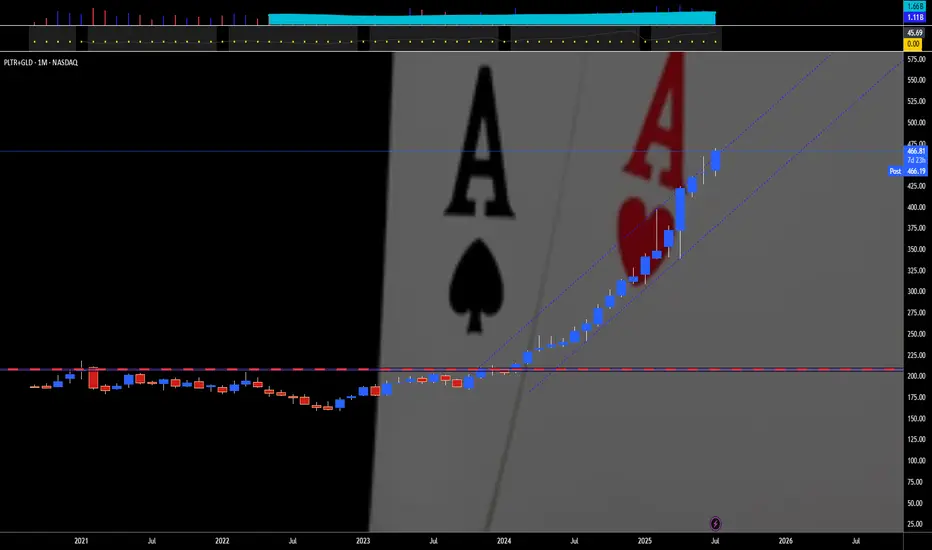
PALANTIR PLUS GOLD — TWO IS A PAIR"Two is a pair" means that the number two represents a set of two identical or closely related items that are used together or considered a unit. For example, a pair of socks, a pair of shoes, or a pair of gloves. It can also refer to two people, animals, or things that are grouped together.
Here's a more detailed breakdown:
Definition:
A pair is a set of two things that are alike, matched, or intended to be used together.
Examples:
"A pair of socks" - two socks designed to be worn on the feet.
"A pair of scissors" - two blades joined together.
"A pair of lovers" - two people romantically involved.
Singular/Plural:
The word "pair" can be singular or plural, depending on how it's used. For example: "This pair is comfortable" (singular) and "These two pairs are comfortable" (plural).
Relationship:
While "pair" often implies a strong connection or matching nature, it can also be used for things that are simply grouped together.
For example, like Palantir NASDAQ:PLTR & Gold AMEX:GLD that match each other, for 18 straight months in a row. 💖
--
Best wishes,
@PandorraResearch Team
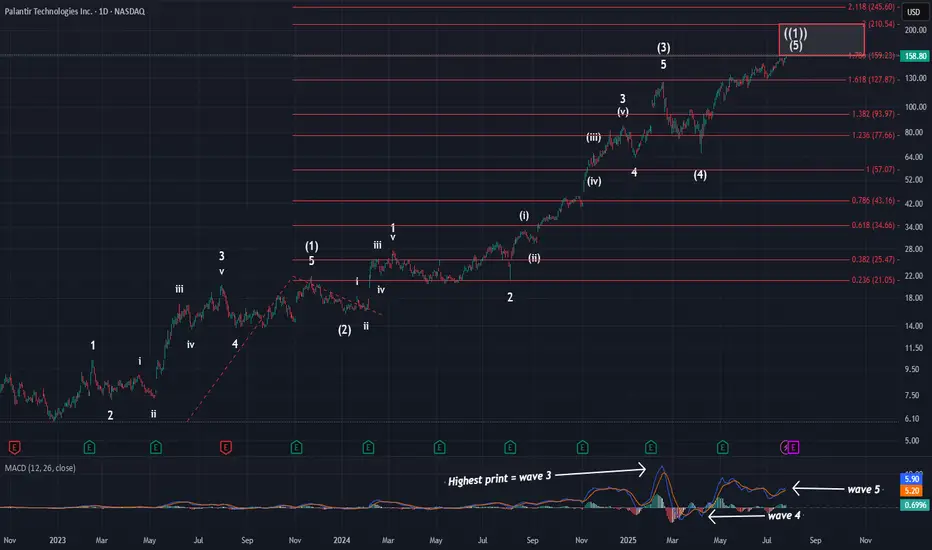
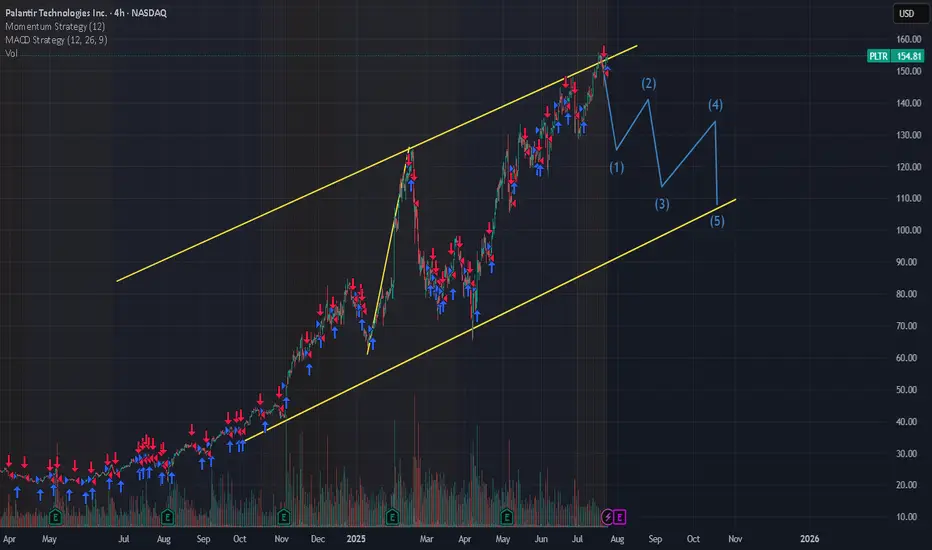
PalantirOn Friday, price hit the 1.236 extension and the larger red 1.786 extension @ $159. Tonight, I wanted to zoom out to show you where price is in the grand scheme of things. As you can see, we have all of the needed waves in place to consider this larger pattern complete. We have finally hit the standard target box for primary wave ((1)), and almost finished on what I am calling a smaller degree ED. This means that the reversal is soon at hand and that the initial move lower will be swift.
This primary wave ((1)) has lasted over 2.5 years. However, there is no way to predict exactly how long primary wave ((2)) will last. It could be short, or it could be long. Primary waves typically last months to even years to complete. Given the length of wave ((1)), I think it is safe to say wave ((2)) is likely to last over 1 year at the minimum. When our consolidation does kick off, we should be targeting the $50-$80 range for completion. Again, that won't happen fast. I will very likely take at least a year to complete.
For now, though, in the short term this pattern is putting the finishing touches on. Seeing this zoomed out picture again hopefully puts into perspective exactly how close we are to completion.
P.S: Looking at MACD, you can see I have labeled the larger waves. You can also see how much hidden bearish div we have at this time.
Pltr continues to defy logic600 p/e and 275 p/s, it has to go down right? The consensus seems to be we see a sell off after earnings. I'm not so sure, the trend seems very consistent so far. I think a test of $170 is more likely. We've never seen a AI platform before, the potential growth acceleration here could continue to defy logic, especially when analyst estimates seem far too pesimistic.
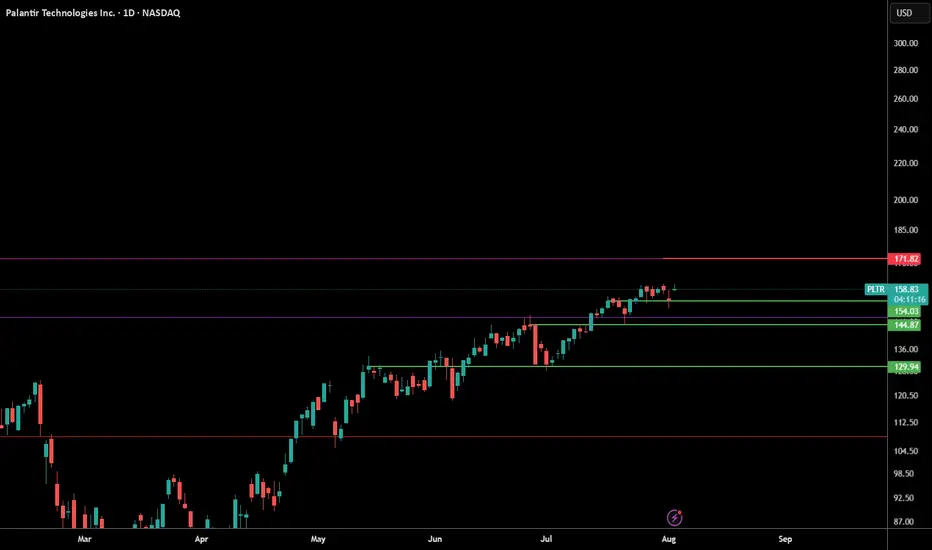
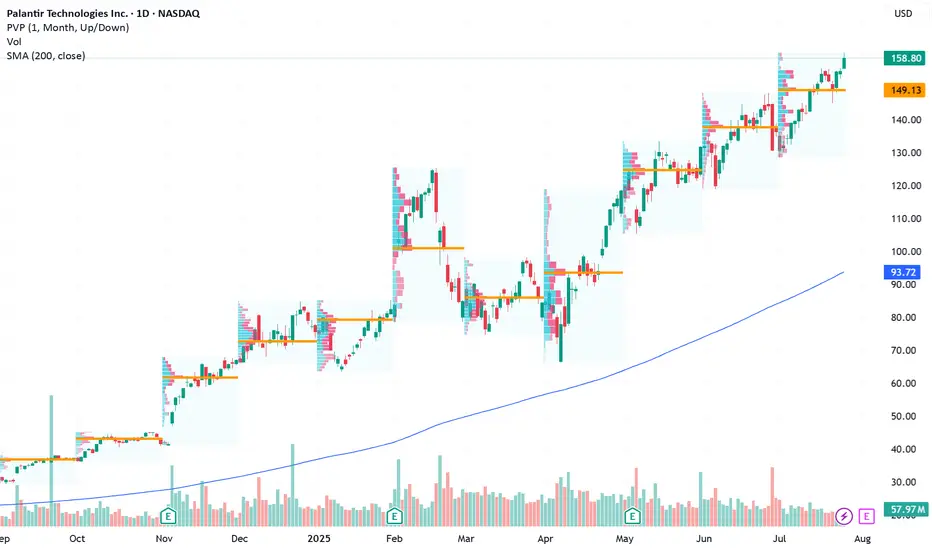
Palantir Technologies (PLTR) Shares Surpass $160Palantir Technologies (PLTR) Shares Surpass $160 for the First Time
Shares of Palantir Technologies (PLTR), a company specialising in big data analytics software, have continued their impressive performance. Following an extraordinary rally of approximately 340% in 2024, the stock remains among the top performers in the equity market:
→ since the beginning of 2025, the share price has climbed by approximately 113%;
→ on Friday, PLTR set another all-time high, with the share price exceeding $160 for the first time.
What Is Driving Palantir Technologies (PLTR) Higher?
The bullish sentiment is underpinned by the following factors:
→ Major partnerships. Among the contracts are an agreement with the US Army to develop a command system, collaboration with Accenture Federal Services, and many others.
→ Positive analyst outlooks , highlighting Palantir’s unique growth model and high margins. Analysts at Piper Sandler have set a price target of $170 for PLTR, while Wedbush recently raised their target to $160.
In addition, investors are looking ahead with optimism to the upcoming quarterly report scheduled for 4 August, which is expected to reinforce Palantir’s leadership position in a market increasingly driven by AI technologies.
Technical Analysis of Palantir Technologies (PLTR) Chart
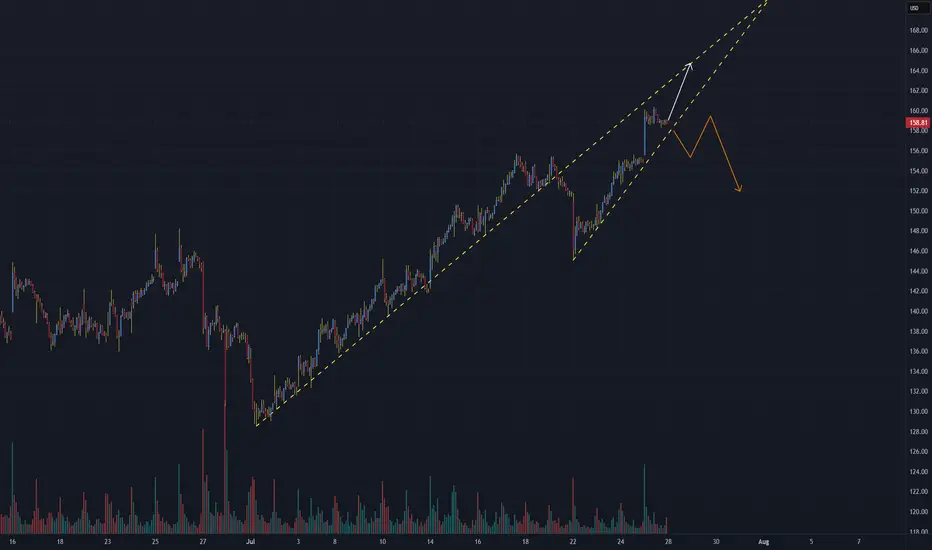
Price action has formed an ascending channel (shown in blue), with a notable bullish pattern: each pullback (marked with arrows) has been followed by:
→ a lack of further downside momentum;
→ a rebound above the level where the decline began.
From a sentiment perspective, it is reasonable to infer that price dips are perceived not as warning signs, but as opportunities to accumulate a high-performing stock at a relative discount.
Given these factors, we expect that the upcoming earnings report could propel PLTR shares towards the upper boundary of the blue channel.
This article represents the opinion of the Companies operating under the FXOpen brand only. It is not to be construed as an offer, solicitation, or recommendation with respect to products and services provided by the Companies operating under the FXOpen brand, nor is it to be considered financial advice.
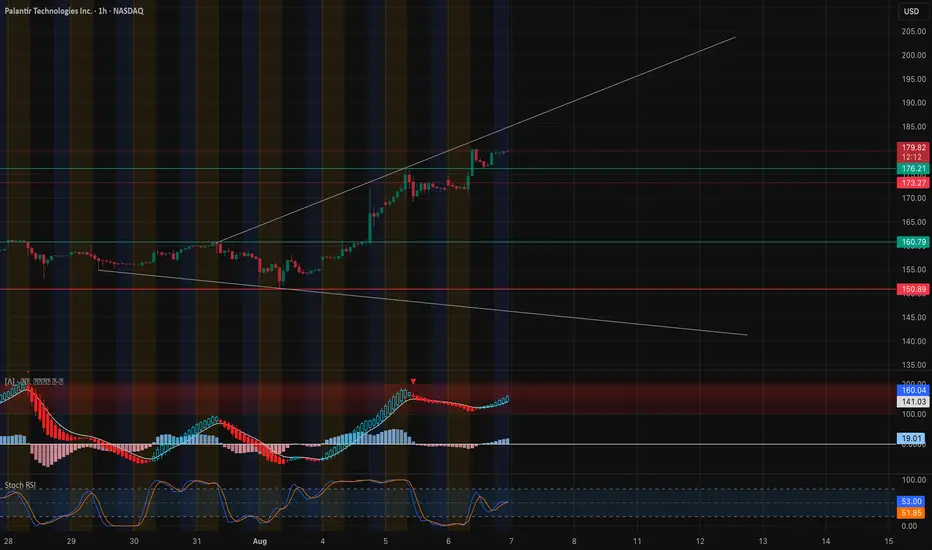
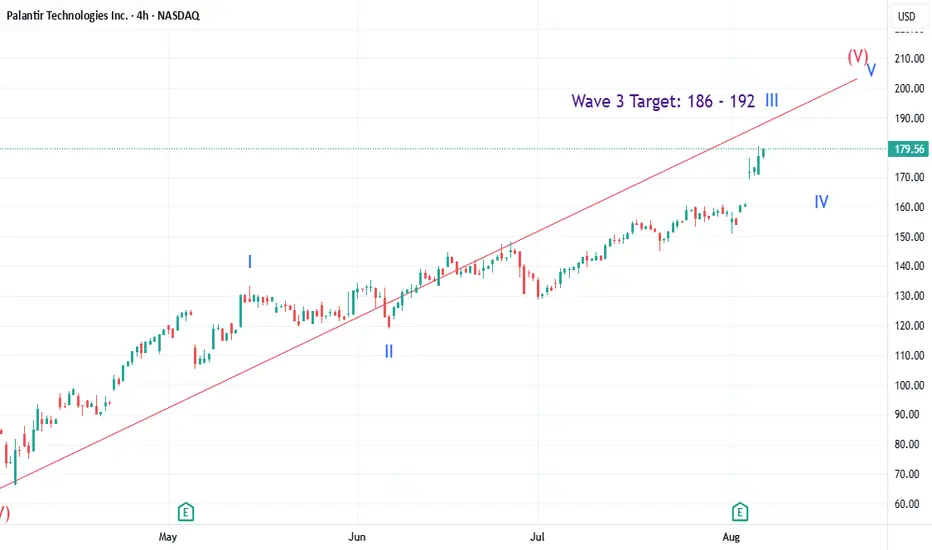
PLTR: Setting up for End of Wave 3 of 5PLTR beat earnings as expected and is exhausted going into wave 3 of 5. Expecting a retrace in the next few weeks before finally topping out between $200 and $205.
Guys take profit for PLN. A big correction coming soon.Guys take profit for PLN. A big correction coming soon. Based on technical, all the stock market over bull and a big correction coming with in a month. Pls be careful.
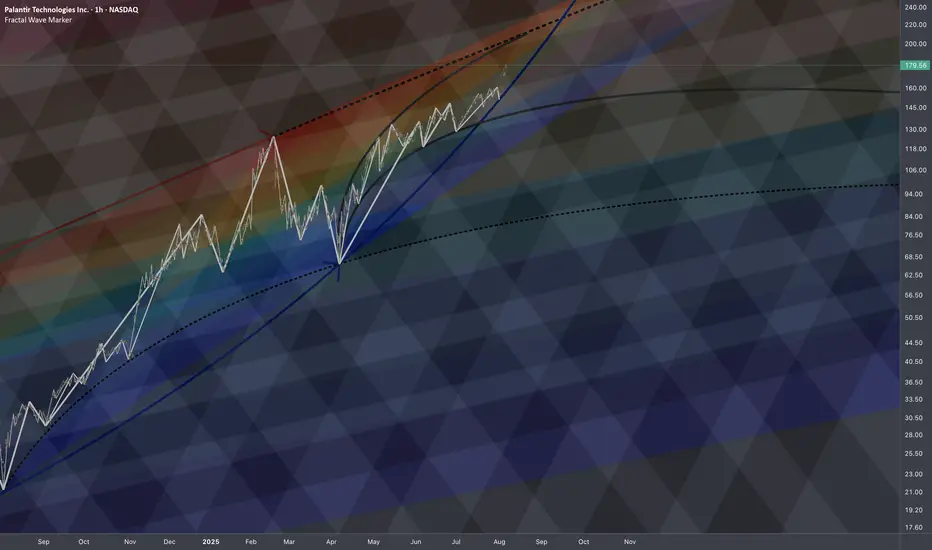
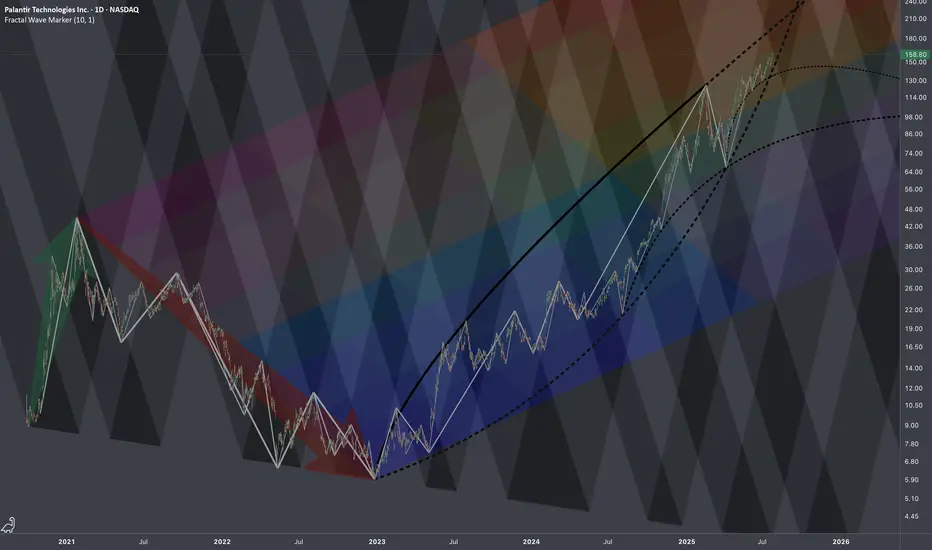
$PLTR: Regressive Heatmap🏛️ Research Notes
Technically this looks overbought, but fundamentally we know that under current administration this company is clear beneficiary (new contracts). Seems to explain why chart's dips were bought off extending bullish phases of cycle. However, there is still always a limit (as price keeps moving up, it alters the chances and magnitude of counter-move). Therefore, I'll test how wide range of 2021-2022yrs drop (prev cycle) can define the bullrun of current cycle. I'd say the very fact of anchoring the structure to actual chart points inherits its texture in next series of fractal based fib ratios.
All observed key coordinates build up into the following cross-cycle interconnections:
PLTR Long trade!🟢
You’re expecting price to move upward, and your chart reflects a breakout setup with multiple resistance levels marked.
🔍 Key Technical Elements Noted:
Ascending triangle breakout:
The pink trendlines show an ascending triangle (bullish pattern) that successfully broke out.
Support Zone:
Around 158.00 – 158.62 (highlighted by the yellow lines), showing a prior resistance turned into support.
Resistance Zones (Target Levels):
161.58
163.67
165.02
These cyan and red lines look like Fibonacci extensions or supply zones — ideal for profit targets.
Risk Level:
Likely below 158 or just under the recent wick — this acts as your stop-loss zone.
Volume/Breakout Candle:
Strong bullish candle visible near breakout level, confirming entry strength.
✅ Possible Long Trade Plan (Example):
Entry: Around $158.60 (current price)
Stop-Loss: Below $157.00 or candle low
Targets:
$161.58 (Target 1)
$163.67 (Target 2)
$165.02 (Final Target)

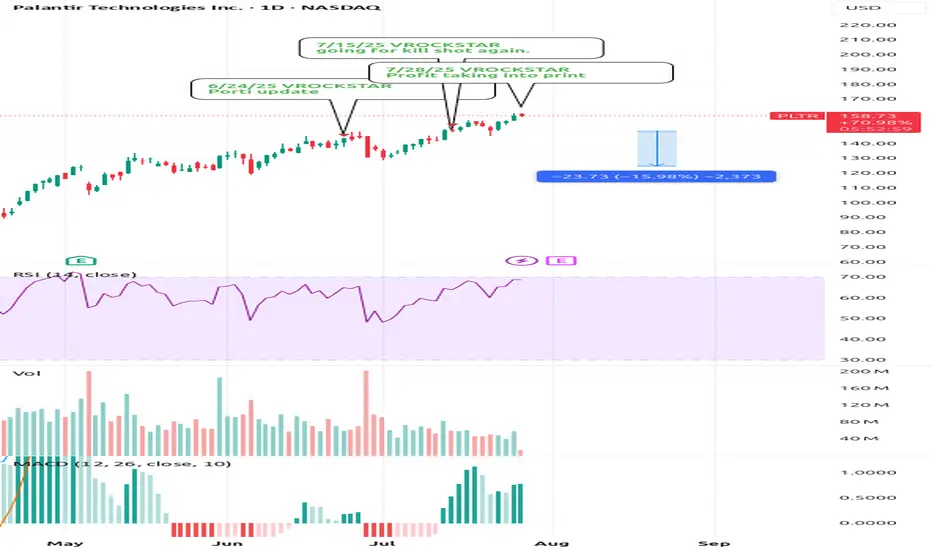
7/28/25 - $pltr - Profit taking into print7/28/25 :: VROCKSTAR :: NASDAQ:PLTR
Profit taking into print
- no idea what print brings
- but mgmt have been sell-only
- valuation is what it is... inexplicable by anyone
- i'd not be surprised to see anything happen on the result
- but into result, big holders (read: not you) are likely going to see some profit taking/ risk mgmt given tape, outperformance
- could be a good hedge against other risk-on
- and if tape does see risk off, -ve gamma/ reflexivity largest here
V
Long Setup for Continued Growth Potential Next WeekCurrent Price: $158.80
Direction: LONG
Targets:
- T1 = $162
- T2 = $166
Stop Levels:
- S1 = $157
- S2 = $153
**Wisdom of Professional Traders:**
This analysis synthesizes insights from thousands of professional traders and market experts, leveraging collective intelligence to identify high-probability trade setups. The wisdom of crowds principle suggests that aggregated market perspectives from experienced professionals often outperform individual forecasts, reducing cognitive biases and highlighting consensus opportunities in Palantir Technologies.
**Key Insights:**
Palantir Technologies has demonstrated remarkable resilience and strong market momentum, reflected in its substantial surge since early-year lows. Significant investor enthusiasm, coupled with robust fundamentals, has propelled the stock to all-time highs, suggesting further upside potential. Traders should monitor key levels at $160 (resistance) and $155 (support) to identify promising entry and profit-taking opportunities. Additionally, consistent earnings growth and strategic partnerships continue to enhance Palantir's attractiveness as a long-term play.
**Recent Performance:**
Palantir closed its last trading session with positive upward momentum, gaining +2.54% and marking a new high close. Its performance outpaces broader indices during the same period, demonstrating technical strength and sustained investor confidence. With steady gains and consistent returns through volatile markets, Palantir remains a compelling trade for growth-oriented investors.
**Expert Analysis:**
Analysts remain cautiously optimistic about Palantir’s near-term trajectory, emphasizing its resilience and growth-driven attributes. Predictions suggest potential sideways movement in the coming sessions, making pullbacks attractive for entry ahead of further bullish momentum. A strong earnings pattern and investor-driven rallies underpin expert calls for sustained upside potential, aligning it with other high-growth equities in the technology space.
**News Impact:**
Recent developments, including key advancements in Palantir's technology initiatives and strategic partnerships, have fueled market enthusiasm. Strong retail interest, coupled with favorable earnings updates, reinforces the stock's position as a favored choice among traders and investors seeking high-growth opportunities. Continued focus on innovation and expansion has added further confidence to Palantir’s trading outlook.
**Trading Recommendation:**
Given Palantir's recent price action, technical strength, and positive growth narrative, a long position is recommended. Monitor pullbacks to support levels for entry opportunities while maintaining stop losses below support at $153 to mitigate downside risk. Holding through potential resistance at $160 could lead to gains toward established targets at $162 and $166.
PLTR is doing it... pullback honeyThis video has my thoughts about PLTR and a trading view tip... the data window!!! Who knew?
Hope the talk inspires you as you decide on future investments; especially when it's stalling or pulling back.
My short term bias is bearish for a pullback on PLTR. Not sure when it will happen, but <155 is my trigger to see what I see.
What do you see?
**>162... slow your roll to see if 160 holds.

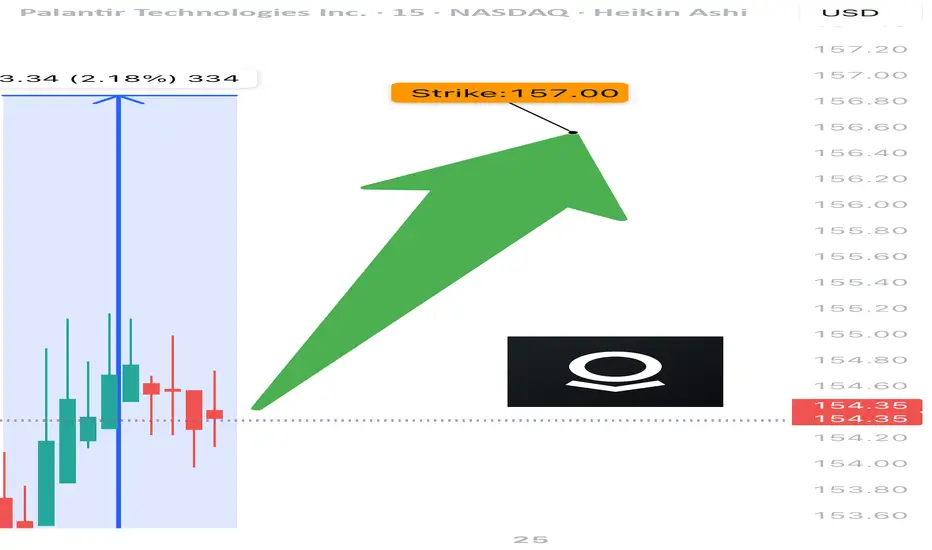
PLTR TRADE SIGNAL (07/24)
🚨 PLTR TRADE SIGNAL (07/24) 🚨
💥 Expiry in 1 day = HIGH GAMMA risk = BIG MOVES coming
🧠 Key Highlights:
• Call/Put Ratio: 1.40 → bullish options flow
• Strong institutional positioning 📈
• RSI cooling off = ⚠️ watch momentum
• Volume concerns → cautiously bullish
💥 TRADE SETUP
🟢 Buy PLTR $157.50 Call exp 7/25
💰 Entry: $0.59
🎯 Target: $0.89 (50%+)
🛑 Stop: $0.24
📈 Confidence: 65%
⚠️ Gamma + Time Decay = explosive but risky. Tight execution needed.
#PLTR #OptionsAlert #OptionsFlow #UnusualOptionsActivity #TechStocks #DayTrading #GammaSqueeze #TradingView #BullishSetup #CallOption
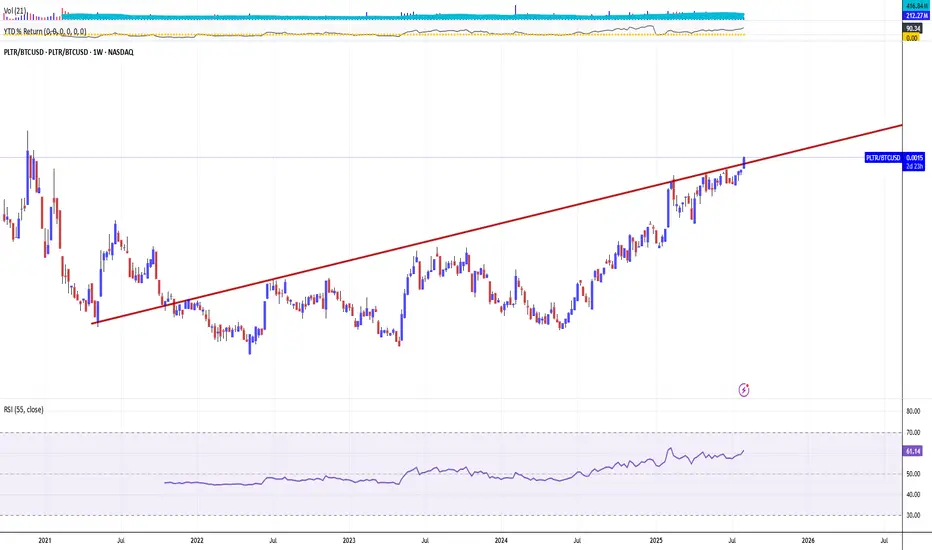
PALANTIR GOES 'BOMBASTIC', DETHRONES JUGGER BITCOIN SUPERIORITYIt's gone less than a year or so since Palantir stock has joined on Friday, September 20, 2024 Stock Top Club, also known as S&P 500 stock index SPX .
Palantir was one of the strongest contenders for inclusion in the broad market S&P500 Index.
This inclusion, as well as Dell (DELL), came after tech companies Super Micro (SMCI) and Crowdstrike (CRWD) also joined the index earlier in the year 2024.
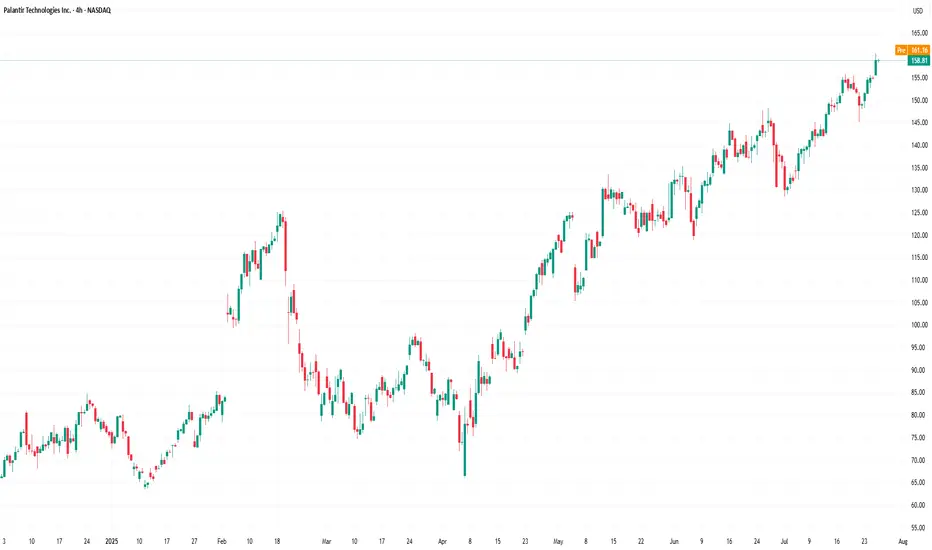
Since that, Palantir stock became the best (i.e. #1) S&P500 index performer the year 2024 and even in nowadays this Jugger remains 'The Best of The Best' over the whole S&P 500 index, with current +127% YTD return in 2025 (and +697% over the past 12 months), being highlighted at 173.29 USD per share - the new all the history peak reached last Wednesday, August 05, 2025 at regular session close.
What is most important also, nor Federal Reserve (The US Central Bank) hawkish projections on monetary policy in 2025, nor bearish were not able to stop the only game in the city, or even make a pause on Palantir leadership.
Since Palantir stock is rallying, the stalkers remain decently far away, swallowing the galactic dust of Palantir shares.
Judge for yourself.
All the nearest pursuers in 2025 are still under 100% YTD return while Bitcoin BITSTAMP:BTCUSD is traded with modest +21% YTD return in 2025.
What is most important also, Palantir stock was able to outperform S&P500 index within 12 (twelve) straight month in a row.
In human words that means, Palantir stock monthly returns (every single month from June 2024 to May 2025) were better against broad market index.
What is Behind this?
On August 4, 2025 Palantir Technologies has announced financial results for the second quarter ended June 30, 2025.
Palantir reported revenue ahead of Wall Street’s expectations in Q2 CY2025, with sales up 48% year on year to $1.00 billion. On top of that, next quarter’s revenue guidance ($1.09 billion at the midpoint) was surprisingly good and 10.5% above what analysts were expecting. Its non-GAAP profit of $0.16 per share was 15.6% above analysts’ consensus estimates.
“The growth rate of our business has accelerated radically, after years of investment on our part and derision by some. The skeptics are admittedly fewer now, having been defanged and bent into a kind of submission. Yet we see no reason to pause, to relent, here.
It has been a steep and upward climb—an ascent that is a reflection of the remarkable confluence of the arrival of language models, the chips necessary to power them, and our software infrastructure, one that allows organizations to tether the power of artificial intelligence to objects and relationships in the real world,” said Alexander C. Karp, Co-Founder and Chief Executive Officer of Palantir Technologies Inc.
Palantir stock Alpha
What is Alpha?
Alpha (a) is a term used in investing to describe an investment's ability to beat (outperform) the market, or its “edge.” Alpha is thus also often referred to as excess return or the abnormal rate of return in relation to a benchmark, or any other asset (even against simple sitting in a cash) when adjusted for risk.
The main graph represents a comparison across Bitcoin and Palantir stocks. Since Palantir outperforms BTC and accelerate right now, so why isn't to continue the play, by staying in a long with Palantir, and finally dethrone "the new oranges" respectively.