Plug Power - possbile breakout ahead - finallytook a litte longer.. but the formation looks good and if this week the US Yields stay lover or fall .. good for the stock market... so RSI is low, MACD is turning around... mid of the year could reach the goal of 75
PLUG trade ideas

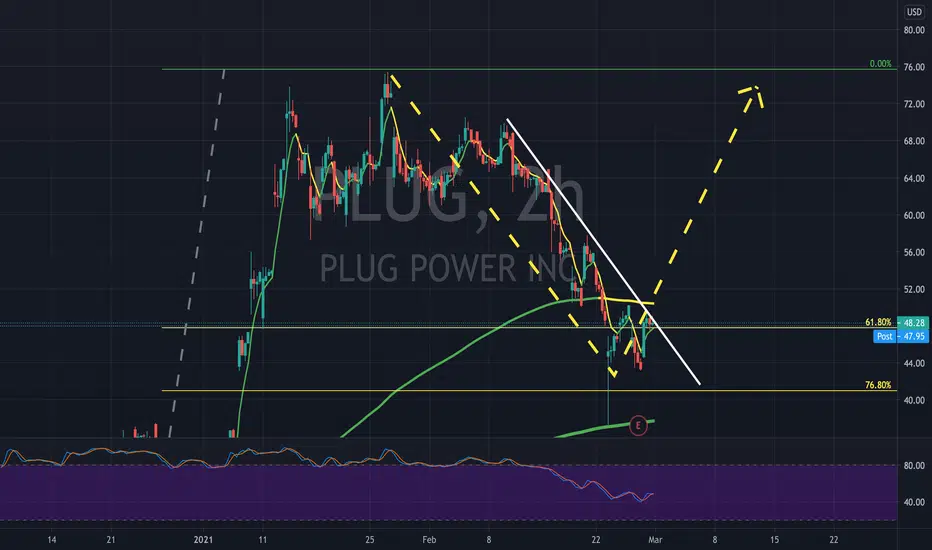
PLUG | ABC correction ongoingHi all,
so PLUG looks like it is currently in wave A of an ABC correction after a blowout top. The overall market is definitely helping with the downside. I'm sure these next few days will flush out a lot of froth in these names.
- Price action broke down below what seemed a potentially bullish rising wedge, which had been forming for almost a month, signifying the start of the correction after the extremely strong move up in January;
- This really feels like it trying to retrace back and fill the huge 37$ - 40$ gap up from early January;
- PLUG's RSI hasn't been this low since March 2020 - should be on the lookout for bullish divergence with price for a turnaround
I am still very bullish on the name, would love to grab more shares ~38$ if I can.
Please comment your thoughts and good luck to all!


PLUG POWERPlug Power is the leading provider of clean hydrogen and zero-emission fuel cell solutions that are both cost-effective and reliable.
Sale?
What do you think?
Like Follow Agree Disagree?
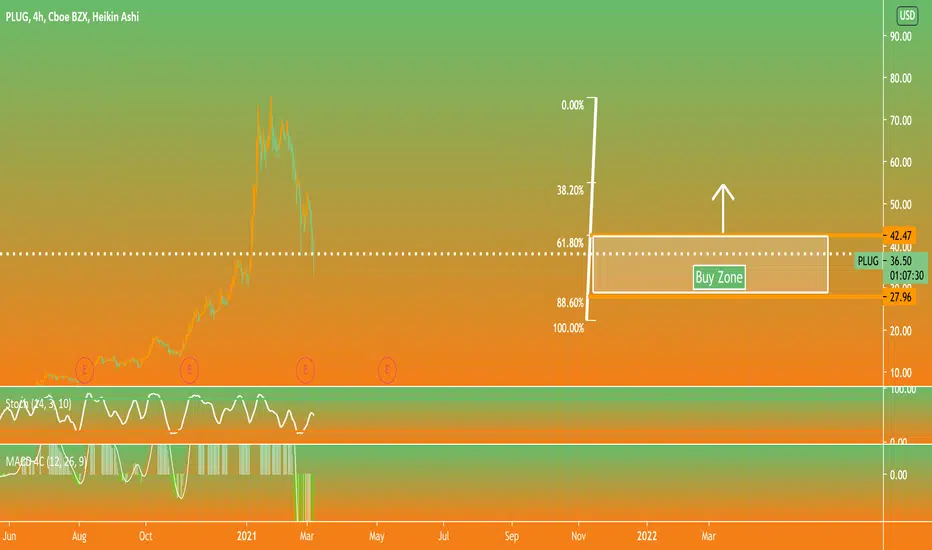

7500% gain in 2 years, what next?The most probable scenario for Plug power could be correction to 31-32 level, if not slipping to 23-25 level..!
There is no bullish sign in daily, weekly, monthly charts!

Bearish Trend on PLUG, Resistance at $50?Alootttaaa stocks are now trending down for some time. Who knows how long this will keep up for. Is this the end of the party for now?
Buy PLUG 40p 3/5
Sell PLUG 52/53c 3/25

PLUG Round DownPLUG is forming a rounding down formation. It is forming the handle of a cup and handle formation as well. It has closed red on the day after testing it's nearby moving averages and looks to be heading back down to the 37 range.

$PLUG 1D Falling Chopsticks break out PLUG has had a massive pull back. Its broken out slightly and I like calls into April at a Price Target if 80. Energy has been hot with Biden.

plug power: are gaps going to start getting filled?This looks scary if we break support. No position, but looking to accumulate
PLUG JPM upgrade.
Possible pump potential!
looks like a temp bottom is in
Buy the dip.
Long over 53
First target 56,
2ND 60
3RD 65

How To: Super simple moving your stop losses in TradingViewVery quick video as a follow up to yesterdays placing orders one.
In this video I show you how crazy simple it is to move your stop losses up within TradingView to protect your profits.
Such an easy to use system. So visual. So cool!
You can trade like this for SHARES, CRYPTO, FOREX and more...
Well done TradingView and TradeStation
Check out how you can sign up to use TradeStation here: www.tradingview.com
And see more award winning brokers here: www.tradingview.com

PLUG long- Elliot wave analysis Completing wave 2. Looking to enter long over $50 for $120 PT. invalidated below $44.


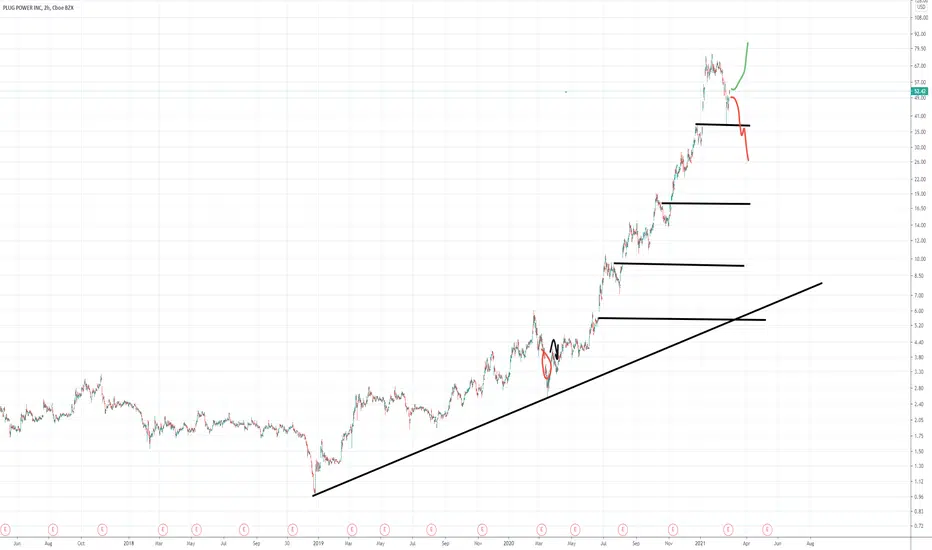
Plug Power - PLUG - Potential 50% gain?Plug Power - PLUG - Potential 50% gain if support holds and trend line broken? Is it time for a rise in price?
PLUG earnings 4th Quarter 2020, 2/25/2021 announcementPlug Power Reports $337 million in Gross Billings for
2020, Up 42.5% Year over Year
Announced Multiple Partnerships and Executed Strategic Acquisitions,
Establishing Global Platform as a Green Hydrogen Solutions Company
Well Positioned to Leverage Industry Leadership and Capture Meaningful
Share of in the $10T Hydrogen Economy
● 2020 marked a record year in gross billings, with Q4 gross billings of $96.3 million and
$337 million for the full year reflecting the Company’s strong value proposition in the
growing hydrogen industry
● As previously announced, reported revenue and results were negatively impacted by
certain costs of $456 million recorded in the fourth quarter, the majority being non-cash
charges related to the accelerated vesting of a customer’s remaining warrants. Given
the expenses for this customer program have been fully expensed, the Company’s goforward reported results should be easier to understand. This resulted in reported
revenue of negative $316 million for the quarter and negative $100 million for the full
year.
● Plan to make continued investment during 2021 to deliver on substantial growth
opportunity in the green hydrogen economy on a global basis
● Strong balance sheet with now over $5 billion in cash to execute on its global growth
strategy and objectives
● On track to deliver on recently raised 2021 and 2024 financial targets
● Added a fourth pedestal customer and selected site for gigafactory to drive scale
● Executed strategic acquisitions of United Hydrogen and Giner ELX positioning Plug
Power as a fully vertically green hydrogen generation company
● Announced global joint ventures and strategic partnerships with Renault, SK Group and
ACCIONA
(source: PLUG quarterly shareholder letter)
Do your own due diligence, your risk is 100% your responsibility. You win some or you learn some. Consider being charitable with some of your profit to help humankind. Small incremental steps work : If you double a penny a day for a month it = $5,368,709. Good luck and happy trading friends...
*3x lucky 7s of trading*
7pt Trading compass:
Price action, entry/exit
Volume average/direction
Trend, patterns, momentum
Newsworthy current events
Revenue
Earnings
Balance sheet
7 Common mistakes:
+5% portfolio trades, risk management
Beware of analysts motives
Emotions & Opinions
FOMO : bad timing
Lack of planning & discipline
Forgetting restraint
Obdurate repetitive errors, no adaptation
7 Important tools:
Trading View app!, Brokerage UI
Accurate indicators & settings
Wide screen monitor/s
Trading log (pencil & graph paper)
Big organized desk
Reading books, playing chess
Sorted watch-list
Checkout my indicators:
Fibonacci VIP - volume
Fibonacci MA7 - price
pi RSI - trend momentum
TTC - trend channel
AlertiT - notification
www.tradingview.com

Plug Power - two possivle routs for Q1Plug Power - two possivle routs for Q1 - depends if it can break out on top or will make a second round to stay in the bullish flag.

Plug Power - updatePlug Power - update - support at 37,30 was there - there is a chance now that we could create a bullish flag n we reach the hights of January again

Bullish hammer with a $10 upswingI'm cautiously optimistic that this has hit its bottom after closing a 42 to 37 gap. I bought in at 40.
The day ended with a bullish hammer, looking for the next couple of days to reveal if this will have a break out.

Crowded TradeEveryone and there mailman has bought in to this one. Looking to go long at around $26.


Markets were tanking, so I went shopping!Given how bad the market was this morning I decided to go shopping :-) - luckily half of my portfolio was in cash after hitting a bunch of stops over the past week or two.
I was able to buy back in after this bounced off of the ~37 mark with the gap between 37 - 43 having been filled. I made my entry at ~40.
I'd like to keep this in my portfolio for a long term investment and it looks like this was my 2nd chance to do that.

Watching PLUGI like PLUG and I'd like to buy back into it, but I think it's a good time to watch and wait. From what I can see there isn't much support between where it is now and a much lower $35 price.
It could reverse and come back up, but there's nothing supporting either case right now.
I'm interested to hear other opinions.
