PYPL Long The 8/3 gap was filled on 2/1 at 89.63 and tested again. The most recent candles have been relatively large and green closing above the .5 fibonacci level.
The 9 EMA crossed the 20 EMA shows the short term trend in rising. OBV confirms the upward movement as it crossed its 13 day ema.
MACD is setting up for a cross and the FI (13), (2) are both recently positive.
Stop: 89.78 (prior low, likely support)
Target: 108.20 (April 22 gap level)
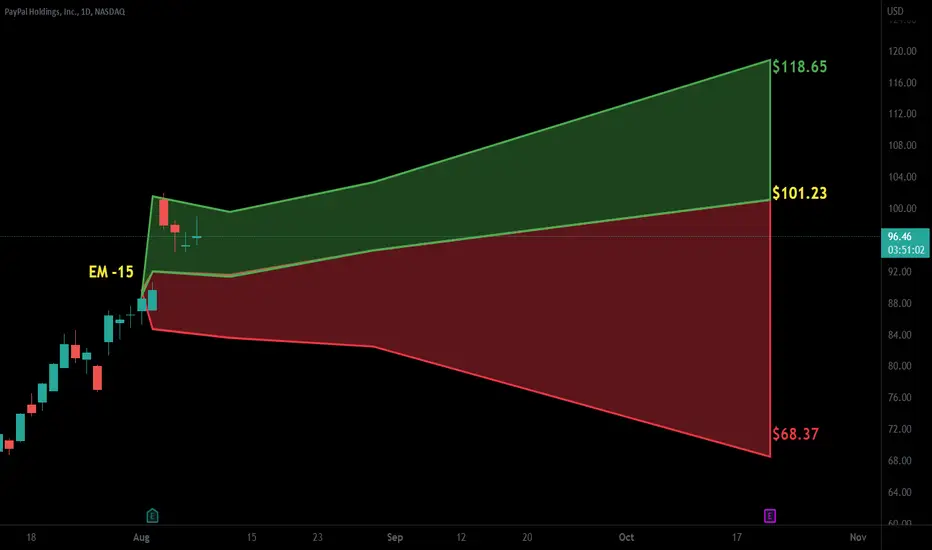
PYPL trade ideas

PaypalThis is an amazing investment, unfortunately, I missed the $70 price point, given the recent growth I don't see how I could be wrong even at $95 dollars, at present the stock market seems very uncertain, which could make for an ideal point of entry. PayPal is a huge brand and is widely considered to be the best at what they do, they had pioneered internet payment. They have recently acquired honey and on many occasions have shown interest in becoming the company that provided the all-in-one shopping experience, all though they have not made their intention clear, it could be argued PayPal may be in the process of creating their own eBay competition, giving light to the eBay payment method, most recently eBay decided to ditch PayPal as their main payment gateway, which could have arisen from some internal dispute this make the PayPal Market place even that more likely.

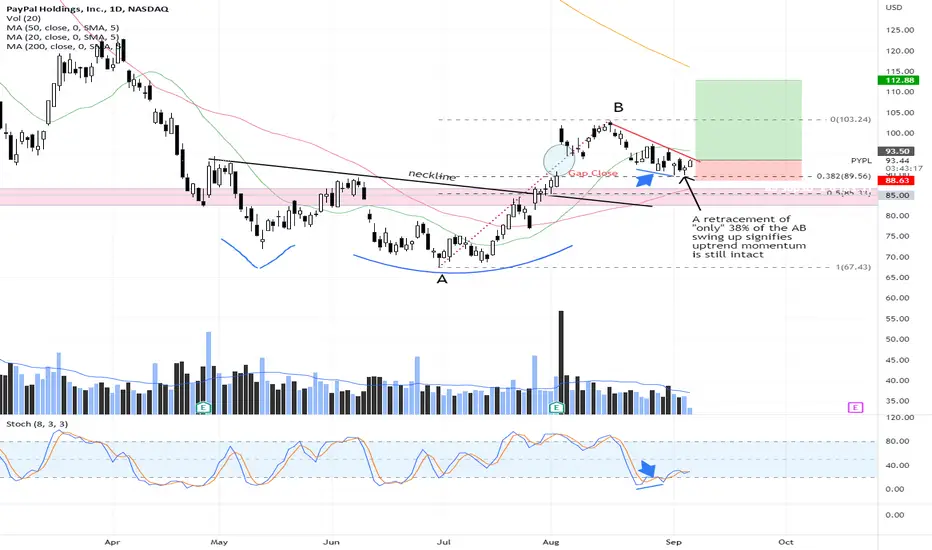
PYPL - bullish divergencePYPL broke out of an Adam & Eve formation on 27 Jul, then gapped up strongly upon Earnings on 3 Aug. Since then, it has retraced about 38% of it's AB swing up and appear to find support @ 90 where the gap is closed.
The stock could be ready to begin another up swing as we are seeing some bullish divergence between price and stochastic. Stops raised to just slightly below $89.
Disclaimer: Just my 2 cents and not a trade advice. Kindly do your own due diligence and trade according to your own risk tolerance and don't forget that money management is important! Take care and Good Luck!
PYPL - Short Position Day 2Update on the short position on PYPL, it has been great. I took profits at 92.99 and 89.93. I have now fully exited my position and will be waiting for other setups. I will be posting my other swing on CHPT and PETZ, which I took overnight yesterday. Regarding PYPL, the gap was fully filled and I feel like waiting for another leg down would be greedy on my part. The market sentiment today helped us achieve the price target and I'm satisfied with the trade. Hopefully, anyone that saw this took it into consideration, the setup was great.

PYPL - Short PositionAfter failing to break above the supply zone around the 95.5 range, and also breaking below the pennant formed, I established a short position on PYPL. My target here is around 92.2 to fill the gap created today. I have established a well-sized position and will be looking from now on, won't be adding as I don't want my cost basis to be affected. This looks like a great setup; however, I have some hedges in place just in case things go south.

PYPL - Earnings Pop Pressure Pot ? 🧐I struggle with the titles here as TV has an interesting take on what is and isn't English...
Anyhow
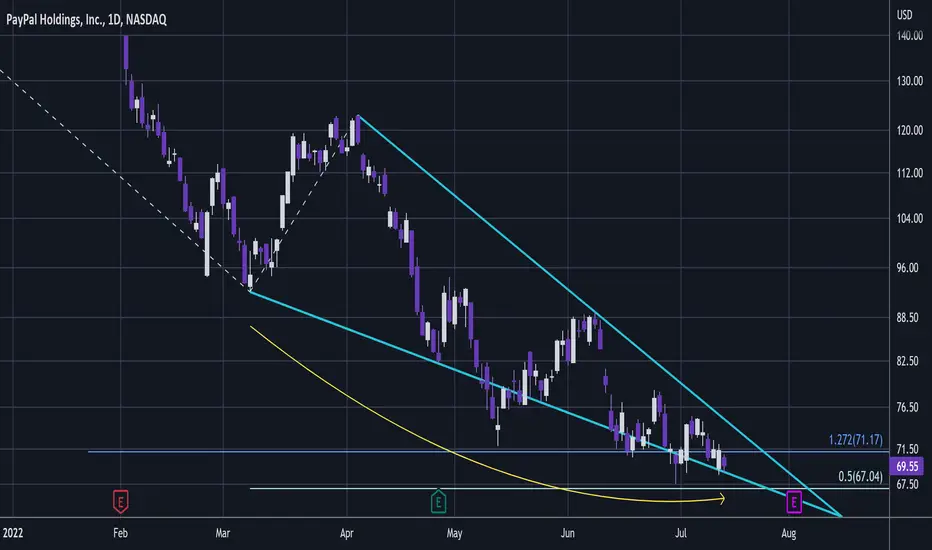
For PYPL I did previously have a target of $55 for it to hit a more obvious 1:1.618 fib extension.
However upon further review it appears that it will be a 1:1.272 (which btw is √1.618). The 1:1.272 seems to occur when there is significant overshoot from the 1:1 and interestingly the NDX also appears to be bottoming at this fib.
PYPL is forming this steep but yet corrective descending channel. When considered with the rest of the trend which was effectively a cliff face it is very choppy in comparison and is drifting sideways. All of which shows that downside momentum is waning.
There are many ways to to draw trendlines but in this instance I have taken the first two significant pivots and this reveals that there has been a lot of downside fakery but yet PYPL has remained above the lower trendline for the majority of the time.
For a tiniest bit more overshoot I think PYPL may hit the 1:0.5 $67 taking the last pivots from the top.
I think very likely this contracting pattern is building strong upside cause and with earnings coming up could see an explosive upside move soon. This will also depend on where indexes are by then and perhaps the move up will come earlier.
Not advice.
Paypal: Pay up for thisPayPal - Short Term - We look to Buy at 89.71 (stop at 84.43)
Broken out of the channel formation to the upside. We have a Gap open at 89.63 from 02/08/2022 to 03/08/2022. We have a 38.2% Fibonacci pullback level of 89.84 from 103.03 to 68.51. Preferred trade is to buy on dips.
Our profit targets will be 116.91 and 152.00
Resistance: 103.03 / 117.20 / 122.92
Support: 89.84 / 80.22 / 76.71
Disclaimer – Saxo Bank Group. Please be reminded – you alone are responsible for your trading – both gains and losses. There is a very high degree of risk involved in trading. The technical analysis, like any and all indicators, strategies, columns, articles and other features accessible on/though this site (including those from Signal Centre) are for informational purposes only and should not be construed as investment advice by you. Such technical analysis are believed to be obtained from sources believed to be reliable, but not warrant their respective completeness or accuracy, or warrant any results from the use of the information. Your use of the technical analysis, as would also your use of any and all mentioned indicators, strategies, columns, articles and all other features, is entirely at your own risk and it is your sole responsibility to evaluate the accuracy, completeness and usefulness (including suitability) of the information. You should assess the risk of any trade with your financial adviser and make your own independent decision(s) regarding any tradable products which may be the subject matter of the technical analysis or any of the said indicators, strategies, columns, articles and all other features.
Please also be reminded that if despite the above, any of the said technical analysis (or any of the said indicators, strategies, columns, articles and other features accessible on/through this site) is found to be advisory or a recommendation; and not merely informational in nature, the same is in any event provided with the intention of being for general circulation and availability only. As such it is not intended to and does not form part of any offer or recommendation directed at you specifically, or have any regard to the investment objectives, financial situation or needs of yourself or any other specific person. Before committing to a trade or investment therefore, please seek advice from a financial or other professional adviser regarding the suitability of the product for you and (where available) read the relevant product offer/description documents, including the risk disclosures. If you do not wish to seek such financial advice, please still exercise your mind and consider carefully whether the product is suitable for you because you alone remain responsible for your trading – both gains and losses.

PYPL_on the Road? (elliot_wave_analysis)hello everyone
This is my first chart of PYPL.
In my opinion, we have now completed wave 1 and hit the fibonacci perfectly.
Wave 2 is expected to end around $81.
I am basically long but there is also a higher probability of a more massive correction.
Like and update follows
peace and out.

PYPL trend reversal?Paypal is in a clear down trend since a long time.
Now we can identify clear chance of character to the upside.
Looking for a buy if it falls in the $89 area with target at the gap $140.

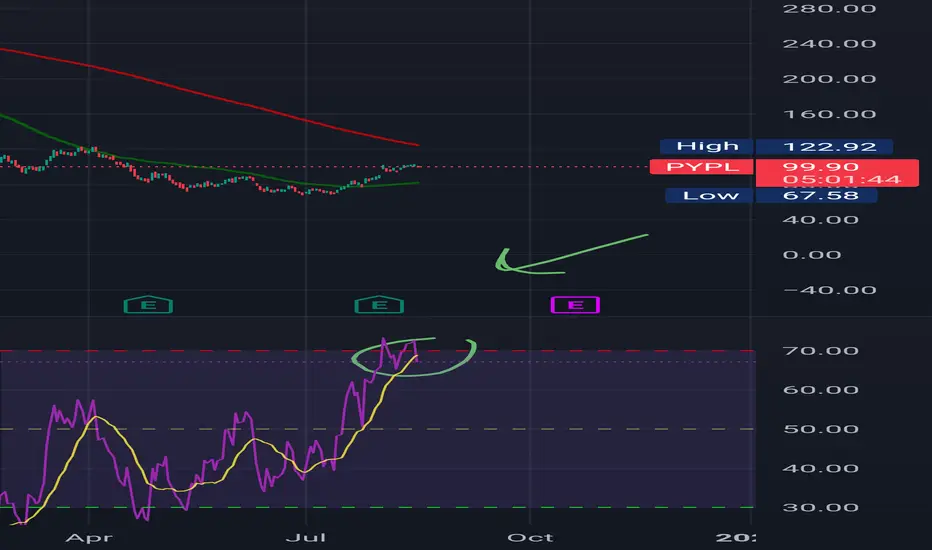
PYPL - Approaching SupportLike many stocks today, PYPL looking to test next support at the 93.5 area. Good for short term entry on EMA21 level and target profit around 100-102 IF this level holds. will look for support and RSI crossover from below 20 to the upside. If fails, could fill down the gap/window to the 90 - 89 area.

Overbought cross up 70 RSI and SPY says the same thing Signaling a pullback.
Buy when RSI crosses below 30 or bounces off it to signal oversold.
These are highly reliable indicators.
Mmm I think I am bearish now but wait is for a couple of days.Not a financial advise.
I see the double top on the hourly chart and the rsi practically dead.
Pump & Dump may be...
I see $PYPL falling to the $90s levels.
Let's see what happens next.

PYPL clearing post ER PM highs and gets an upgrade. PYPL clearing post ER PM highs and gets an upgrade.
Clears 102.6 and holds gets the gap filled! 107-108 area!

nice play for longs recently! 🚀 blasted through previous long trigger, congrats if you caught the move! watching for break of 105.18 for continuation to upside, break below 94.07 for potential shorts

85-90 neartermGap fill down incoming, triple top, expanded flat c incoming, at resistance, wave 5 now needs corrective wave.... all things near-term bearish load puts

PYPL into the 100s. Forget about it.The SP500 runs into some resistance around 4260 to 4300.
Technically above 4200 is my supply zone but from how we are setting up / how far down some of these quality names got dumped
PYPL still has room to run into 112 to 116 this month
This trade is invalid if PYPL cannot hold 93.61 I would not be interested in that move

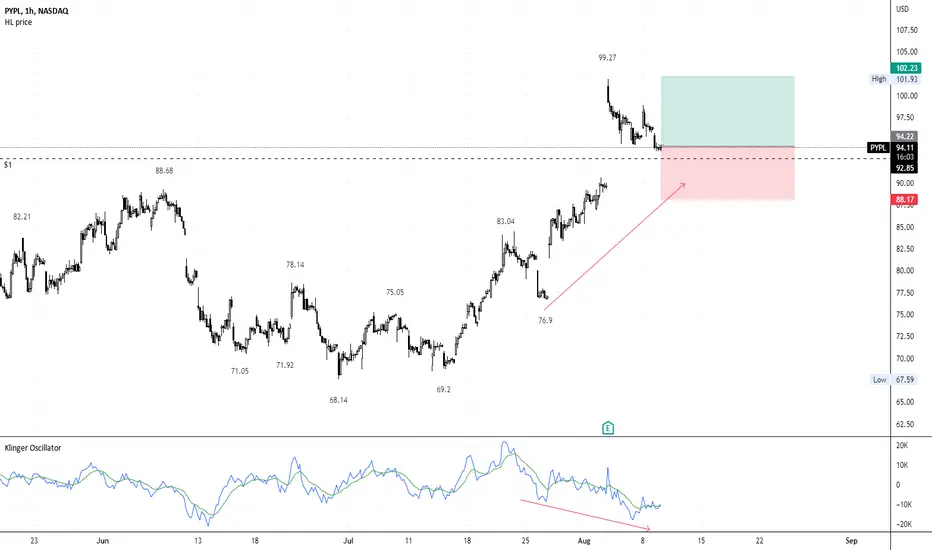
LONG PYPL @94.22 Bullish DivergenceLONG PYPL @94.22
Klinger Oscillator (Bullish Divergence) 1H + 4H
RR1.32
gap support
#week09assignment
$PYPL with a Bullish outlook following its earnings #Stocks The PEAD projected a Bullish outlook for $PYPL after a Positive over reaction following its earnings release placing the stock in drift B with an expected accuracy of 75%.
PYPL - Another opportunity in sight!After a more than welcome earnings rally, we would like to give investors an insight on paypal! NASDAQ:PYPL
In the past, we published several articles about paypal and announced our first acquisition back at 102,87$.
We highlighted our price targets and warned about a possible alternative which would push the price down to at least 70$.
Due to the overall weakness in most tech stocks paypal suffered further losses too and our alternative scenario came true.
However, the last weeks give reason for new optimism and most tech stocks gained double digits.
Furthermore the earnings report of paypal eased the tension most investors are feeling and the confidence in this company seems to return once more.
The immense growth of the covid-19 rally may not return in full strength but the concerns around slower growth is now priced in by the market.
According to our analysis, we expect that a 1-2 setup will form in the next days and will give everyone another opportunity to open further positions.
The chart structure of which this wave 1 consists points towards a bullish structure and formed five clear impulsive waves.
Investors and traders should expect an a-b-c correction to at least 85$ and we will announce further long positions in the marked green zone.
We advise everyone to watch paypal closely in the next few weeks, this effort will certainly be rewarded in the future
Our long-term chart which we published for the first time back in February is still valid and many indicators are recovering or reporting a bullish reversal.
Keep in mind that this chart is heavily simplified and a detailed analysis about every wave count can be found in the analysis above.
Paypal is severely undervalued and we believe that prices below 100$ are very good for accumulating.
Long #1 Paypal (NASDAQ:PYPL)
AVERAGE EXECUTION PRICE: 102.87$
STOP-LOSS: NONE
LONGTERM-TARGET: +200$ / +300$


Why PayPal ( $PYPL) is one of my TOP long call "position trades"Why I like PayPal PYPL
Back to 2017 levels, pretty much "recession proof" (give or take). It's almost God sent being down at these levels (undervalued/fair value). There are some strikes that are def. set up for nicely profitable positions if chosen correctly, common shares as well. Though I hid a lot of my indicators for a simple view, there is def. a divergence between price and RSI on both the Daily & Weekly, as well as the Monthly looking pretty bottomed out. I am pretty big into Harmonic patterns , but am not going to share my "secret sauce", at this current time.
I will continue to add to my position and average down (as planned) into further out strike dates. I as well will MOST LIKELY play the short term trends as well, but my overall goal is to see at least $115.00 with my "position trade" call contracts.
I typically leaves these "ideas" pretty brief on Trading View as I don't really have a BIG following on here
If you have any questions about my "idea" feel free to reach out!
(This is a repost as I had some community violations I was unaware about)

Paypal pumpWith positive Earnings Payapl is already + 10% in after-hours breaking the 92.57 resistance...the retest of this line turned support could be a good entry for a long ap around the 120 $ where there's strong resistance from the 200 MA as well. I would take some profit if you are a trader and not an investor, Also the structure from April till now seems like a bottom to me.

$PYPL for augustTime to enter = Now.
Anything under $85/share is good. Low 80s is even better.
Hold for 30-60 days and sell.
