Learn how to trade EOD / FOD Professional StrategyEOD /FOD is an acronym for End of Day buy or sell short entry that holds overnight and the First of Day sell the ETF or stock at Market Open. This is a strategy for experienced to Elite aka Semi-Professional Traders. Beginners need to hone skills and practice in a simulator.
Professional Traders
Key facts today
Key stats
About INVESCO QQQ TRUST QQQ USD DIS
Home page
Inception date
Mar 10, 1999
Structure
Unit Investment Trust
Replication method
Physical
Dividend treatment
Distributes
Distribution tax treatment
Qualified dividends
Income tax type
Capital Gains
Max ST capital gains rate
39.60%
Max LT capital gains rate
20.00%
Primary advisor
Invesco Capital Management LLC
Distributor
Invesco Distributors, Inc.
QQQ is one of the most established and actively traded ETFs in the world, albeit one of the most unusual. The product is one of a few ETFs structured as a unit investment trust. Per the rules of its index, the fund only invests in nonfinancial stocks listed on NASDAQ, and effectively ignores other sectors too, causing it to skew massively away from a broad-based large-cap portfolio. QQQ has huge tech exposure, but it is not a 'tech fund' in the pure sense either. The fund's arcane weighting rules further distance it from anything close to plain vanilla large-cap or pure-play tech coverage. The ETF is much more concentrated in its top holdings and is more volatile than our vanilla large-cap benchmark. Still, the fund has huge name recognition for the underlying index, the NASDAQ-100. In all, QQQ delivers a quirky but wildly popular mash-up of tech, growth, and large-cap exposure. The fund and index are rebalanced quarterly and reconstituted annually.
Related funds
Classification
What's in the fund
Exposure type
Technology Services
Electronic Technology
Retail Trade
Stock breakdown by region
Top 10 holdings

long term short on QQQ level $501 and 465there some level i would like to to look for on QQQ$
Main target is level $465- 495 -$ 501
Disclaimer- it a opinion

Triple Top on QQQAs I said some the same things for the S&P 500 . here we have QQQ . Repeating this pattern staying In this box for some time now. investment accounts , 401ks, real estate , etc etc. I see all accross the board people buying almost everything at very high prices. With no in dept look . lets try and m

Nasdaq 100 (QQQ) Affirms Bullish Outlook with Five Wave RallyThe Nasdaq 100 ETF (QQQ) has continued its upward trajectory, confirming a five-wave Elliott Wave structure originating from the April 7, 2025 low. This development solidifies a bullish market outlook and eliminates the possibility of a double correction scenario. Starting from the April 7 low, wave

Stock Market Forecast | TSLA NVDA AAPL AMZN META MSFTStock Market Forecast | !nq1! !es1! SPY QQQ
Mag 7 Forecast | NASDAQ:TSLA NASDAQ:NVDA AAPL AMZN META MSFT GOOG

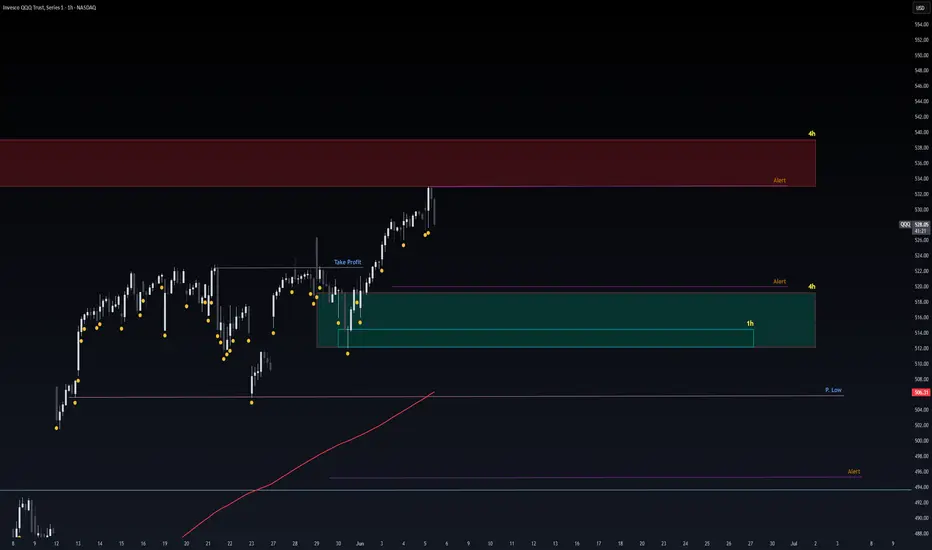
Safe Entry Zoneafter Rejection from the Resistance 4h Red Zone.
we have 4h and 1h Green Zone as Strong Support levels.
Note: Potentional of Strong Buying Zone:
We have two scenarios must happen at The Mentioned Zone:
Scenarios One: strong buying volume with reversal Candle.
Scenarios Two: Fake Break-Out of The
QQQ: All-Time High Resistance vs. Strong Trendline Support• Approaching All-Time High Resistance: QQQ is currently trading directly beneath its all-time high of $541 and is encountering a robust overhead resistance zone, indicating a critical test for bullish momentum.
• Strong Ascending Trendline Support: The price action is consistently supported by a we


QQQ Potential *Short Term Bearish SetupAfter studying the HTF here is what I am seeing as a potential setup forming.
We formed a HTF MSS on the 4H close to ATH leaving an epic equal high to come back to later. I am looking for a candle body closures *BELOW lows to confirm as we leave the MSS yellow zone and head to TP1 (-1). Once we ap

QQQ Put level 513 The main reason it has been two regetetion on two levels it on a down trend for short term.
And with the wars that is Happening and the market are closed on thursday we dont know what is going to happend friday.

See all ideas
Summarizing what the indicators are suggesting.
Oscillators
Neutral
SellBuy
Strong sellStrong buy
Strong sellSellNeutralBuyStrong buy
Oscillators
Neutral
SellBuy
Strong sellStrong buy
Strong sellSellNeutralBuyStrong buy
Summary
Neutral
SellBuy
Strong sellStrong buy
Strong sellSellNeutralBuyStrong buy
Summary
Neutral
SellBuy
Strong sellStrong buy
Strong sellSellNeutralBuyStrong buy
Summary
Neutral
SellBuy
Strong sellStrong buy
Strong sellSellNeutralBuyStrong buy
Moving Averages
Neutral
SellBuy
Strong sellStrong buy
Strong sellSellNeutralBuyStrong buy
Moving Averages
Neutral
SellBuy
Strong sellStrong buy
Strong sellSellNeutralBuyStrong buy
Displays a symbol's price movements over previous years to identify recurring trends.
Frequently Asked Questions
An exchange-traded fund (ETF) is a collection of assets (stocks, bonds, commodities, etc.) that track an underlying index and can be bought on an exchange like individual stocks.
QQQ trades at 10,320.000 MXN today, its price has risen 0.27% in the past 24 hours. Track more dynamics on QQQ price chart.
QQQ net asset value is 10,323.93 today — it's risen 5.29% over the past month. NAV represents the total value of the fund's assets less liabilities and serves as a gauge of the fund's performance.
QQQ assets under management is 6.56 T MXN. AUM is an important metric as it reflects the fund's size and can serve as a gauge of how successful the fund is in attracting investors, which, in its turn, can influence decision-making.
QQQ price has risen by 2.57% over the last month, and its yearly performance shows a 16.48% increase. See more dynamics on QQQ price chart.
NAV returns, another gauge of an ETF dynamics, have risen by 5.29% over the last month, showed a 8.04% increase in three-month performance and has increased by 19.33% in a year.
NAV returns, another gauge of an ETF dynamics, have risen by 5.29% over the last month, showed a 8.04% increase in three-month performance and has increased by 19.33% in a year.
QQQ fund flows account for 493.15 B MXN (1 year). Many traders use this metric to get insight into investors' sentiment and evaluate whether it's time to buy or sell the fund.
Since ETFs work like an individual stock, they can be bought and sold on exchanges (e.g. NASDAQ, NYSE, EURONEXT). As it happens with stocks, you need to select a brokerage to access trading. Explore our list of available brokers to find the one to help execute your strategies. Don't forget to do your research before getting to trading. Explore ETFs metrics in our ETF screener to find a reliable opportunity.
QQQ invests in stocks. See more details in our Analysis section.
QQQ expense ratio is 0.20%. It's an important metric for helping traders understand the fund's operating costs relative to assets and how expensive it would be to hold the fund.
No, QQQ isn't leveraged, meaning it doesn't use borrowings or financial derivatives to magnify the performance of the underlying assets or index it follows.
In some ways, ETFs are safe investments, but in a broader sense, they're not safer than any other asset, so it's crucial to analyze a fund before investing. But if your research gives a vague answer, you can always refer to technical analysis.
Today, QQQ technical analysis shows the buy rating and its 1-week rating is strong buy. Since market conditions are prone to changes, it's worth looking a bit further into the future — according to the 1-month rating QQQ shows the buy signal. See more of QQQ technicals for a more comprehensive analysis.
Today, QQQ technical analysis shows the buy rating and its 1-week rating is strong buy. Since market conditions are prone to changes, it's worth looking a bit further into the future — according to the 1-month rating QQQ shows the buy signal. See more of QQQ technicals for a more comprehensive analysis.
Yes, QQQ pays dividends to its holders with the dividend yield of 0.52%.
QQQ trades at a premium (0.26%).
Premium/discount to NAV expresses the difference between the ETF’s price and its NAV value. A positive percentage indicates a premium, meaning the ETF trades at a higher price than the calculated NAV. Conversely, a negative percentage indicates a discount, suggesting the ETF trades at a lower price than NAV.
Premium/discount to NAV expresses the difference between the ETF’s price and its NAV value. A positive percentage indicates a premium, meaning the ETF trades at a higher price than the calculated NAV. Conversely, a negative percentage indicates a discount, suggesting the ETF trades at a lower price than NAV.
QQQ shares are issued by Invesco Ltd.
QQQ follows the NASDAQ 100 Index. ETFs usually track some benchmark seeking to replicate its performance and guide asset selection and objectives.
The fund started trading on Mar 10, 1999.
The fund's management style is passive, meaning it's aiming to replicate the performance of the underlying index by holding assets in the same proportions as the index. The goal is to match the index's returns.