QQQ: Short Trading Opportunity
QQQ
- Classic bearish pattern
- Our team expects retracement
SUGGESTED TRADE:
Swing Trade
Sell QQQ
Entry - 451.77
Stop - 460.12
Take - 437.86
Our Risk - 1%
Start protection of your profits from lower levels
❤️ Please, support our work with like & comment! ❤️
QQQ trade ideas

QQQ Set To Fall! SELL!
My dear followers,
I analysed this chart on QQQ and concluded the following:
The market is trading on 451.77 pivot level.
Bias - Bearish
Technical Indicators: Both Super Trend & Pivot HL indicate a highly probable Bearish continuation.
Target - 440.08
Safe Stop Loss - 458.64
About Used Indicators:
A super-trend indicator is plotted on either above or below the closing price to signal a buy or sell. The indicator changes color, based on whether or not you should be buying. If the super-trend indicator moves below the closing price, the indicator turns green, and it signals an entry point or points to buy.
———————————
WISH YOU ALL LUCK

QQQ Double Top on Bearish DivergenceIf you haven`t bought the dip on QQQ:
Then it's important to understand that it's currently exhibiting a double top formation, known as one of the most bearish chart patterns, along with a substantial bearish divergence. I foresee a retracement soon, possibly to $416, but I still expect it to finish the year on a positive note!

QQQ Potential Paths Moving ForwardQQQ made a new ATH today and may close even higher. I think it will run up until it retests its ascending channel from earlier in the year.

$NASDAQ terminal upside phase SKILLING:US100 is reaching the extreme point in the market and levels indicated in the video are important

Resistance Support & RSIThe entry point for buying QQQ stock at the price indicated in the image can be followed, with both entry and profit-taking points provided.

QQQ 1hr - Stalling at Major ResistanceQQQ was looking great on Friday morning, it finally managed to break out above its bear flag and a downtrend it had been in since April. Unfortunately for bulls, it quickly rejected after consumer sentiment was released. Having a fakeout like this will usually lead to a larger move in the opposite direction, but I need to see more confirmation. I'll be looking for VX strength/weakness and will see if QQQ can gap back above these trendlines or if we're heading back down. We should get a bigger move by the end of the week and could have some great opportunities on retests, but I'm proceeding with caution until after CPI.

QQQ: Short Trade Explained
QQQ
- Classic bearish pattern
- Our team expects retracement
SUGGESTED TRADE:
Swing Trade
Sell QQQ
Entry - 442.04
Stop - 447.89
Take - 432.43
Our Risk - 1%
Start protection of your profits from lower levels
❤️ Please, support our work with like & comment! ❤️

QQQ What Next? SELL
My dear subscribers,
This is my opinion on the QQQ next move:
The instrument tests an important psychological level 442.04
Bias - Bearish
Technical Indicators: Supper Trend gives a precise Bearish signal, while Pivot Point HL predicts price changes and potential reversals in the market.
Target - 433.35
About Used Indicators:
On the subsequent day, trading above the pivot point is thought to indicate ongoing bullish sentiment, while trading below the pivot point indicates bearish sentiment.
———————————
WISH YOU ALL LUCK

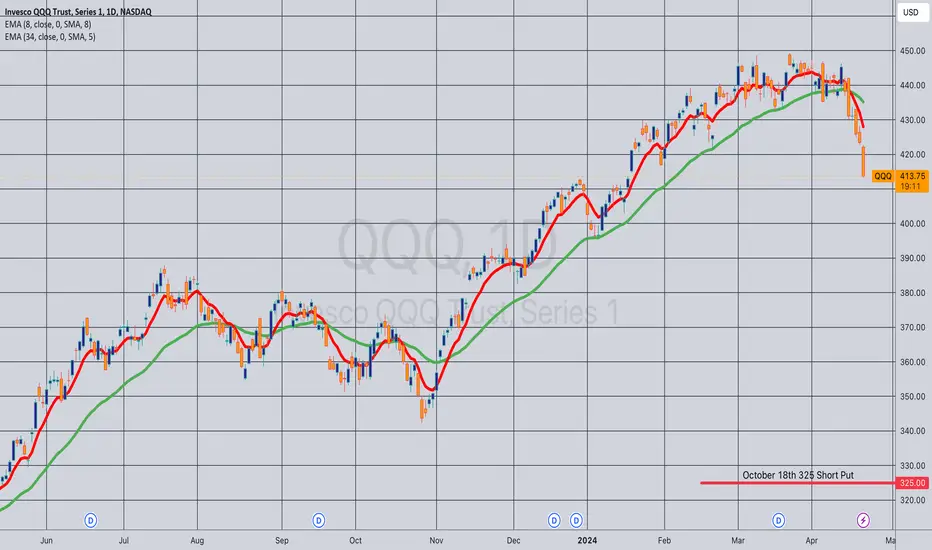
Opening (IRA): QQQ October 18th 325 Short Put... for a 3.52 credit.
Comments: Adding a rung out in Q4 here with QQQ IVR at 81.0, targeting the <16 delta strike paying around 1% of the strike price in credit.
Will generally look to manage shorter duration rungs as I come to them ... .
5/10/24 - MEGA SHORT time sensitive - $jets $qqq $soxl $vixydo yourself a favor and look into this incoming CME from the sun.
youtu.be/9QCA3jouCKk - it's a short video WATCH IT NOW
6 or 7 earth bound flares that each have the capacity to f things up massively.
the reason this matters is it's a DOWN ONLY situation. the market doesn't know about this (clearly) so any non-event doesn't move the market "back up". many sources i look at suggest the deep negative event is 10%. could be higher for a disruptive event 20-30%.
EVEN IN a 10% disruption event, the market is looking very weak ON IT'S OWN and awaiting a pin. the flip flop from economic data is a DISTRACTION from something like this that trumps all...
jets - GROUNDED. FEAR. LEVERAGED. THEY GET DUMPED FIRST.
qqq - the richest valuations and the most affected by EMP style pain
soxl - the sector within the q's that is even more heady but doesn't have any 'pin' bc ai is strong narrative (i subscribe to this btw, but ST it's run hard)
vixy (go long not short like the above) - 0dte's have basically replaced the need to buy short term vol. HOWEVER the scenario where this gets disrupted is a CAN'T SEE THRU scenario - of which "this" is one of those
PLEASE post comments and let's discuss this. it's perhaps the most EV positive trade i've ever seen even if the scenario is a 10% one. i believe it's foolish not to participate in this and/or hedge responsibly. ignore this at your peril and flip the coins. but really - don't. let's help each other stay safe fam.

May 9: Is this just a relief rally?How we close the end of this week is decisive. Is this just the relief rally like what we had in Sept 6, 2023 which only bottomed on Oct 26, 2023. Do you see any difference between these two rallies? NASDAQ:QQQ

bullish continuation to ATH's or HNS REVERSAL?Rally after FOMC gives some life back to the bulls. Tuesday's failure to close outside of Mondays range (failed break out) is signaling a possible retracement to the Low of the week (LOW). if we get that pullback a nice gap down on Thursday could signal a bear trap, if we gap up on Friday. Personally, looking for that set up to start the advance to ATH's
On the flip side there is a potential for a head and shoulders type pattern that could signal a reversal and continue down. Let see what story price will tell! #Ifthis,Thenthis

QQQ Bear Flag (Potential Correct Start)Classic trend reversal retracement
-Bear flag directly into one of the last imbalances (on 30m timeframe)
- Breakdown to 393 area very possible in the next month or two
- ~10% drop from current levels, would put QQQ squarely in correction territory
- Upside is that 393 area looks to be a very strong (and fresh) support

QQQ Scalping Zones 5/7Upside Targets:
* 442.24/443.81/445.56
Downside Targets:
*440.79/439.3/437.26
Daily Trend Tracker -
*QQQ+ *DXY- *VIX- *US10Y+


Opening (IRA): QQQ August 16th 380 Short Put... for a 4.00 credit.
Comments: Starting to round out my Q3 rungs here on weakness and higher IV, targeting the <16 delta strike paying around 1% of the strike price in credit to emulate dollar cost averaging into the broad market.

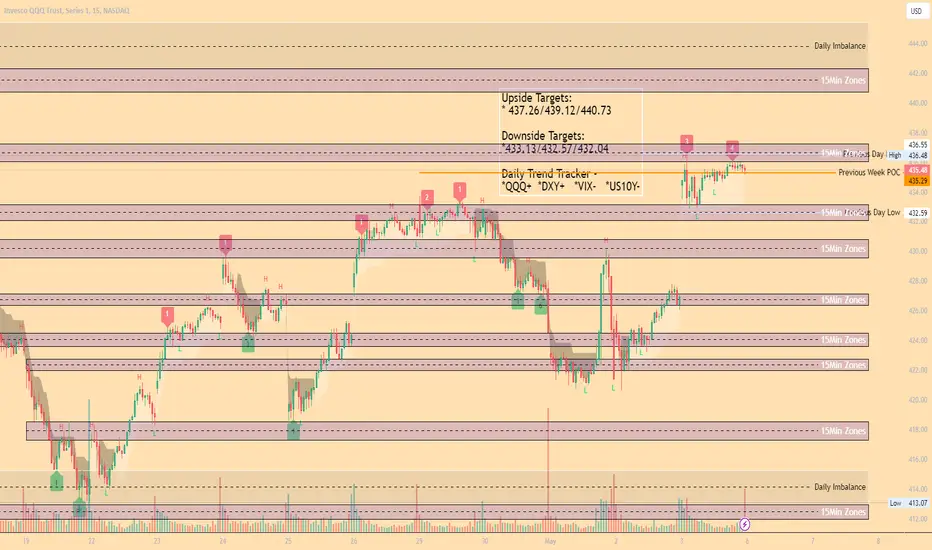
QQQ Scalping Zones 5/6Upside Targets:
* 437.26/439.12/440.73
Downside Targets:
*433.13/432.57/432.04
Daily Trend Tracker -
*QQQ+ *DXY+ *VIX- *US10Y-
QQQ: Bearish Continuation is Highly Probable! Here is Why:
The charts are full of distraction, disturbance and are a graveyard of fear and greed which shall not cloud our judgement on the current state of affairs in the QQQ pair price action which suggests a high likelihood of a coming move down.
❤️ Please, support our work with like & comment! ❤️

QQQ Buyers In Panic! SELL!
My dear friends,
Please, find my technical outlook for QQQ below:
The instrument tests an important psychological level 435.48
Bias - Bearish
Technical Indicators: Supper Trend gives a precise Bearish signal, while Pivot Point HL predicts price changes and potential reversals in the market.
Target - 429.45
About Used Indicators:
Super-trend indicator is more useful in trending markets where there are clear uptrends and downtrends in price.
———————————
WISH YOU ALL LUCK

QQQ Under Pressure! SELL!
My dear subscribers,
My technical analysis for QQQ is below:
The price is coiling around a solid key level - 431.06
Bias - Bearish
Technical Indicators: Pivot Points Low anticipates a potential price reversal.
Super trend shows a clear sell, giving a perfect indicators' convergence.
Goal - 423.50
About Used Indicators:
By the very nature of the supertrend indicator, it offers firm support and resistance levels for traders to enter and exit trades. Additionally, it also provides signals for setting stop losses
———————————
WISH YOU ALL LUCK

QQQ pull back done or another leg down?QQQ had a bad week last week after trying since February to break long term resistance of the Blue trading channel. There was a lot of momentum but ultimately after being squeezed between resistance of the blue channel and support from black channel midline, it was time to take profit for the big guys. Clearly, inflation readings and uncertainty about interest rate cuts were the main factors.
A hard sell off last week to establish a clear down channel with the biggest selling on Friday. Using the channel from August to November last year and with some minor tweaks, you can see that it ended Friday right on the support line.
Another thing I was looking at were several of the most recent pullbacks over the last few years. You can see them overlayed on the peak of March 21st. Going by them, QQQ has already come close to extent of the smaller pullbacks.
In my limited experience, these two indicators are usually a good sign for a rebound this week. The RSI is also in the oversold range and in line with other bottoms. The rebound could just be a short-term rally in the down channel like back in Aug and Sept last year with another leg down in the coming month or so. Or we could see a new attempt to break out of the blue channel.
Either way, I was brave enough to open a few positions Friday before the close. Hopefully I don't regret that.

QQQ coming into huge resistance🍿Price target near 424NASDAQ:QQQ coming into huge resistance🍿
Price target near 424
Would you be shorting into resistance?
Will it get reject at resistance or breakout?
