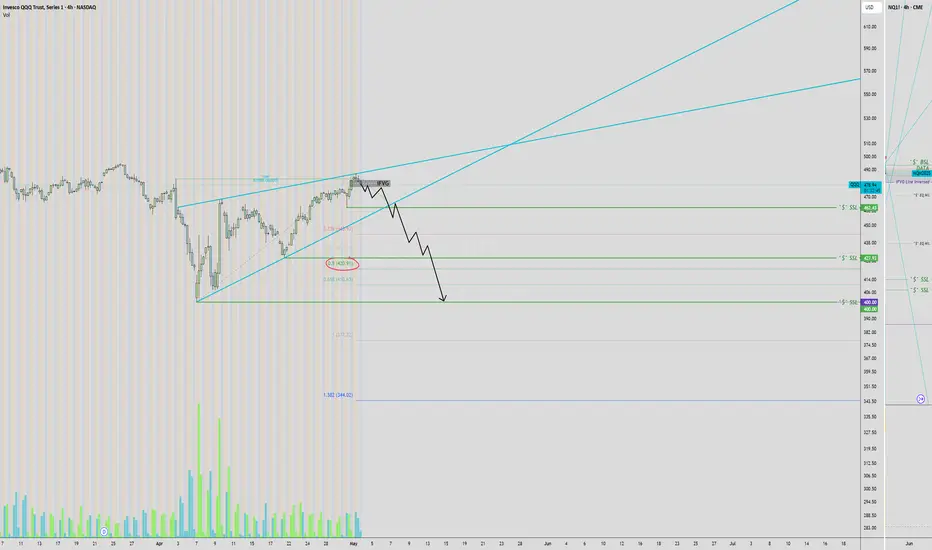
More potential downsideEveryone is picking bottoms that is dangerous in this environment, this chart is Elliott wave we are at the top of the b-wave and it is considered a bull trap but we could get a v shape and may not get follow through in which case the b-wave becomes a new wave 5. It could go either wave but my bias is we get follow through to the downside but its just an opinion you have to due whats best for you.
QQQ trade ideas

SPY QQQ NQ/ES 2 Mayo 2025QQQ Technical and Options Flow Analysis
Timeframe: 15-minute chart
Source: SpotGamma Levels & Custom Volume Profile Zones
🔺 Key Resistance Levels (Potential Sell/Target Zones):
Zone Price Remarks
Call Wall (2) 490.00 Major resistance — target area for calls
High of May 2nd 487.44 Short-term intraday resistance
Call Wall (1) 485.00 Intermediate resistance and sell zone
RB Head 484.31 Breakdown area — if rejected, expect downside
🔻 Key Support Levels (Potential Buy Zones):
Zone Price Remarks
Call Wall (3) / Put Wall (2) 480.00 Key pivot zone — watch for defense or breakdown
RB Bottom 481.13 Breakdown support from prior rejection zone
Put Wall (1) 475.00 Strong put support — primary buying interest
Zero Gamma 477.00 Gamma pivot point — volatility may spike near it


QQQ PUTSI’m short NASDAQ:QQQ 👇 based on NQ, obv...
Anticipating a 2022-style ICT iFVG bearish model. Front-running the setup w/ GDP shrinkage narrative (real or not, price moves on perception).
Targeting $420 → sub-$400, making macro lower lows. I have targets.
Sounds nuts? Maybe. But when we get there… I’m very long. 📉📈
SPY/QQQ NQ/ES 1 Mayo 2025Key Analysis – QQQ (May 1st, 2025)
📍 Current Price Context
Price is currently around 484.75 after a strong upward move.
Trading near a Call Wall at 482 and a potential Rejection Block Head at 484.72.
🔼 Upside Targets (Bullish Scenario)
📈 Level 🎯 Target Description NQ Equivalent
1 482 – Call Wall 19920
2 484.72 – RB Head 20040
3 489.3 – Target Resistance 20220
4 494 – Strong Sell Zone 20400
🟩 "Possible Sell Zone" is clearly marked between 489–494, indicating potential profit-taking or reversals.
🔽 Downside Targets (Bearish Scenario)
📉 Level 🔻 Target Description NQ Equivalent
1 479 – Call Wall 19780
2 476/475 – Gamma Cluster 19660/19620
3 472 – Put Wall —
4 470/471 – Strong Gamma Line 19420/19460
5 466.28 – Extreme Bear Target 19280
🟩 "Possible Buy Zone" around 470–474, reinforced by the Zero Gamma Line at 471, is where strong bounce reactions may occur.
🔄 Strategic Zones (For Entry/Exit)
🟨 Neutral Zones (Buy/Sell Opportunity):
479 (Decision level based on flow)
484 (retest or breakout area)
🟩 Strong Demand Zone:
Between 470 and 472 – Strong gamma support + Put Walls
🟥 Strong Supply Zone:
Between 489 and 494 – High concentration of call options and projected resistance
🔀 Expected Scenarios
Bullish Breakout: If price holds above 484.72 → potential path toward 489.3 → 494.
Rejection at 484–485: Pullback to 479 → watch reaction near 476–472 for potential bounce.
Bearish Breakdown: Below 472, potential retest of 470/466 area.

QQQ Rallying Into ResistanceQQQ Rallying Into Resistance — What’s Next After the Trump Roundtable?
I’ve been going through QQQ charts tonight and comparing the Daily and 1H timeframes side by side to map out what might come next — especially after the afternoon rally that aligned with headlines from Trump’s investor roundtable. It definitely caught attention.
Daily Chart Thoughts:
QQQ has been trending upward within a falling wedge since early April, and today’s candle closed just under the wedge resistance zone around 475–476. That level lines up with previous support-turned-resistance from March. The MACD is still pushing bullish momentum, and the Stoch RSI is cruising near overbought — signaling strength but caution at this zone. If we break above and hold, the next level I’m eyeing is the 493.50 zone. That would officially flip structure bullish.
1H + GEX Layer:
On the intraday side, today’s session really ramped after 2PM — notably when headlines about Trump’s meeting with tech and AI executives hit the wires. That sharp spike landed QQQ right into the GEX7 and GEX9 clusters, just under the 482.50 high. The Options GEX chart shows the 482 area also has 80%+ call resistance and clustering near key Gamma Walls.
Also worth noting: the options positioning is still heavy on puts (64.2%), which tells me this could be a squeeze if bulls defend the breakout above 473–475. If bulls can flip that gamma resistance at 482, we may start working toward 493 or even 500 this week — especially if the macro or political narrative continues to drive risk-on.
How I'm Thinking About the Trade:
I’m personally watching for a pullback retest of 475 or even 472. If we hold VWAP and start climbing back into the GEX zone, I’ll look to enter calls with tight stops. If this stalls under 482 and IV spikes, I’d consider selling premium or waiting for a deeper dip to reload.
Big Picture Forecast:
The Trump meeting gave bulls a jolt today, but whether that sticks will depend on follow-through volume tomorrow. If this is more than a headline pop, the Daily breakout could legitimize a broader tech rally — especially with Apple and NVDA also pushing.
Disclaimer: This is not financial advice. Just my personal market notes and trade planning shared for educational purposes.

Don't be terrified/tarrified !!! It's time to go LONG not SHORT9th April is a crucial day , imo of viewing this chart.
He was not bluffing the people as it turns out. However, after a week, the market got terrified and heads south but noticed it did not formed a lower low from 9th April candle.
25th April candle tells us it has breaks out from the resistance level and the last two days have been pretty bullish as well.
I believe the media is getting fatigue of the tariffs matter and we can see that US and China are behind the curtains "negotiating" while leaving the market guessing who really called who. That was the decoy and it is not important other than face saving. More importantly, the chart has once again convinced us that the buyers are encouraged and prove their actions by longing the market.
So whose buying ? Cathy Woods
Could the price action reverse ? Of course, though I think the probability is not high. Hedge funds are already queuing to buy bank shares based on favourable Q1 results , a positive sign.
As usual, please DYODD

$QQQ Inverse H&S ready to GO!NASDAQ:QQQ
We’ve spotted an Inverse Head & Shoulders breakout on the 1-hour chart, and we’re currently in the retest phase.
- Measured Move (MM): $483.55
- Measured Timeframe (MT): May 1st @ 7 PM
Let’s see if we can maintain momentum tomorrow and steer clear of any unexpected news or market shocks tonight.
Not financial advice

QQQ retests the 50 DMAQQQ is retesting its 50 day average will we go back to the 200 does the bullmarket continue will the fed bend the knee on rates will tariffs hurt ? find out next

See a pattern??With both highlighted spots we see massive panic and then a quick rebound, I think a simmlar thing could happen here, with the current one.

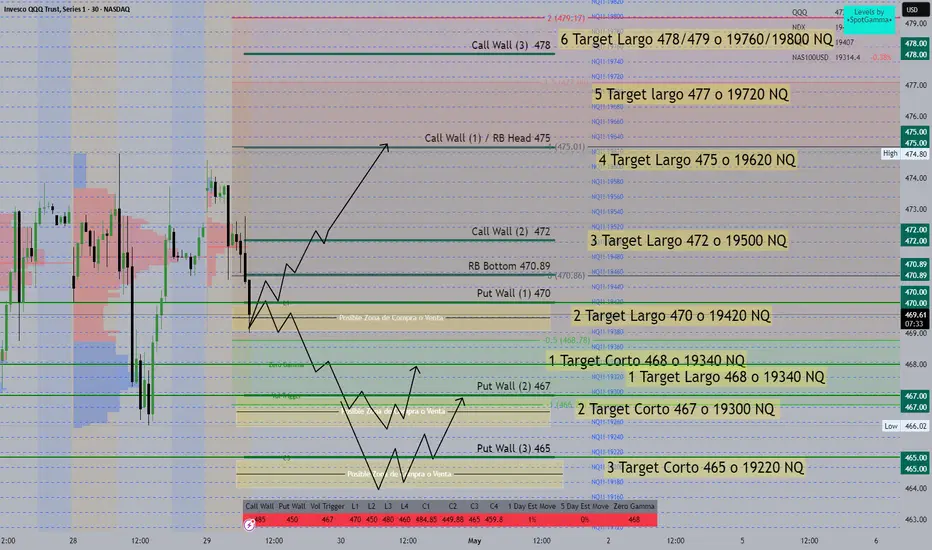
SPY/QQQ NQ/ES 29 de Abril 2025Market Outlook (QQQ / NQ Analysis)
📅 Date: April 29, 2025
🕰 Timeframe: 30-minute
📈 Asset: Invesco QQQ Trust (NASDAQ: QQQ) / NQ Futures
📊 Gamma Reference: SpotGamma levels with Zero Gamma & Put/Call Walls
🧠 Key Levels & Price Map
Level Type QQQ Price NQ Equivalent Comment
Call Wall (3) 478 19760 / 19800 🔼 Target 6 - Bullish Exhaustion
Target Long 477 19720 🔼 Target 5
Call Wall / RB Head 475 19620 🔼 Target 4 / High Confluence
Call Wall 472 19500 🔼 Target 3
RB Bottom 470.89 — Intermediate Resistance
Put Wall (1) 470 19420 🔼 Target 2 (bullish if broken)
Fib 0.5 468.78 — Reversal Zone
Put Wall (2) 467 19340 🔽 Target 1 - Short Bias Begins
Put Wall (3) 465 19220 🔽 Target 3 - Strong Bearish Zone
📉 Gamma & Sentiment Context
Zero Gamma: At 468 – market may be more volatile below this level.
Vol Trigger: At 467 – below this level, dealers may hedge by selling, increasing downside pressure.
Put Walls: Act as potential support or reversal zones (465, 467, 470).
Call Walls: Act as resistance or bullish break levels (472, 475, 478).
🧭 Possible Scenarios
📈 Bullish Path
If price breaks above 470, next long target is 472, then 475 (high confluence with RB Head and Call Wall).
Above 475, potential acceleration toward 478–479 (high call gamma zone).
📉 Bearish Path
Rejection at 470–472 could lead to a retest of 467, then 465.
Below 465, expect a push toward 19300–19220 NQ, aligning with the lower Put Walls.
Volatility Setup Likely: VIX Breakout + QQQ Rejection = Risk Summary:
We now have alignment between two key charts:
🔹 VIX has broken major resistance with large institutional call buying
🔹 QQQ is facing trendline resistance with weakening momentum.
The setup points to a potential volatility surge + tech pullback over the next 1–3 weeks.
📉 QQQ Technical Breakdown:
QQQ is stalling under descending resistance from the February highs.
Friday’s candle closed just under the downtrend line, with volume tapering off — a classic exhaustion signal.
Multiple resistance zones cluster between 474–485, making this a high-friction zone.
RSI is rolling under 55, stalling near its last bear rejection zone.
Price is still trapped below the 100 EMA and 50 EMA, suggesting no clear bullish breakout yet.
⚠️ Key danger: If QQQ fails to reclaim 482–485, it risks reversing sharply toward 458–460, then possibly 440.
📈 VIX: Likely to Make a Big Move, Smart Money Buying Calls
As QQQ weakens, the VIX has already broken out:
Support flip at 23.50 is confirmed
Price is hovering above 25, with all short-term EMAs stacked beneath (bullish configuration)
Option flow for VIX is explosive:
$4M+ on 21C (May)
$2.2M on 22C (May)
Heavy demand at 30C (May) and 34–70C for later months
📊 Interpretation: Institutions are positioning now for a volatility event before late May — possibly driven by a tech sector retracement.
🔄 The Macro Setup:
Index Signal
VIX Bullish — breakout, EMA support, aggressive call flow
QQQ Bearish bias — resistance hold, weak volume, bearish structure
RSI (both) Neutral zone with momentum divergence forming
🎯 Trading Outlook:
Short bias on QQQ as long as it remains under 485
Long VIX exposure (direct or via calls) could be rewarded if QQQ falters
Watch May 21 and May 22 for VIX option expiries — institutions expect a move by then
📣 Final Thought:
The calm is deceptive. The breakout has already happened — just not where most are looking.
VIX is coiled and ready. QQQ is stretched and stalling.
The conditions for a volatility spike and tech pullback are in place.
✍️ Chart + flow analysis by @brownian (Far from being a financial advisor!)
📅 April 28, 2025
#VIX #QQQ #OptionsFlow #Volatility #BearishDivergence #TechnicalAnalysis #TradingView

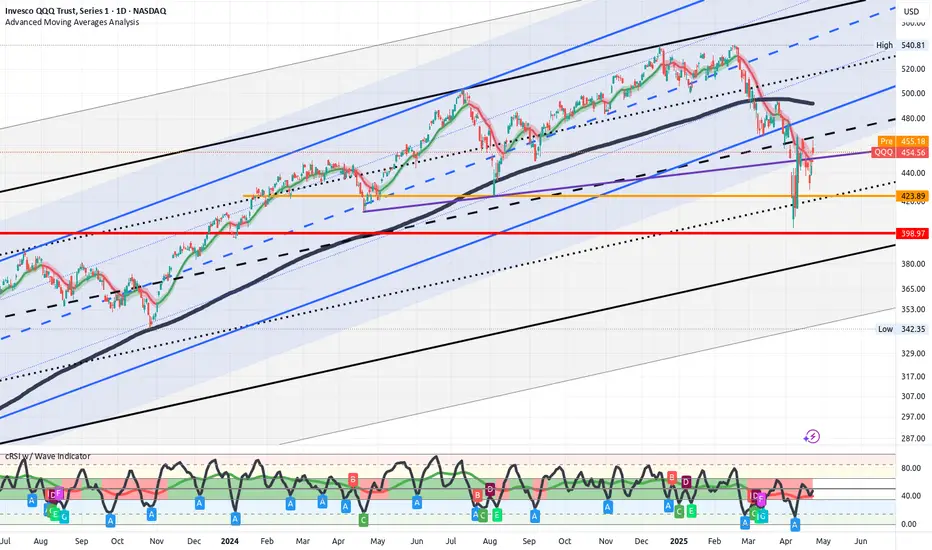
QQQ Long-term Key LevelsIdentified Key levels for Long-term Holdings
Disclaimer:
The information provided on this TradingView account is for educational and informational purposes only and should not be construed as financial advice. The content shared here reflects personal opinions and is not a recommendation to buy, sell, or hold any financial instrument. Trading and investing involve substantial risk and are not suitable for every investor. You should carefully consider your financial situation and consult with a financial advisor before making any investment decisions. Past performance is not indicative of future results. We do not guarantee the accuracy, completeness, or timeliness of the information provided. Use the information at your own risk.

"This is fine" on Nasdaq?The general sentiment coming into this week is that the bear trend is over and "things are fine." Maybe. This morning there was a 30m opening spike on NASDAQ:QQQ I cannot ignore. It is happening right at the big Daily 50% Retracement of the leg down:
The level is even more prominent on Nasdaq futures and one can add the Volume Profile Point of Control to said level.
CME_MINI:NQ1!
Playing this with June Puts on QQQ but going to use today's high as a tight stop. We'll see what "Sell in May" brings...

SPY/QQQ ES/NQ 28 Abril SPY (Top Left)
Possible Buy Zone:
➔ Between 545 and 547.39
➔ Confluence with Put Wall (545) and RB Bottom (547.39)
Major Resistance/Target:
➔ 550 - 553 area (Call Walls)
➔ If broken, eyes on 555+
Quick Game Plan:
Zone Action Notes
545-547 Possible Longs Strong support from options walls
550-553 Potential Profit Taking / Short Setup Call Walls overhead
Quote to remember:
"Price respects the walls — until it doesn’t. Trade the reactions, not the predictions."
📈 QQQ (Top Right)
Possible Buy Zone:
➔ 472-473 area
➔ Supported by Zero Gamma and a previous consolidation zone.
Resistance/Target Zone:
➔ 474.50 - 476 (Highlighted Sell Zone)

$QQQ APRIL 28 2025NASDAQ:QQQ APRIL 28 2025
Nothing about this trading range looks easy. Look at that!!

QQQ: Bearish Continuation is Expected! Here is Why:
Our strategy, polished by years of trial and error has helped us identify what seems to be a great trading opportunity and we are here to share it with you as the time is ripe for us to sell QQQ.
Disclosure: I am part of Trade Nation's Influencer program and receive a monthly fee for using their TradingView charts in my analysis.
❤️ Please, support our work with like & comment! ❤️

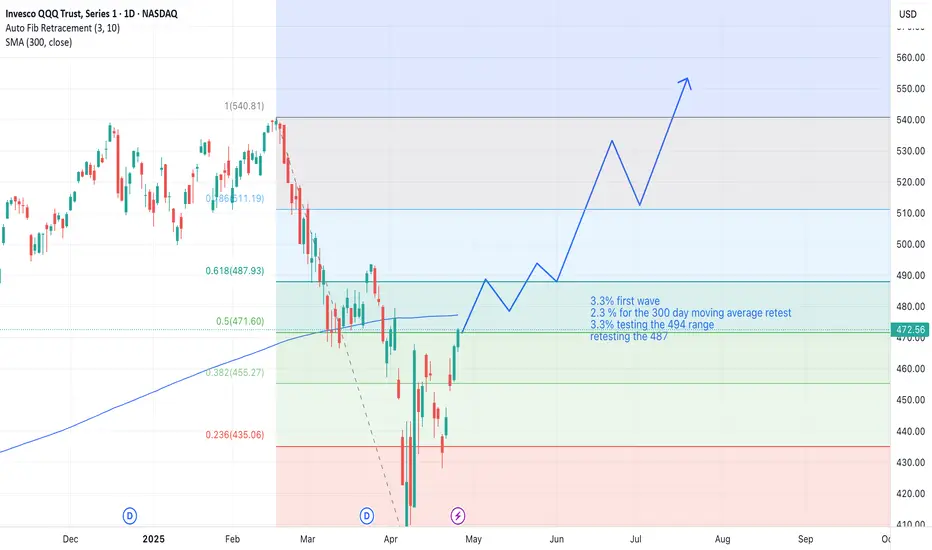
QQQ Bullish LongLooking for the predictions, We have multiple good news coming forward
Earnings Session
Tariff pause on china
Japan Trade deal
China Trade Deal
Rate cuts
QQQ - Your guess is as good as mineMarkets are all over the place. I know ground breaking info. I don't think there is any clear answer to what is next.
Even if Trump does reduce tariffs on China, they are still going to be some of the highest in recent history. However, it looks like Trump has flinched and China has the upper hand. That is just likely going to make Trump more erratic since his policies are emotional/ego driven and not strategic.
Overall, there are likely some short-term gains to be have as the market likes to always push up when not in an panic sell. For now, the worst of the news is over and the low from the other week is likely going to be the bottom for the near future. I expect stock to continue this up and down until the tariffs work there way through the system and we see the true effect on the economy.
We punched above the 20 day SMA yesterday and will likely test it for support today and tomorrow. If it holds, I wouldn't be surprised to see prices test the 200 day. Hard to know what crazy stuff Trump will do over the weekend, so we will have to see. Good luck and enjoy the ride.
The Graveyard Of Hope!The Graveyard of Hope is littered with "Buy The Dippers."
How many times can "Buy The Dippers" lick the stove before they finally learn their lesson not to believe anything Trumpchenko says?
The Elona MAGA algorithm goes like this
Over promise
Under deliver
Lie
Declare victory
Leave or Victim Blame
Meanwhile, the economy falls into an economic recession/depression abyss!
I am A political. I call it as I see it. My religion is Economics, Charts, and money. They don't lie!
Click Boost, follow, and subscribe. Let's get to 5,000 followers so I can help more people navigate these crazy markets.
Don't smoke the hopium crackpipe. It will financially ruin you.

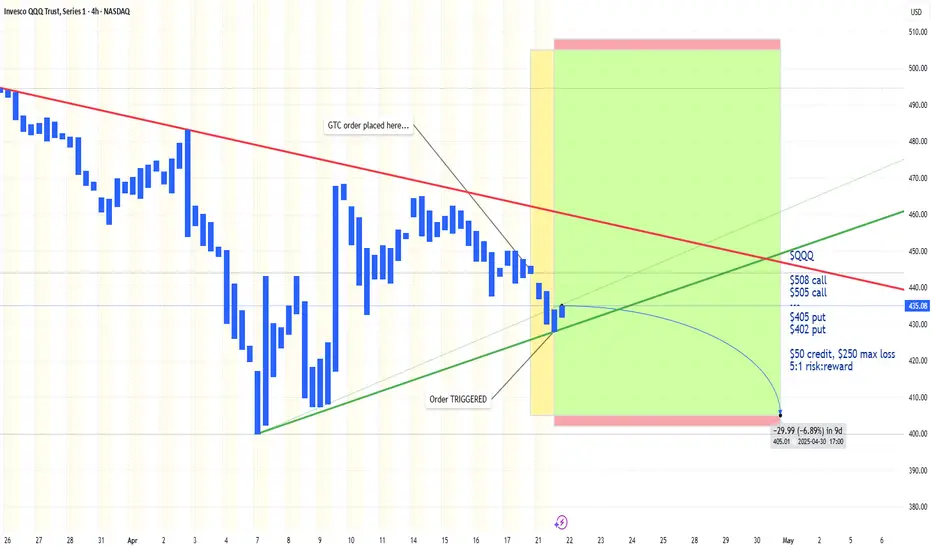
Short Iron Condor, 7 Days till ExpirationNASDAQ:QQQ
+1 $508 call
-1 $505 call
---
-1 $405 put
+1 $402 put
4/30 Expiration (WED)
$50 credit, $250 max loss
5:1 risk:reward
Key Test of Resistance on QQQKey remount of the QQQ. We are over the 9ema and 20sma now and testing a huge supply zone that we need to eat thorugh. This ownt be easy as this 470 level is a huge supply but this can be the start of something. A couple days of chop here while we grind under the supply zone could set us up for higher prices. They key is to see how we react into this zone as the first test into that 470 we might get rejected in absence of news but we need the see the nature and structure of that pullback. We are by no way means out of the bear market this is a traders market but there are some green shoots. The market is shrugging off bad news and the trump team is trying to keep this market afloat by anymeans!

QQQ Ready to Rip Higher? Gamma Pressure + SMC Confirmation Align 🚀
QQQ is showing strong signs of continuation as we head into the next session. Let's break it down using both Options GEX sentiment and Smart Money Concepts (SMC) structure.
🔍 GEX Outlook (Options Sentiment)
* Highest positive NETGEX sits at the 445–448 range, acting as a magnet.
* We’ve already reclaimed the HVL support at 430, and the Options Oscillator is lighting up bullish.
* Calls make up 26.9% of the flow and GEX flipped full green, meaning market makers are likely long gamma — pushing price toward resistance.
* Resistance clusters:
* 445–448: GEX9 and 2nd Call Wall.
* 466.35 & 479.02: Target zones from price action.
💡 Options Trade Idea:
445C or 450C (0DTE–2DTE) — scalp toward the GEX magnet zone.
460C+ (Next Week) — swing if price holds above 447.8 and you want to play the extension to 466–479 range.
📈 Technical Analysis (SMC + Structure)
* MTF trend bias: 30m & 1h bullish.
* Strong bullish structure with ChoCH → BOS → rally confirmation.
* Thin volume during this leg up is a cautionary flag — be selective with entries.
* Price must hold above 447.8 to remain in bullish continuation.
* If volume steps in, this could be a session high sweep with fuel left.
* Setup: Bullish Hold
* Entry: Await confirmation near 447.8 zone.
* Target 1: 466.35
* Target 2: 479.02
* Stop: Below 441.01
🧠 My Thoughts:
This looks like a textbook GEX compression + SMC breakout alignment. MM positioning is bullish and technicals are lining up with a classic continuation pattern. However, thin volume could mean a stall or trap — I’d stay nimble, scale in on dips, and tighten stops once we push into the 455–460 zone.
