Stocks SPOT ACCOUNT: QUBT stocks buy trade with take profitStocks SPOT ACCOUNT: NASDAQ:QUBT stocks my buy trade with take profit.
This is my SPOT Accounts for Stocks Portfolio.
Trade shows my Buying and Take Profit Level.
Spot account doesn't need SL because its stocks buying account.
QUBT trade ideas

Stocks SPOT ACCOUNT: QUBT stocks BUT ENTRY with TAKE PROFITStocks SPOT ACCOUNT: NASDAQ:QUBT stocks my buy trade with take profit.
This is my SPOT Accounts for Stocks Portfolio.
Trade shows my Buying and Take Profit Level.
Spot account doesn't need SL because its stocks buying account.

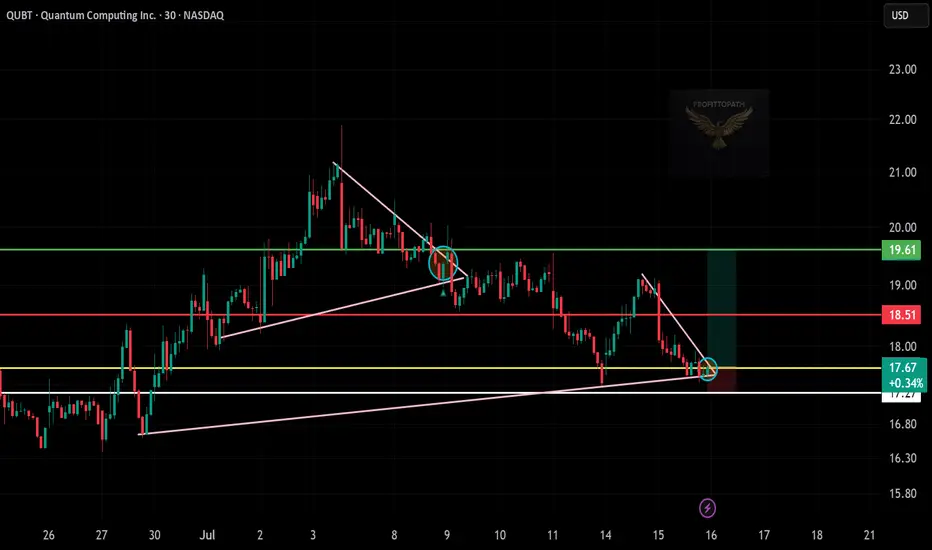
QUBT Bounces Off Trendline – Long Setup!
🧠 Chart Analysis Summary:
Setup: QUBT bounced off a long-term ascending trendline (pink), with potential reversal from support.
Current Price: $17.67
Breakout Zone: A breakout from the small falling wedge/pennant pattern appears underway.
Support Zone: Around $17.25–17.50 (white/yellow lines)
Target Zone:
First Target: $18.51 (red line)
Final Target: $19.61 (green line)
🎯 Trade Idea (Long Position):
Entry: $17.60–$17.75 (post-wedge breakout)
Target 1: $18.50
Target 2: $19.60
Stop-Loss: Below $17.20 (trendline support break)
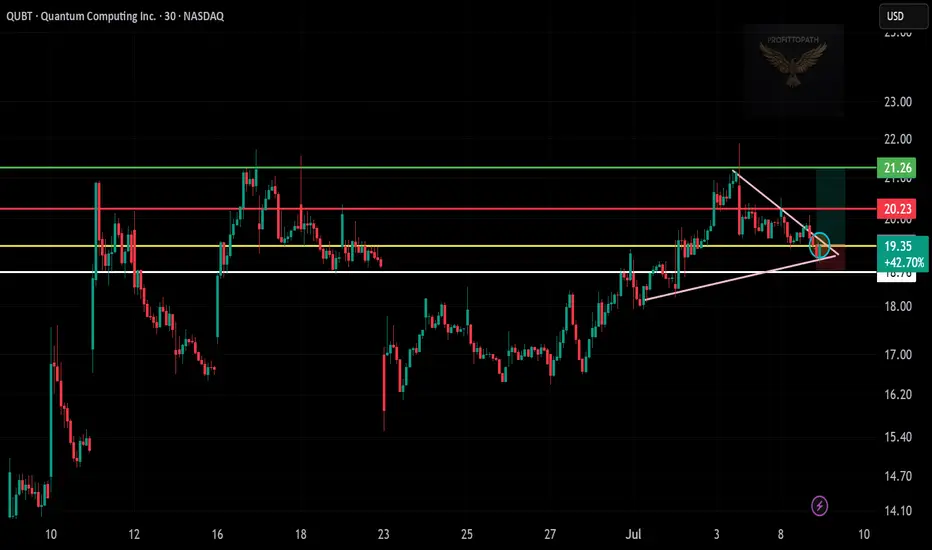
Long Trade Description (QUBT | Quantum Computing Inc.)📄
Ticker: NASDAQ:QUBT (Quantum Computing Inc.)
Timeframe: 30-Minute Chart
Trade Type: Long – Breakout Setup
QUBT is forming a tight wedge breakout, bouncing off trendline support with entry confirmation around $19.35. The breakout structure offers strong momentum potential if price reclaims above $20.23. Stop-loss is positioned below key trendline around $18.76, with upside target near $21.26.
This is a clean bullish continuation setup with a solid risk-reward ratio and rising volume near the breakout zone.
📌 Trade Levels:
Entry: $19.35
Target: $21.26
Stop-Loss: $18.76
💡 This trade is shared for educational purposes only — not financial advice.
🔔 Follow @ProfittoPath for daily stock setups & market breakdowns.
SPOT ACCOUNT: QUBT Stocks my buy trade with take profit SPOT ACCOUNT: NASDAQ:QUBT Stocks my buy trade with take profit
Trade shows my Buying and Take Profit Level, Spot account doesn't need SL as its stocks buying account.
I have set my TP level.

6/30/25 - $qubt - short... AGAIN. lol6/30/25 :: VROCKSTAR :: NASDAQ:QUBT
short... AGAIN. lol
- it's pretty simple
- 1/ the recent "dilute me harder" gap on June 23rd gets filled
- 2/ the CFO leaves, gets paid a pile of shares on the way out (lol)
- 3/ no product
- 4/ index inclusion means... real money will underweight this hardcore
- 5/ and it remains the gift that keeps on giving
i love donuts
V

QUBT long at 16.77 -- just having a little funQUBT is a full on meme stock. With that in mind, I will lead with a word of caution for those who might attempt to follow in my footsteps on this trade. These are HIGHLY speculative stocks on which a person could lose a WHOLE lot of their capital if things go sideways. Drawdowns on these trades can routinely exceed 20% and do that in a matter of days. If you are tempted to trade this, please do your own research and make smart financial decisions.
With that out of the way, my rationale for this trade is simple, the potential for outsized gains. With the filter I've recently placed on my trading signals, risk is reduced, but still significant. But a median result in excess of 5% for 5 days of my money's work is a compelling motivator to go long here. Given that these trades almost always turn out profitably and there is an open trade 12% above the current price, I could theoretically hold on until and possibly beyond then. I may bail out more quickly, depending on the circumstances. I'm not a diamond-hander and definitely not necessarily needing a home run here. The wins add up.
If you look on the chart, the white arrows represent signaled trades. If I had just taken the first signal, waited until it closed, then took the next signal and held until it closed, etc. until today, the cumulative gain on what would have been 7 trades in 6 months would have been around 55%. I don't need home run trades here to make significant money.
Full disclosure, in the time it took me to write this, the stock has gone from 16.71 to 16.99, so if you want to deduct that from my reported returns, knock yourself out. I can't help that, which is why I usually post these ideas after the market closes. But this one was too juicy to sit on.
As always - this is intended as "edutainment" and my perspective on what I am doing, not a recommendation for you to buy or sell. Act accordingly and invest at your own risk. DYOR and only make investments that make good financial sense for you in your current situation.

QUBT buy @ 18, target 200NASDAQ:QUBT | Quantum Leap Loading ⚛️🚀
🧠 One of the rarest tech bets on the planet
📉 Buy Zone: $17–18
🎯 Target: $200 in 4 years
Riding the Quantum Supercycle
📡 EMA alignment ✔️
#QUBT #QuantumComputing #TechStocks #UniproMomentumPattern #Multibagger #NASDAQ

QUBT on WatchLooking for a breakout above the gap at $18.83.
Why:
Uptrend
Consolidating since the 11th
MACD looking ready to turn bullish
Target is right below $25.31 (1.618 fib)
Stop loss is below the close of the gap.

QUBT - 2 Formations are in considerationHello Everyone,
Happy Sunday to all.
Today i would like to have a look another Quantum Computing stock which is QUBT.
For the time being price is going up and down between 18 to 21.
I am considering 2 formation in daily chart.
First one is Rounding buttom which is marked as Green:
Target : 40 - 42
If it can break 25.50 and stay for 3 days above it then we can consider this formation and reach to 40 $ level.
Second one is Cup and Handle which is marked as Orange:
First Target : 14.80 - 15.00
Then : 20-21
Then : 30
Final target is : 40.00
All in all i see a good opportunity on QUBT and within a year there is a possibility to hit 40. (Maybe less then a year)
This is just my thinking and it is not invesment suggestion , please do not make any decision with my anaylsis.
Have a lovely Sunday to all.

6/16/25 - $qubt - 20% short. ice cold veins.6/16/25 :: VROCKSTAR :: NASDAQ:QUBT
20% short. ice cold veins.
- puts/ size managed approps.
- be warned, this company won't likely ever deliver a product.
- therefore, it's very likely worth exactly zero.
- i'll take it to 30% if i need to in the next few sessions leading up to it's "index inclusion" where it will get absolutely decimated as funds find it an "easy" funding short on the mgn.
- mgmt will have a hard time testifying in court why they are making various misleading statements which are likely fraudulent and at worst criminal. but that's just a guess.
- alas who knows.
- i don't have a crystal ball
- but i know a donut when i see one.
V

Market Update - 6/15/2025• Almost everything sold off on Friday, I also closed all my positions even though some of them still didn't hit my sell rule ( NYSE:QBTS , NASDAQ:LAES , NYSE:AMPX ), might regret it later
• Gold, energy and defense stocks are holding up, reflecting the middle east fears
• Weirdly gaming and entertainment stocks like NYSE:RBLX , NYSE:SPOT and NYSE:SGHC were holding up strong on Friday, not sure why, but they could be future leaders. War expectations and lockdown so people stay at home gaming and gambling? Who knows
Portfolio Analytics
• 2 big mistakes remaining: missing out trades (I'm getting better) and giving back too much -> this week I focused on the latter
• On average I'm giving back 0.82R per trade, almost 1
• So every trade could almost cover 1 loss
• This means that just by taking profits better I could cover a large portion of my losses, becoming profitable
• Usually my gains peak out at day 4-5 at around 5-7R
• Interesting how Qullamaggie always said to take profits after 3-5 days, which exactly aligns with this
• My median gain is 2R - idea is to sell half at this level
• My 75th percentile is 5R - at this point I should be out of 75% of the position - aligns well with what Stockbee is doing and it makes so much sense
• If I hit a huge R multiple early on (based on 90th percentile), take larger than 50% profits, maybe 80% - average holding days is less than 3 days
• Additions to methodology: paying attention to correlation coefficient to remove myself from index moves by trading low correlation stocks and calculating $ ATR on a portfolio level to put into context my average daily $ moves. Given I'm trading 10x higher ATR stocks than the indexes, even if I'm only 30-40% invested, that's like being fully invested in the indexes. This puts these "large" daily $ swings in my portfolio into context and reduces my likelihood of closing out early because of a down day.
• Next weeks: no setups (maybe gold and energy), not interested in trading in such news driven market, 100% cash

6/10/25 - $qubt - Shoving on the short side6/10/25 :: VROCKSTAR :: NASDAQ:QUBT
Shoving on the short side
that is all.
gl. taking this pretty high on ST P's
V

QUBT watch $8.64/75: Key Resistance after quantum sector rallyQUBT rallied with all quantums, into a serious resistance.
Looking for a Dip to Buy or a Break-n-Retest entry for longs.
Some companies are apparently close to commercial usage.
$8.64-8.75 is the exact zone of interest.
$9.36 would be first target for a breakout.
$8.16 then 7.65 are supports below if needed.
====================================================
.

Quantum Race: Who Will Become the “NVIDIA” of the Quantum Era?Quantum Computing Race: Who Will Become the “NVIDIA” of the Quantum Era?
As the quantum computing sector accelerates, companies like D-Wave Systems, Rigetti Computing, Quantum Computing Inc. (QUBT), and IonQ are emerging as key players—each competing to become the dominant force in what could be the next trillion-dollar tech frontier. The comparison to NVIDIA in the AI and GPU revolution is no longer far-fetched, as these firms race to define the future of computing.
Despite their different technological paths—D-Wave with quantum annealing, Rigetti with superconducting qubits, IonQ with trapped-ion systems, and QUBT with hybrid quantum-classical platforms—these companies are now tightly interlinked in market perception. A strong earnings report, product milestone, or government contract from one often fuels sector-wide hype, lifting stock prices and investor sentiment across the board.
This mutual influence is driven by the belief that success by one player helps validate the entire industry. In that sense, these firms are collaborative competitors, pushing the space forward while fighting for leadership. Quantum computing is still in a developmental phase, but the potential is massive—targeting breakthroughs in AI, cybersecurity, materials science, finance, and more.
With analysts forecasting the global quantum computing market to exceed $1 trillion by 2035, the question is no longer if the sector will explode, but who will lead it.
For now, no clear winner has emerged, but momentum is building. And in this space, a breakthrough by one can ignite a rally for all—making the quantum sector one of the most exciting and interconnected areas in tech today.


QUBT LONGFollowing the strong quantum theme. Lice breakout with volume while spy weakening. $18-$21 targets.

5/23/25 - $qubt - 1000x sales for a fake company?5/23/25 :: VROCKSTAR :: NASDAQ:QUBT
1000x sales for a fake company?
- what could go wrong?
- this one is the most squeezable, mainly bc it's such a "tiny" market cap of $2 bn vs. the other ""quantum"" names.
- with that being said, this is not a real company
- i welcome this thing ape'ing higher. it's already 3% short, but i'd *love* to take it to 10%.
- currently have a 20% sector short on leverage w/ long dated exposure
- play carefully
- but i've never seen a more obvious sector short in my life
V

QUBT Bullseye: $20 Taget in Sight! Welcome to Odins Trading Den!
QUBT Bullish Outlook: Targeting $20 in the Coming Weeks
QUBT is showing strong bullish potential on the daily chart, with a clear setup pointing to a move toward the $20 range in the next few weeks. My analysis highlights a bullseye target at $20, supported by key technical indicators and price action:
Breakout Momentum: QUBT has recently broken above key resistance levels, signaling strong buying interest and potential for continued upside.
Volume Surge: Increasing trading volume supports the bullish move, indicating growing market confidence.
Technical Patterns: The chart shows a bullish consolidation pattern, with price action tightening before an expected upward breakout.
Target Zone: The $20 level aligns with historical resistance and Fibonacci extension levels, making it a realistic target for this move.
Check the chart for the bullseye marking the $20 target. This setup suggests a strong risk-reward opportunity for traders. Always manage risk and stay updated with market conditions.
What are your thoughts on QUBT's potential? Let’s discuss below!

QUBT Ready For LiftoffQUBT also known as Quantum Computing Inc is an innovative, integrated photonics company that provides accessible and affordable quantum machines to the world today.
Given the potential and scale for AI technology, Quantum computers may become more in demand to process and support the future of the AI boom.
At the moment, we are seeing quite a bit of strength coming into this stock given the surprise of 250% on earnings this week, a massive 10x increase from their previous averages.
Technically, we are seeing price rise above the downtrend VWAP (Volume weighted Average Price) which is a significant resistance for the current downtrend. Given the current strength, I am interested in further upside, potentially back to the ATH which can happen quite quickly given how this stock moves in large impulses.
The MACD is currently starting to curl to the upside as well after a recent cross, signalling that momentum is beggining to shift to the upside.
For an ideal entry, you can wait for the VWAP to be backtested as an ideal entry at support around 11.85. Should we drop further to the 10.85 earnings gap, this would be a great area to compound the long trade for the reversal.

quantum tech. bullish earnings the only reason I will be longing hundreds of contracts on this earnings report is due to their new plant in AZ, which opened in march. They should report better EPS then expected. not much to it

5/14/25 - $qubt - lol5/14/25 :: VROCKSTAR :: NASDAQ:QUBT
lol
- a billion dollar market cap
- that's the product, as i can tell
- even meme coins don't burn your cash
- i'm proactively shorting this into results, and will double or triple my size if the reaction is a massive spike - i actually welcome it. reality it, it's such an obvious donut at this point, i almost can't help myself.
- if you can offer anything logical in the comments worth responding to, i'll gladly engage and politely
- but if you're going to troll me, i don't need do more than just wait it out and i won't even say "scoreboard" at the end of this all. that would just be mean and it's not my nature.
- just be careful if u own this, k?
V

QUBT – Symmetrical Triangle Breakout Setup with 32% PotentialQuantum Computing Inc (QUBT) is forming a symmetrical triangle on the 15-minute chart. The price just bounced off the lower trendline at $7.59, and the projected move could reach $10.04, offering a +32% upside.
Technical Highlights:
• Triangle Pattern: Clear structure with lower highs and higher lows.
• Support Bounce: Strong reaction from $7.59 (triangle base).
• RSI: Rebounding from mid-range (currently 50–57), signaling strength.
• MACD: Preparing for a bullish crossover.
• Volume: Healthy increase near support area.
Bullish Scenario:
A confirmed breakout above the upper boundary (~$8.20) with volume could trigger a strong move towards the measured target at $10.04.
Stop Loss:
Below $7.50 for conservative risk management.
⸻
Disclaimer:
This analysis is for educational purposes only. It is not financial advice. Please do your own research before making any investment decisions.
