Ferrari speeds up to new highsThe weekly chart reveals some interesting signals.
MACD histrogram slope is rising and macd-signal is crossed.
High volume confirms a strong trend.
Last week a new all-time high was formed, it will be retested.
Fundamental analysis all leads to strong buy, Zacks gives a rating of 2.
Go long !
RACE/N trade ideas

RACE longPocket pivot today off the 50 SMA. Note 50 SMA support throughout its run. New highs at 118 area.

Ferrari - target price 160 $NYSE:RACE Ferrari is the leader in the auto sector.
The profit in the last reporting quarter was 0.85 cents per share, which is 63% more than in the same quarter last year. We also noticed an acceleration in the rate of profit growth over the past two quarters from 59% to 63%, which is undoubtedly an excellent indicator. During the last 6 quarters the company's actual profit exceeded the forecasted one. In parallel with the growth in profits, we see an increase in sales growth rates from 6% in the second quarter of 2016 to 20% in the second quarter of 2017.
Confirmation of rumors about the fact that Ferrari to release its first SUV "FUV" is the catalyst for achieving the goal of $ 160 per share

Justin Mamis Sentiment CycleSometimes it's straightforward.
Happens over and over on multiple timeframes.
on.mktw.net


$RACEPuede la ferraria quedarse sin nafta?
Juego de triangulos y posibilidades.
Objetivo U$s 60/ U$s 70

Parabolic Ferrari - Earnings Play1) Evening Star before earnings.
2) 1-month and 3-month return change is unsustainable and in my opinion setting up for a black swan earnings potential.
3) When viewing from a log view it's now above upper channel.
-Execution: Small position of OTM put options w/ less 1 month expiration.

Ferrari is a new longFerrari seems to be ready to break above its high at 92 Usd Dollars. An increase in volumes has been detected. This might be a signal of the upcoming break of the horizontal resistance at 92 Usd dollars. On 4hr charts, the Price oscillator has now crossed above the zero line, which is a strong bullish signal. Coppock curve is not oriented upwards, as MACD. On a daily and weekly charts, it is clearly visible a stable uptrend

FERRARI....STRONG UPTREND ...BUYING ferrari is my sweetheart enter to buy if confirming above tl end of todays time


RACE:a trade to not even worry about following the channel up worry when it gets to a purple zone other wise just long,take profits, relong take profits and so on.. hahaha


Ferrari: daily triangle breakoutMain signals:
double bottom
triangle
gap
Buy 49.50-50.00
Stop-loss 47.34 (-1 tick under triangle)
Target #1 57.50
Target #2 60.00


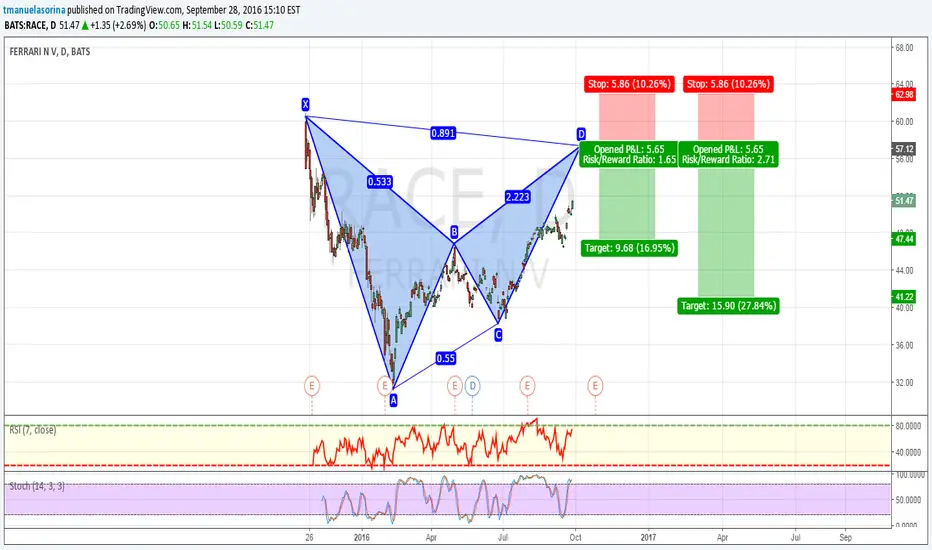
Ferrari short entry at $ 46 [Just an idea]Hi traders,
We are currently looking at the daily chart of Ferrari. What do we see on the chart?
AB=CD pattern completion at $ 46
The big reversal in May 2016 was started at $ 46
If we draw the Fibonacci retracement from the moment of the Initial Public Offering in late 2015 to the low swing of February 2016, the 50% retracement end up just above $ 46
All in all, I think this is a good opportunity to go short.
Entry: $ 46
Stop: $ 47
Target: $ 43 = R:RR 2.63
Good luck if you take this trade. I will keep you updated.
