RGLD trade ideas

RGLD: $140+ Short (Expected Positive Earnings Call)First off, please don't take anything I say seriously or as financial advice. As always, this is on opinion basis. That being said, let me get into my insights. I do expected Royal Gold to have a positive earnings call in the upcoming 5 days, and currently it already is on a bullish curve with many investors giving it buy ratings. This is why I am calling at least a $140 short target and saying it has some long potential with low to medium risk.

LONG RGLDExpecting bounce from extremely oversold weekly and daily levels. If stop breached, be prepared to catch new daily reversal on lower levels with a tight stop.

royal gold's run beginsfull on mega bull market from here. Enjoy.
If you are luck it goes lower and lets you on.

Royal Gold - another miner to buy at supportNASDAQ:RGLD is one of the leading stocks in gold mining industry. It started major rally earlier than majority of other miners last spring. And was one of the first stocks to caution that pullback is likely in AMEX:GDX in January 2020.
Right now it sits right near major support level, and in bullish scenario this is constructive level from which new leg higher should start.

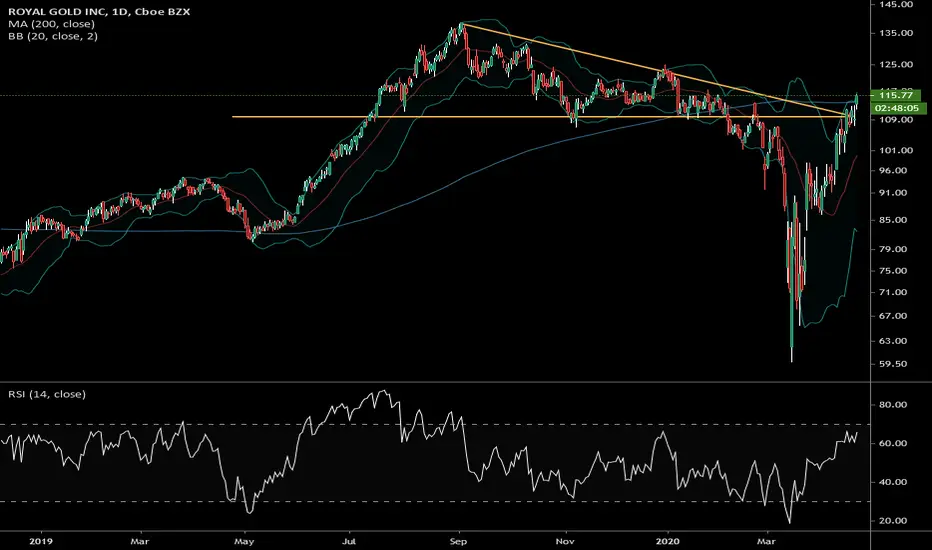
RGLD Long PlayRGLD Long play $114 Entry. Stop $112.
Looks like it bounced 200 MA twice and it may move higher, it rejected 20 MA recently on daily. Earnings coming up, gold has been booming.
RGLD may print better than expected earnings.
I'll hold through earnings and double down if it breaks out past the 20EMA+50EMA into a strong pattern or into congestion around it.

RGLD BreakoutBuyer have come into market to break upper trend line for continuation, notice low volume, due to Christmas period

if you have an issue with 'gold bugs' I say you are a DENIERI do believe RGLD is a gold miner and it crushes the market with very little correlation, very interesting position(im long)

RGLD Put Spread135/125 Put Spread
Gold is sky rocketing while Trump and Friends are making some progress with the Chinese SPY is rising on good news so is the SSE and gold is plummeting
Put Spread $3.8 Cost (PRICEY) 10 point spread.
$250 max loss max gain is $310.
Max loss is possible if GOLD keeps rising but since its sinking could be good for me.

RGLD Put SpreadPut Spread on RGLD
Cost is expensive. $2.21 5 point wide, exp nov 15.
Max gain will be $3.21 and max loss is $150, $100 gain if Its in a money on both spreads.
Target exit will be $114

RGLD - Long - Gold BullPullback, price tightening, uptrend,...inflation . Per Dalio, this is the end of the long-term debt cycle.
Long gold and silver long term $SIL, $EGO, $KGC, $KL, $FNV; shorting the $IYT and $IWM on pops (day trades)
Near-term Risks: trade deal with China and/or lowering of interest rates

Royal Gold Up Over 23% Since Alert - Congrats to Subscribers!It is very easy to read price action if you have a reference point. These support/resistance lines are there to help you read where the buyers and sellers are likely to make a stand.
MasterChartsTrading Price Action Indicators show good price levels to enter or exit at trade.
The Blue indicator line serves as a Bullish Trend setter.
If your instrument closes above the Blue line, we think about going Long (buying).
For commodities and Forex, when your trading instrument closes below the Red line, we think about Shorting (selling).
For Stocks, I prefer to use the Yellow line as my Bearish Trend setter (on Daily charts ).
Be sure to hit that Follow button! Please find me on social networks via the link on my profile page for more ideas from MasterCharts!

RGLD - If this stock could wear a thong!This would be the sexiest stock at the bear right now if it could wear a thong. Nice upside. Higher highs on track with gold and higher lows based on the uptick in gold volume. I would load up on the low end of the range and unload near the top. Rinse and repeat.

RGLD Long Position Potential BreakoutRGLD is trending apart from the SPY its not overly effected by the market movement, Breakout past $80 holding till $90 Bought a call Strike $80 at 2.45 exp jan 18 with a stop at 1.25.

$RGLD - Switchin things up a bitUsually wouldn't even waste my time on a chart this ugly, but it was a toss up between posting the failed breakout of $DXY vs a legitimate contrarian play if you like buying at the very bottom. If the drawings look a little too extra - they're not. I've seen this pattern on a regular basis when I was either too quick on a jump to short (but ripped my hair out because price was range bound) or too quick to try & make a quick profit from the bottom up (but ripped my hair out because it wasn't time for a breakout). Without making it complex - it's patterns lime these that I made gave their own category for just because it was a predictable (breakout) move just by the bar count. The biggest problem with catching a bottom like this - if you're like me, is the possibility a breakout that only produces a small profit, & price just moves up to a (slightly higher) range bound for a bit. Time decay weighs on your patience & you get out to find a MOMO trade (guilty). Fib re-trace is based off a 223% price target, but seeing as price is below trend without moving averages confirming the downtrend - best bet is for a 141%-161% test of highs to prevent a break of the 180 weighted (blue). Pattern category is "110 breakout" - whereas candle after break of support from a gap down is #1, & the #110 candle (whether bottom or top of price range) is your entry. The 3 yellow lines indicate other potential entires (55, 75, 110 tend to be points of interest) if you're tryna get long. Fair warning - trustworthy pattern to me more-so on intraday charts to get a better sense of support, but like I said, a real contrarian play to say the least. More than happy to leave a few examples since to give a better perspective.
Ex. 1 -
Ex. 2 www.tradingview.com
Ex 3.

RGLD(daily chart). Potential Inverse H&S. (Watch)RGLD(daily chart). Potential Inverse H&S. (Watch)
Stabilization on minor H&S, break of Neck_Line.


Rejection of higher prices on Royal Gold - Weekly Chart $RGLD $GLD $GDX #gold #miners #trading $DXY
These custom support resistance indicator lines show decent places to enter or exit.
The Blue indicator line serves as a Bullish Trend setter.
If your instrument closes above the Blue line, we think about going Long.
If your instrument closes below the Red line, we think about Shorting.
For Stocks, I prefer to use the Yellow line as my Bearish Trend setter (on Daily charts).
Find out more. Send Private Mail (PM) to @MasterCharts


RGLD(4hr chart). Within Channel, Bullish butterfly, EW5 possibleRGLD(4hr chart). Within Channel, Bullish butterfly, EW5 possible

Steady uptrend for Royal #gold despite $GDX weakness Buy at the blue or green line. Ask me how to get these indicators! $DUST $NUGT $GLD
