RIOT trade ideas
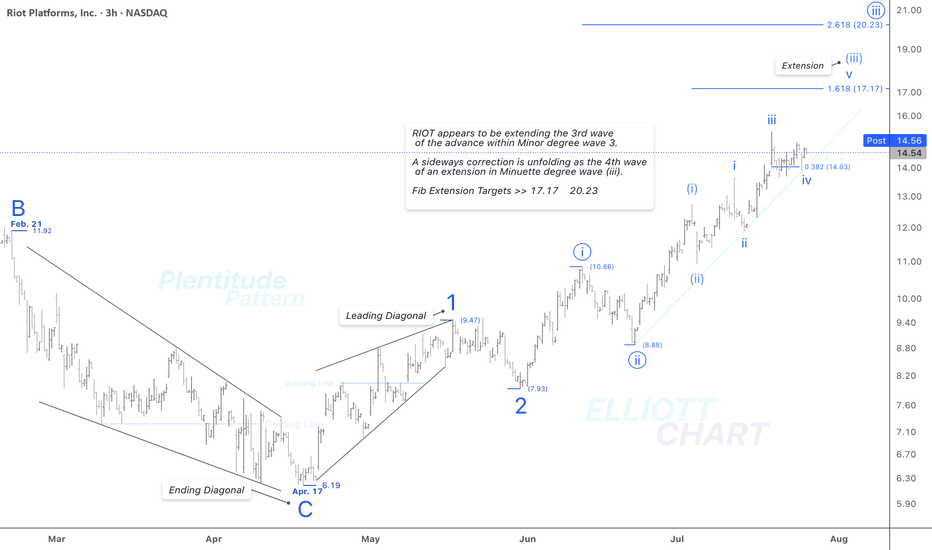
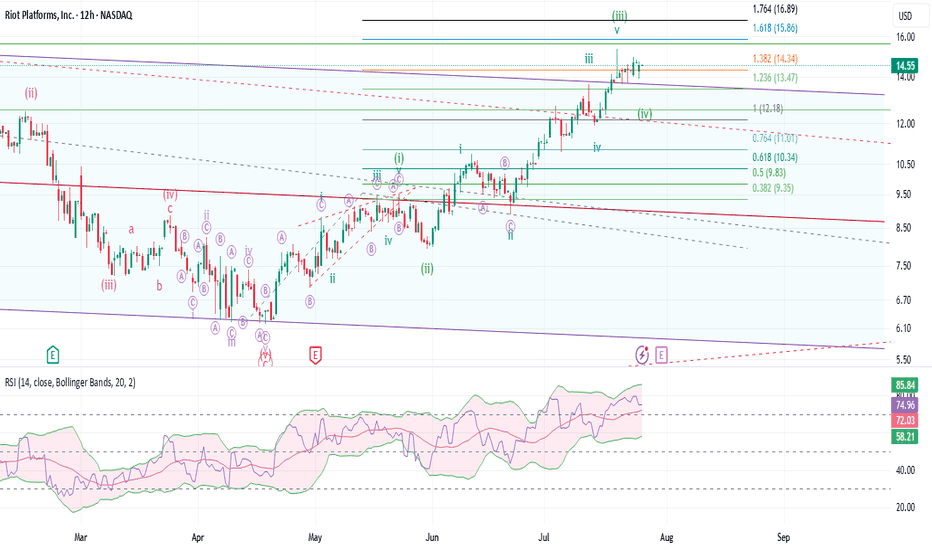
RIOT / 3hAs illustrated on the 3-hour chart above, NASDAQ:RIOT appears to be extending the third wave of an impulsive advance within Minor degree wave 3.
And as anticipated, a sideways correction is unfolding as the fourth wave of the ongoing extension in Minuette degree wave (iii).
Fib Extension Targets >> 17.17 & 20.23.
>>> In this timeframe, I'm analyzing the initial rising tide within the ongoing Intermediate degree wave (1), where a nested series of waves have quite well revealed: 1, 2 → i (circled), ii (circled) → (i), (ii) → i, ii. The extreme high of this impulsive sequence lies beyond the visible range of the current chart.
NASDAQ:RIOT CRYPTOCAP:BTC BITSTAMP:BTCUSD MARKETSCOM:BITCOIN
#CryptoStocks #RIOT #BTCMining #Bitcoin #BTC
$RIOT Targets hitNASDAQ:RIOT has hit my take profit target at the High Volume Node and R3 daily pivot where it has found resistance.
Wave III appears to be complete with wave IV expected targets being the 0.382-0.5 Fibonacci retracement, also the daily pivot point and ascending daily 200EMA, $10.24.
Analysis is invalidated if we continue to the upside with a new swing high. RSI is overbought no bearish divergence.
Safe trading
RIOT Platforms, Inc. ($RIOT) – Price Decision Point Near: $17 Br
📆 Timeframe: Daily (1D)
📈 Current Price: ~$13.56
🪙 Key Correlation: Moves in strong tandem with Bitcoin ( CRYPTOCAP:BTC )
⸻
🔧 Chart Analysis Summary
NASDAQ:RIOT has approached a major confluence zone just below $14.06, where several resistance levels, order blocks, and fair value gaps converge. Historically, this zone has rejected price multiple times, making it a critical inflection point.
The technicals suggest a binary outcome is likely in the near term:
⸻
🟢 Upside Scenario – Target: $17.35 to $17.88
If RIOT breaks above the $14.06 resistance with conviction:
• Price could push quickly toward $17.35–$17.88, where:
• Multiple historical supply zones exist
• Large prior rejection candles originated
• LuxAlgo and order block indicators flag institutional interest
• Momentum would likely align with a concurrent breakout in Bitcoin above $120K
⸻
🔴 Downside Scenario – Target: $10.12 to $9.70
If RIOT fails to close above $14 and loses $12.93 support:
• Expect retracement toward:
• $12.05
• $11.50
• Key demand near $10.12–$9.70
• These zones are backed by previous price consolidation, fair value gap fills, and historical bounce levels.
⸻
🔗 Bitcoin ( BITSTAMP:BTCUSD ) Connection
📉 Current BTC Price: ~$117,747
BTC has recently:
• Tagged a long-standing resistance band ($119,182–$120,000)
• Rejected sharply with multiple fair value gaps below
• Holding trendline support, but weakening structure is visible
If Bitcoin breaks below its trendline, a move toward $91K–$92K becomes likely — this would drag RIOT down with it.
If Bitcoin breaks above $120K, momentum could surge across crypto-exposed stocks, and RIOT may follow with a rapid leg up.
⸻
🎯 Conclusion
Scenario Trigger RIOT Target
✅ Bullish BTC breaks $120K $17.35–$17.88
❌ Bearish BTC rejects + loses trendline $12.05 → $11.50 → $10.12–$9.70
⸻
❓Your Turn:
Do you think RIOT breaks out or breaks down?
Let’s see how this unfolds.
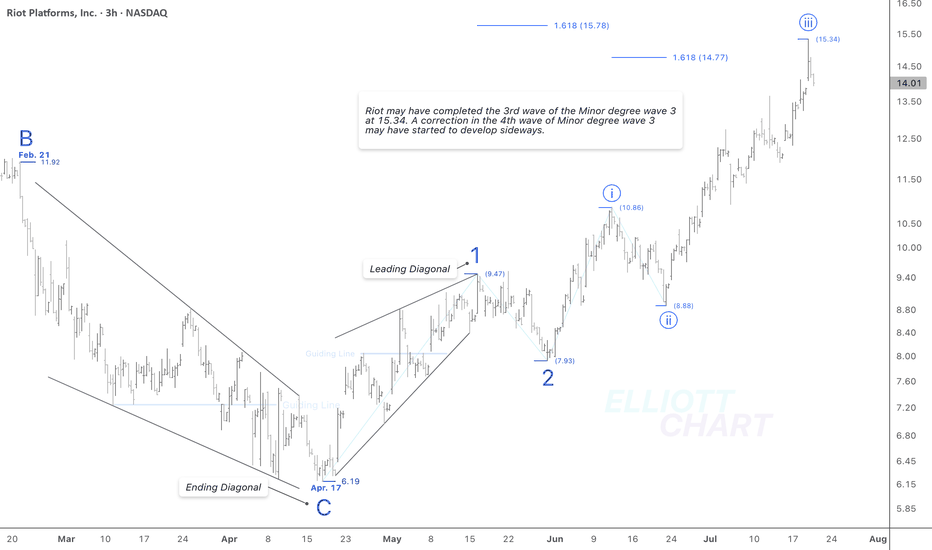
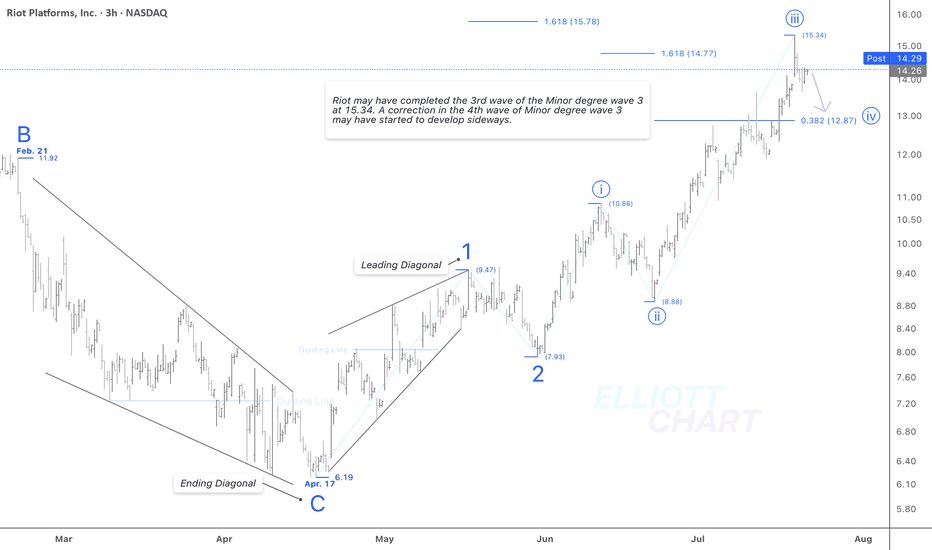
RIOT / 3hThere is no specific change in my NASDAQ:RIOT 's analysis. The wave iii(circled) of Minor degree wave 3 should have ended at 15.34.
Now, a following correction in the 4th wave of Minor degree wave 3 may have started to develop sideways. And it might take just a couple of weeks.
NASDAQ:RIOT CRYPTOCAP:BTC BITSTAMP:BTCUSD MARKETSCOM:BITCOIN
#CryptoStocks #RIOT #BTCMining #Bitcoin #BTC
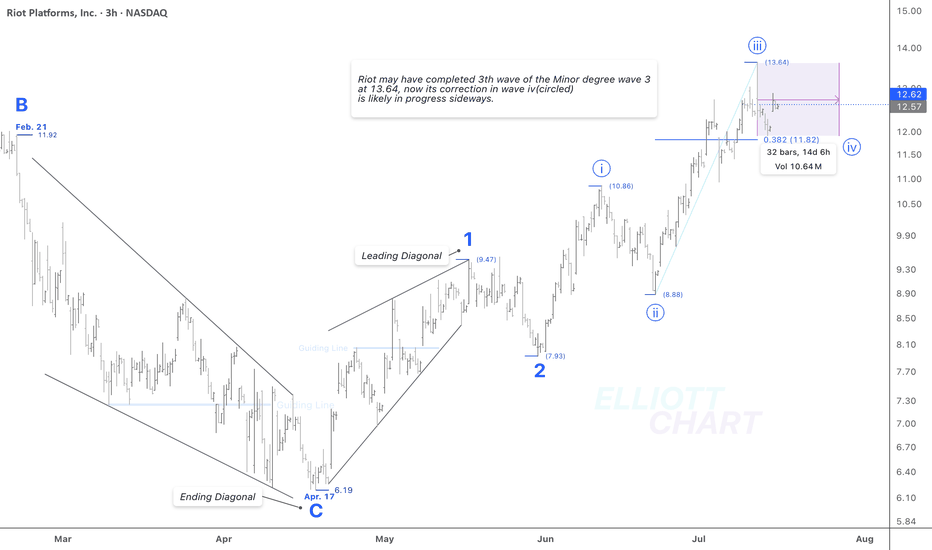
RIOT / 3hThere is no change in the NASDAQ:RIOT 's trend analysis.
Wave Analysis >> As illustrated in the 3h-frame above, NASDAQ:RIOT may have completed the 3rd wave of the ongoing Minor degree wave 3 at 13.64, its correction in wave iv (circled) is likely in progress sideways.
#CryptoStocks #RIOT #BTCMining #Bitcoin #BTC
NASDAQ:RIOT CRYPTOCAP:BTC MARKETSCOM:BITCOIN
$RIOT Hit The Target Whats Next?NASDAQ:RIOT hit the descending orange resistance were I took partial take profits on my trade this week and it was immediately rejected as expected.
Price is now above the weekly pivot so that is the next support. This level also matches the weekly 200EMA.
Wave (II) hit the 'alt-coin' golden pocket of 0.618-0.786 Fibonacci retracement at the High Volume Node (HVN) support and descending support line which kicked off wave (III).
A breakout above the descending resistance line bring up the the next target of the HVN and previous swing high at $18-20 and $40 following a breakout above that.
Safe trading
RIOT: Sideways is goodRIOT has broken above a very important downward channel dating back July of 2023. It is imperative that RIOT stays above the channel. The sideways consolidation while BTC and the crypto market corrects is a pretty good sign. Next week might be more of the same, maybe a bit more down to gain the momentum back for the last leg up. If we get the final move up, it will confirm a 5 waves sequence. The target would be between 2 to 2.618 extension between $18.68 to $24.33.
On the flip side, going back inside the channel would be a sign of weakness. Going back to $11 would be a confirmation of bull run end. All will depend on how the broader crypto market performs for the next 2 weeks or so.
$RIOT Continues to Follow PathNASDAQ:RIOT Is sticking closely to the plan testing the bottom and top of the channel multiple times.
Price closing above the weekly 200EMA and weekly pivot Friday will be a very bullish signal. As we have over 4 tests of the upper boundary resistance there is a high probability we break through and continue higher in a high degree wave 3.
Initial targets are the weekly R5 pivot at $39 and all time high at range at $79.
Price tested the .618 Fibonnaci retracement in a complex correction for wave 2.
Analysis is invalidated below the channel support.
Safe trading
RIOT: Do or Die timeI am going back on forth between two counts, both bullish for the time being. It is all about how wave 1 completed. I have readjusted wave 1 as leading contracting diagonal which has several impulsive moves but still in 3 waves, making things very difficult count. The May low is deep enough to be wave 2 following the diagonal. Wave 1 of 3 started off strong but the June dip was a bit too deep. Now, it is do or die time. We want to see a very strong wave 3 of 3 holding the narrow and steep channel to the outer edge of the macro downward channel. That will be the true test of the bull market. If RIOT has any chance of breaking out of the rut, it needs to have a short wave 4 and then try for a clean break. Even then, the entire move since April low would be in 3 waves. For the rest of the summer, we need to see if the price dips back into the channel or gets support on top of it and makes the final move up to give us a clean 5 waves move. By the end of this year, overall markets should also top out for the cycle and head for wave 2 of various degrees. 2026 should be very interesting if the rest of 2025 stays with the current trajectory. For now, staying long until something happens.
RIOT / 3hNASDAQ:RIOT has exceeded 12.12, which I'd considered as a validating line at the extreme high of that leading diagonal in my prior analysis. Hence, the leading diagonal as the entire wave (1) is not valid now.
Wave Analysis >> According to this adjusted wave count, wave 1 and 2, i(circled) and ii(circled) all are over, and advance in wave iii(circled) of Minor degree impulsive wave 3 is underway.
#CryptoStocks #RIOT #BTCMining #Bitcoin #BTC
RIOT / 3hAccording to the adjusted wave count in this 3h-frame, the continuous advance in NASDAQ:RIOT may be considered as an ending diagonal in the 5th wave of the one larger degree leading diagonal as wave (1), which could have remained in the late stages!
Wave Analysis >> The Minor degree wave 5 might continue to advance just to 7.7% >> 12.12 as an extreme high of the entire leading diagonal pattern as wave (1).
Trend Analysis >> The entire pattern in a leading diagonal as wave (1) quite well indicates a bullish view in the medium term, at the beginning of an ongoing UPTrend!
#CryptoStocks #RIOT #BTCMining #Bitcoin #BTC
RIOT / 2hNASDAQ:RIOT traced out the retracement in wave B in a three-wave sequence upward. Now, a 24% decline lies ahead to develop wave C as the final subdivision of the ongoing correction in wave (2).
Trend Analysis >> The trend may remain correct downward in the Intermediate degree wave (2), which will take less than couple of weeks to thoroughly develop.
The retracing down targets remains intact >> 8.20 >> 7.93 >> 7.67
#CryptoStocks #RIOT #BTCMining #Bitcoin #BTC
RIOT / 2hThe retracement up in wave B has reached the anticipated target at 10.38, although that's not traced out like a flat or zigzag formation in a three-wave sequence.
A following decline of 20% lies ahead to develop the wave C as a final subdivision of the ongoing correction in wave (2).
Trend Analysis >> The trend remains correct downward in the Intermediate degree wave (2), which will take just a couple of weeks to thoroughly develop.
The retracing down targets >> 8.20 >> 7.93 >> 7.67
#CryptoStocks #RIOT #BTCMining #Bitcoin #BTC
RIOT / 2hAccording to the NASDAQ:RIOT 's prior analysis, Minor degree wave B is retracing upward, as I'd outlined at the end of the second paragraph in the note on the chart.
Wave Analysis >> The leading diagonal in Minor degree wave A, is correcting up now in the same degree wave B which would develop in a three-wave sequence like a flat formation or zigzag.
Trend Analysis >> The trend would remain correcting downward in the Intermediate degree wave (2), which will take a few weeks to develop.
The retracing down targets >> 8.76 >> 8.20 >> 7.93 >> 7.67
#CryptoStocks #RIOT #BTCMining #Bitcoin #BTC
RIOT / 2hAs anticipated in the prior NASDAQ:RIOT 's analysis, the expected decline(7.3% intraday) as the last subdivision of the leading diagonal wave A, is quite well done.
Wave Analysis >> The leading expanding diagonal in Minor degree wave A, as the first subdivision of the ongoing correction in wave (2), indicates that a relatively deep correction in wave (2) might be thoroughly developed.
Trend Analysis >> The trend is correcting down in the Intermediate degree wave (2), which will take a few weeks to develop.
The retracement targets >> 8.76 >> 8.20 >> 7.93 >> 7.67
#CryptoStocks #RIOT #BTCMining #Bitcoin #BTC
RIOT / 2hAs anticipated in the prior NASDAQ:RIOT 's analysis, the expected decline of the diagonal's 5th wave has begun its way down, with just 8% lies ahead.
Wave Analysis >> The leading expanding diagonal in Minor degree wave A, as the first subdivision of the ongoing correction in wave (2), quite well indicates that a relatively deep correction in wave (2) might be thoroughly developed.
Trend Analysis >> The trend is correcting down in the Intermediate degree wave (2), which will take a few weeks to develop.
The retracement targets >> 8.76 >> 8.20 >> 7.93 >> 7.67
#CryptoStocks #RIOT #BTCMining #Bitcoin #BTC
RIOT / 2hNASDAQ:RIOT
The rise of 2.9% today may have completed a 4th wave correction in the leading diagonal wave A. So, a swift decline of 11% is expected to follow as the diagonal's 5th wave.
Wave Analysis >> The leading expanding diagonal in Minor degree wave A, as the first subdivision of the ongoing correction in wave (2), indicates that a relatively deep correction in wave (2) might be developed.
Trend Analysis >> The trend is correcting down in the same degree wave (2), which will take a few weeks to develop downward.
The retracement targets >> 8.76 >> 8.20 >> 7.93 >> 7.67
#CryptoStocks #RIOT #BTCMining #Bitcoin #BTC
RIOT / 2hAccording to the last analysis, NASDAQ:RIOT declined by 7.6% intraday right from the 4th wave extreme-high of an ongoing wave A, which may be considered as the fourth diagonal pattern in my 2h frame.
Wave Analysis >> The leading diagonal as Minor degree wave A indicates that a relatively deep correction in wave (2) might be developed.
Trend Analysis >> The trend is correcting down in the same degree wave (2), which will take a few weeks to develop.
The retracement targets >> 8.76 >> 8.20 >> 7.93 >> 7.67
#CryptoStocks #RIOT #BTCMining #Bitcoin #BTC
RIOT / 2hNASDAQ:RIOT has retraced up by 7.46% in total, which may be considered the 4th wave of wave A, in which five overlapping waves seem to be expanding down.
Wave Analysis >> The rising leading diagonal in wave (1) ended with a diagonal as its 5th wave inside at 10.86. Its correction in the same-degree wave (2) is underway toward the origin of the ending diagonal >> 7.93.
Trend Analysis >> The trend turned to correcting down. It might be a relatively deep retracement that will take a few weeks to develop.
The retracement targets >> 8.20 >> 7.93 >> 7.67
#CryptoStocks #RIOT #BTCMining #Bitcoin #BTC
RIOT: 3 waves moves are not good!Since the April bottom, RIOT moved up very nicely. Even since the May bottom, things were looking decent. However, the move since June 5th bottom even though we saw some strong moves, it ended up 3 waves move. Along with a lower low today June 13th, I am forced to change into my alternate count. I don't think we are looking at a series of 1/2 moves any longer. With BTC also stalling out, I am tracking the entire sequence as a leading diagonal structure. So, this means, the current correction might get deep. The first leg down has also been a leading diagonal, so I am expecting a sharp move up next week before resuming farther down. I have taken profit already and most likely take some more profit if market allows next week and have a stop loss to get kicked out if needed. I will look for opportunities along the fib retracement areas. Until $6.19 breaks, the bullish bias will still prevail. However, until the big bad downward channel is broken, bear case is not fully gone.
