RIOT Short strangle, $2.22 creditFEB 18 STO 15 P
FEB 18 STO 26 C
POP 71%
Delta -14.58
P50 83%
Theta 5.539
M Profit - $223
M Loss - Infinity
B.P. -$1413
ROC 17.9%
RIOT trade ideas

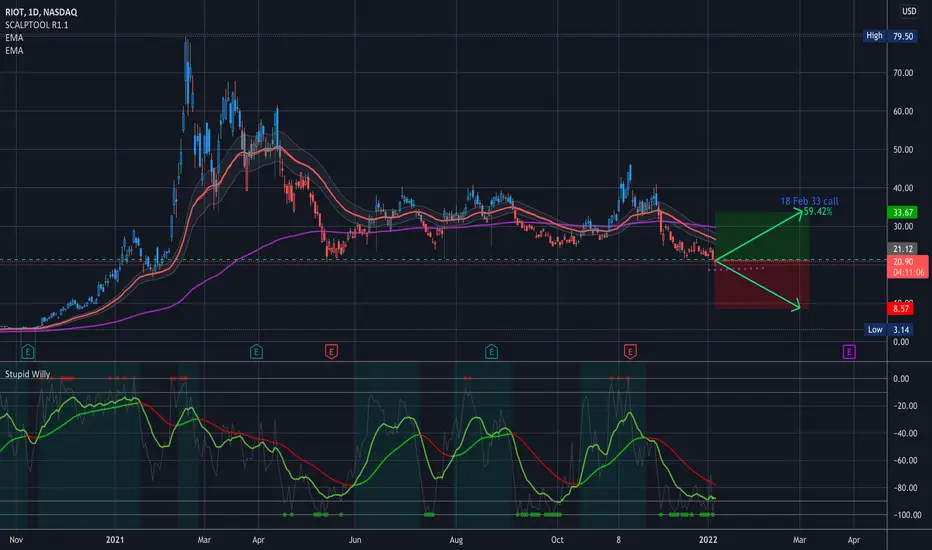
New Position $RIOT Target 33.67 for 59.42%New Position $RIOT Target 33.67 for 59.42%
New position @ 21.12… looking for 33.67 for 59.42%
RIOT going to May low?RIOT blockchain is one of the biggest publicly traded bitcoin mining operations and are approaching the lows we saw in May earlier this year, after breaking through support at $23. This is an attractive price to get in on for a long position. In the short term,if it reaches the may low, might see a retracement to 0.382 fib level

Double Bottom(Not Investment Advice)
Riot is showing a double bottom on the weekly chart. Riot has finished off 2021 lower than expected in the way of price action, Riot has accumulated large amounts of BTC and is focusing on growing further. The fact they have not offloaded BTC in the past year is a buillish sign for potential higher prices in the future, will this big play have a big pay day? only time will tell.
Riot breaking through $20 on the downside may provide a potential short opportunity however across the long term Riot is looking strong while going through sideways action.
(Not Investment Advice)

RIOT diverges from BTC and should reverseThis is my first idea I'm publishing to TradingView, so I'm eager to hear your thoughts/criticism.
The premise starts by stating that RIOT is highly correlated to BTC/USD, given how the business model is BTC mining that seems fair. As such, with the recent increase in BTC/USC RIOT has gained also, but sometime on Feb 9th it started diverging from BTC/USD and has only increased the divide since then. Why? There hasn't been a single catalyst coming from inside the company and it doesn't hold any BTC and is a money losing operation while trading at 1288 times last quarter's earnings. So my guess is that there's no reason to sustain this diverges and thus we'll go down from here.
I'm not going to say it's going bankrupt, but it should revert back to being tightly correlated with BTC/USD.
My prediction/guess - it reverts back to $33/share level.


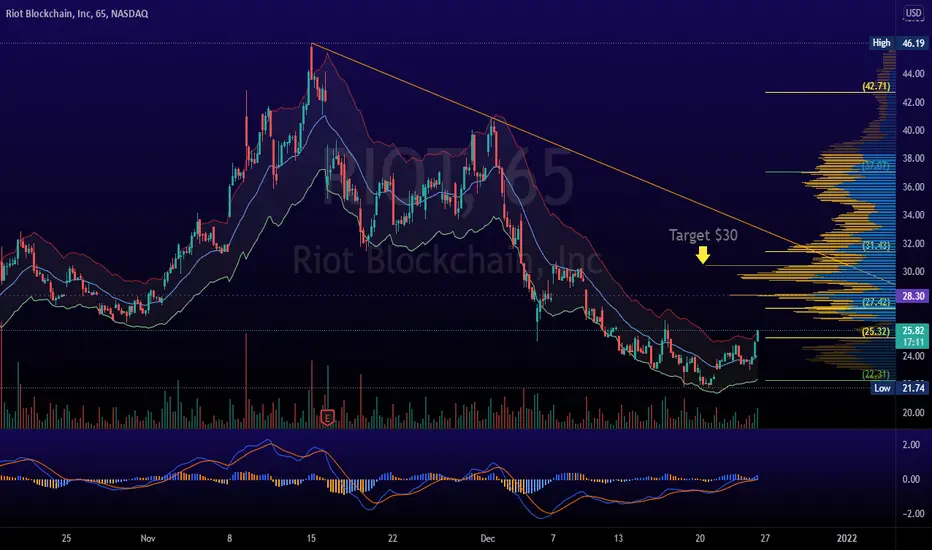
MARA Christmas Run to $30Get ready for all the FOMO to kick in these Crypto Stocks during the holiday mood to kick in.
Target-1 $30
Target-2 $34/$36
RIOTLONG-TERM: Bullish shark, wedge breakout, 4hr classic bullish divergence, bounce off historical support zone. (not financial advice)

wedge completed confirmed by technical divergence wedge completed confirmed by technical divergence , I anticipate a bounce to $26 tomorrow and a bounce to $29 to $33 by friday or next week.

RIOT/BTCUSD Beta Hedge In regards to my last posting, which explains this idea and the logic grounding it , I just wanted to publish this spread chart for RIOT/BTCUSD as I think it's important .
The idea is that a short on bitcoin can be hedged by buying an equivalent dollar amount of RIOT , which acts as a beta hedge here .
Please give the initial publication titled "BTCUSD How to reduce risk while shorting using beta hedging" a read if you have not and are interested in this idea. It is much more detailed and it is linked . This is meant to supplement it only . I have attached the prior posting mentioned to this publication .

28-28.50 should come fast28-28.50 should come fast, shooting below the trendline depected around 28-28.50 shouldn't have happened, there was manipulative selling causing a bull wedge and a short squeez to revert is underway (evidenced by a daily bullish piercing close) - We should be at 30 right now, I think we get back up to 28-30 quickly, my sell target zone before a reanalysis is 34 to 38

short term long RIOT levels with sell target zone 34 to 37short term long RIOT levels with sell target zone 34 to 37, line in the sand zone where I begin buying put options probably towards the end of December 2021 will be 37 to 40, long until 34, hold from 34 to 40

Short term bounce towards 40 coming possible short term bounce towards 40 coming , obvious manipulation to keep this down, between that old hag warren buffet down-talking something he has no clue about and inflating Apple Stock, to Wall Street downplaying Crypto - there's an obvious agenda but I see a bounce soon nonetheless

load up now load up now hold until 39/40 or sell atr 33 and buy back at 30-31 and hold again until 39/40

riot bACK INT HE BOTTOM OF CHANNEL LOOKING FOR PROPPby 1 and half months out in the MMMM cAll BBBAAABBBYYY

$RIOT breaking key resistance level. Road to ATH? I believe if this week manages to close candle above 40$ level, it will go to ATH.
It has been consolidating for months on a wide range, so the breakout alongside $BTC could be huge and fast.
With earnings next week and BTC trying to break ATH level it seems a pretty interesting trade to hold on year's end bull run.
I will buy some shares on Friday depending on price action, and Monday will add some weekly 40$ calls if BTC shows strength during weekend.
NOT FINANCIAL ADVISE.

Break below the invalidation level will Negate the bullish biasFollowing the high in mid February the price action have been majorly sideways. From Elliott perspective, triangles are sideways movement that are usually followed by a thrust once completed traveling approximately the widest part of the triangle when project backward. We have an initial five wave rally to traded above the extreme of D and have ultimately been corrected in three wave sequence taking the shape of ziggzag and equality have also been met. In the chart, I have provided an invalidation level which according to Elliott wave two cannot retrace 100% of wave one. If this interpretation is correct, the uptrend should resume.

RIOT on the tunnel make some riot!As it looks from here there will be a consolidation on the 28-29,
Then we will take off to new horizons.
*Not a recommendation, do your own due diligence.

RIOT about to EXPLODE!! HUGE Pennant with Upside TP = $102Entry at open $28.09, SL = $23.23, TP= $102. EXTREMELY LOW RISK TRADE and HUGE UPSIDE. Willing to Risk 2% on this trade because of I am wrong I only lose 2% but if I am right this trade has potential to 360% Return. This trade reminds me of BTC trade I took last year around May with nearly identical setup but that was on the weekly chart. This trade is on Daily chart.
HUGE Pennant with already a weak breakout and rising MACD about to cross ZERO line on multiple time frames from 8 hour, 3D, Weekly. BULLISH slope to MACD with breakout of downtrend on MACD as well as smaller Pennant (Bright yellow trendline) appears to be ready to explode higher out of larger Pennant (tan dashed trendline). Price is also at MAJOR SUPPORT.

Let's make a deal!The paper began an upward movement after a correction due to the fall of bitcoin. This company works very closely with the cryptocurrency sphere. Expected upside: +40%. The first downside is $44-46. It is better to put a stop to Breakeven
❤️ If you find this helpful and want more FREE forecasts in TradingView
. . . . . Please show your support back,
. . . . . . . . Hit the 👍 LIKE button,
. . . . . . . . . . . Drop some feedback below in the comment!
❤️ Your Support is very much 🙏 appreciated!❤️
💎 Want us to help you become a better Stock trader?
Now, It's your turn!
Be sure to leave a comment let us know how do you see this opportunity and forecast.

RIOT! Swing Riot is holding pretty good.
It might reach previous resistance. Good R/R. MARA having the same swing trade set up. Check our previous post.

Breakout Coming in Riot Blockchain?Bitcoin miner Riot Blockchain hit a seven-month high in mid-November. It pulled back sharply and now may be attempting a breakout.
The first pattern on today’s chart is the price zone around $38. This is the roughly the spot where RIOT peaked in June and August. It’s also served as the top since November 16.
Next, the 200-day simple moving average (SMA) is in the same area. (Because RIOT’s historical volatility is above 100 percent, these levels are looser than we’d normally see.) The confluence of this key SMA and old peaks potentially increases the importance of this zone as resistance.
But will it hold? Notice the inside candle on Friday and a bullish outside bar yesterday. That may trigger some alerts for traders today.
Next, notice how the 8-day exponential moving average (EMA) has remained above the 21-day EMA throughout the recent period of consolidation. That may suggest its short-term bullishness remains in effect – despite Bitcoin’s recent tumble.
Finally, RIOT is down about 50 percent since mid-February – despite Bitcoin being little changed over the same period. If cryptocurrencies continue to stabilize and bounce, that price difference could also potentially revive sentiment toward the stock.
TradeStation is a pioneer in the trading industry, providing access to stocks, options, futures and cryptocurrencies. See our Overview for more.
Important Information
TradingView is not affiliated with TradeStation Securities Inc. or its affiliates. TradeStation Securities, Inc., TradeStation Crypto, Inc., and TradeStation Technologies, Inc. are each wholly owned subsidiaries of TradeStation Group, Inc., all operating, and providing products and services, under the TradeStation brand and trademark. When applying for, or purchasing, accounts, subscriptions, products and services, it is important that you know which company you will be dealing with. Please click here for further important information explaining what this means.
This content is for informational and educational purposes only. This is not a recommendation regarding any investment or investment strategy. Any opinions expressed herein are those of the author and do not represent the views or opinions of TradeStation or any of its affiliates.
Investing involves risks. Past performance, whether actual or indicated by historical tests of strategies, is no guarantee of future performance or success. There is a possibility that you may sustain a loss equal to or greater than your entire investment regardless of which asset class you trade (equities, options, futures, or digital assets); therefore, you should not invest or risk money that you cannot afford to lose. Before trading any asset class, first read the relevant risk disclosure statements on the Important Documents page, found here: www.tradestation.com .

Riot is very bullishIt should be making a move jump up to this trendline. Opportunity to make alot of money here. It should be making this move within the next week or so.
