$RIVN Ready for the next move?? I'm long here but it could just as easily breakdown. The reason why I'm long is because we are in an uptrend and the chart pattern looks bullish (to me) . The risk is a little higher here because of the 50/50 chance it goes either way, pay attention and keep your stop loss TIGHT.
RIVN trade ideas

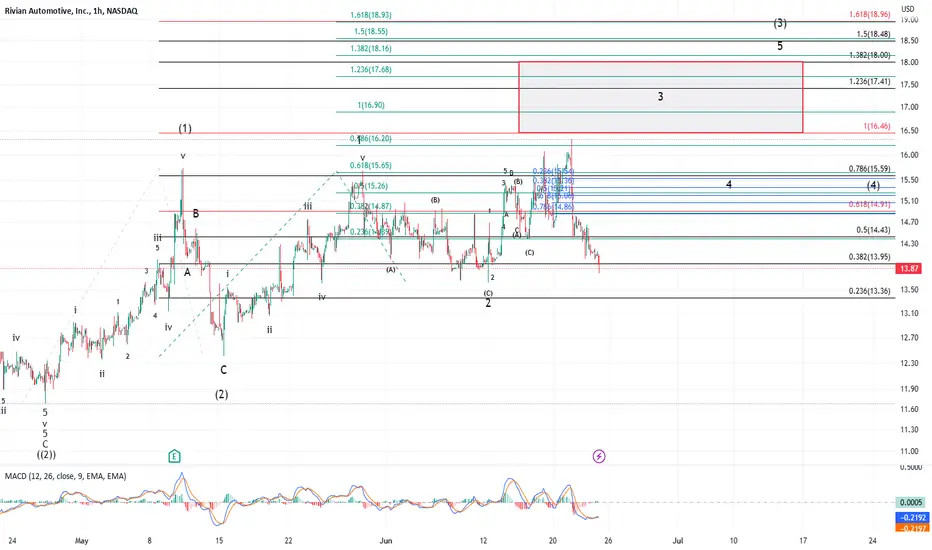
RIVIAN looking for Wave 4- We have seen a massive explosion in this W3 recently, but looking to cool off into the W4 before we take off again into the W5. If we do not break the blue resistance lines we should already be in the decline into W4 where I have put the Fibonacci levels for the W4.

$RIVN LOOK AT THE VOLUME Notice the volume this week already at it's MA and it's only Monday! I think this stock hits at least $30 next week. However, just be mindful that the stock moved nearly 50% (on ~500X volume) last week, so some cooling off may be needed.

$RIVN: Long & movement into Phase CNASDAQ:RIVN
I would treat all EV stocks at the moment with a degree of caution as theres been plenty of recent microeconomic movements between companies.
From a technical aspect, we had just experience a leg down into Phase A and currently accumulation for institutional buyers are taking place. Think of you at a Supermarket buying food at bulk price. Over the last 2 weeks, Volume has picked up three fold and buyer's momentum is shifting and coming in.
ST SOW was clear, (Secondary Test: Signs of Weakness) where we broke support and rapidly bounced right back. So currently in Phase B we are awaiting a long to higher highs around Phase A AR/UT before heading back low to a potential spring across the creek. Looking forward. Have set my limits into areas just above green OBs so we are looking very ready and with good indicators in place.
Will be picking up the stock for Long term when it clears the ST SOW levels so for long term holders, I believe we can hold out slightly longer.

Ravian stock is starting to rebound and rise!Ravian stock is starting to rebound and rise!
This chart shows the weekly candle chart of the Rivian stock since its listing. The top to bottom golden section is superimposed in the figure. As shown in the figure, the recent low point of Rivian stock is supported by the 2.000 level of the golden section in the figure. In the past two weeks, Rivian stock has shown a bullish start! So in the future, the probability of the Rivian stock rebounding upwards to the 1.618 and 1.382 positions in the golden section shown in the figure, after a long rest, and then choosing a direction to break through!

Rivian Automotive NASDAQ: RIVN RIVN on an uptrend based on news that has starting electric vehicle deliveries chart is very bullish

$RIVN took off this week This week been super bullish for this week and guess who was in the race NASDAQ:RIVN but like all good things must come to an end and cool off with a Bearish herami on the 4hr chart I would like to see a pull back to the 61% fib

Rivian found support at its Tangible Book Value - key metricRivian is still a young company trying to prove its model can make a profit. They have a pile of cash and along way until they can break even in their business model.
Tangible book is all tangible assets minus liabilities. Tangible meaning physical and cash like assets but not including intangible like brands and patents.
Tangible assets may also be a better measure of liquidation value.

RIVN Short IdeaRIVN short trade. Reached monthly highs. Would short down to previous resistance.
Long term bullish on Rivian.

RIVN - could break up in near futureRIVN went into basing formation since March 2023, testing the level 15.60 (neckline1) at least 4 times before a successful break up on 29 June, followed 2 days later by a huge volume gap up 3rd July. As of yesterday it closed right at the 2nd neckline @ 21.70, which incidentally is just above it's 200 day moving average (a positive).
It's RSI is very strong and there is a reasonable chance it could be breaking above this neckline2 very soon (scenario 1 indicated in red). However, as it is also rather overbought at the moment, we could see another pullback before another attempt to break up (scenario 2 indicated in blue).
Long the break of neckline 2 with initial stop loss below 19.30 (the recent 2 candles low).
The market is volatile and trade management with trailing stops is a good idea. Balancing between how much wiggle room to give it (ie where to place the stop loss) will take some practice and experience.
Disclaimer: Just my 2 cents and not a trade advice. Kindly do your own due diligence and trade according to your own risk tolerance and don't forget that money management is

Rivian Update: Wave 3 Almost Done?I'm not going to spend much time on this as it is pretty self-evident by my chart. The suuper long wave (2) threw me for a loop as I was not expecting such a long-drawn-out ABC and it made me miss this entire move up from the $13 area. It is what it is though and I have been doing just fine elsewhere. I was planning on jumping in on the retrace and riding out the end of 3 but price didn't make it down to me. Also, I want to note that (3) extended passed 3 extra fib lines. This means that all other targets will be extended out as well. Structure states that we finished wave (4) very fast, which would make sense since wave (2) was so long.
I would expect this wave ((3)) to finish around $22-$25. When it begins to retrace for wave ((4)), I will hopefully have an opportunity to jump back in. However, I don't chase price so it will either come to me or I will stay out. It is the best way I have found to fight FOMO. I NEVER get into a trade unless I have done an analysis beforehand and price comes into my buy zone.
If I make any trades, I will update y'all.
Bonam Fortunam,
--Tyler

Long RIVNHonestly i think they are ugly but have seen 5 Rivns in my area the last few months. Pretty epic IHS pattern forming.... Been DCAing last 3 months...Adding here.

RIVN breaking into value for the year; Huge upside potentialAs RIVN tries to break into value for the year (above $20) it signals the 80% rule meaning there's an 80% chance that it goes to the top of value ($52). Representing more than 100% gain potential in the name. Will keep watching for a hold of the bottom of value.

RIVN LIFT OFF!RIVN forming a close to perfect Head and Shoulders pattern that is quite large, there is also a secondary ascending triangle pattern which is a bullish pattern. Not much resistance all the way up, potential 35% gain.

$RIVN EV Stocks Winners & LosersWhile Rivian Automotive, Inc. (NASDAQ: RIVN) is currently seeing good Q2 performance after exceeding its estimated Q2 deliveries and signing an agreement with Tesla (NASDAQ: TSLA) to use its charging network. However, RIVN stock may be currently overvalued compared to other EV stocks following its 17% run after Tesla (NASDAQ: TSLA) started a rally in the EV market on its record Q2 deliveries. Given the tough competition RIVN is witnessing and its poor margins, investors could find RIVN stock a profitable short play.
RIVN Fundamentals
Exceeding Expectations
Although RIVN is currently seeing a decent Q2 in terms of deliveries, it still has a long way to go to prove that this will not be a one-time thing. RIVN produced almost 14,000 vehicles in Q2 putting it on track to achieve its 50,000 production target for the year. Also, RIVN delivered 12,460 vehicles, 10% more than the forecasted 11,300 deliveries, which may see it exceed its forecasted revenue for Q2.
Furthermore, RIVN may see increased deliveries in 2024 thanks to its agreement with Tesla to provide RIVN drivers access to Tesla’s charging network starting in 2024. The new agreement will increase RIVN’s coverage in the US which can increase demand since one of the biggest concerns for new EV customers is network coverage.
Market Overreaction
With Tesla’s record Q2 deliveries, a strong rally in the electric vehicle market started. While RIVN’s positive Q2 deliveries improved the stock’s outlook, Tesla’s record Q2 deliveries were a major reason for the 17% run. The combination of the two events created the perfect storm for RIVN stock, which may have led to the market overreacting resulting in RIVN stock’s recent run.
Compared to Polestar (NASDAQ: PSNY), which expects to produce 80,000 vehicles in 2023, 60% more than RIVN’s production target, Polestar also has a far better gross margin of 3% compared to -80% for RIVN, which means that RIVN is losing money on every vehicle it sells.
Furthermore, Polestar is closer to profitability than RIVN since it reported a net loss of $9 million only in Q1 2023 compared to RIVN’s $1.3 billion net loss. With all of that combined, it is hard not to see RIVN stock as overvalued compared to other EV stocks since RIVN’s current market cap of $18 billion is more than double that of Polestar. For this reason, investors could find better opportunities in other EV manufacturers than RIVN.
Another reason RIVN’s prospects may not be as bright as investors believe is the competition the company is facing from more established manufacturers in the electric truck market – namely General Motors (NYSE: GM) and Ford (NYSE: F). With this in mind, Ford has already released an electric version of the Ford F-150, the best-selling truck in the US. In this way, it might be harder for RIVN to take hold of the market, since customers are more likely to choose more reliable and familiar names if they chose to transition to an electrical truck.
RIVN Financials
In its Q1 2023 report, RIVN’s assets increased 1.5% QoQ from $17.8 billion to $18.1 billion, while its cash and cash equivalents decreased 2.7% QoQ from $11.5 billion to $11.2 billion. RIVN’s total liabilities increased by 35% QoQ from $4 billion to $5.4 billion.
Revenue has increased 695% YoY from $95 million to $661 million. Operating costs decreased more than 16% from $1,077 million to $898 million, which contributed to the operating loss decrease of 15% YoY from $1.58 billion to $1.34 billion. In this way, RIVN reported a net loss of $1.3 billion – a 15% increase YoY.
Technical Analysis
RIVN stock’s trend is neutral with the stock trading in a sideways channel between $15.78 and $13.31. Looking at the indicators, the stock is trading above the 200, 50, and 21 MAs which are bullish indications. Meanwhile, the RSI is extremely overbought at 94.8 and the MACD is bullish. It is worth noting that the stock has broken its $15.78 resistance leaving behind a gap near $16.7 which may be filled in the future.
As for the fundamentals, RIVN stock just witnessed a catalyst in its Q2 deliveries exceeding analysts’ expectations. Despite this, RIVN could be overvalued at current levels given its fundamentals which could see the stock drop and test the $13 support level – filling the gap on the chart in the process – especially with the RSI extremely overbought at the moment.
RIVN Forecast
It is undeniable that RIVN is having a great quarter, with it exceeding its delivery target for Q2 and being on track to achieve its 2023 production target. That said, RIVN stock may be trading at a premium compared to other EV stocks since its market cap is more than double that of Polestar, which is currently outperforming RIVN in many areas. Furthermore, RIVN may find difficulty growing its market share since it faces tough competition from companies like Ford and General Motors. All of that makes RIVN stock overvalued and may be due to a correction soon – making it a potentially profitable short play.

RIVN RIVN has been playing well in this channel and with the last lower low spring up bounce at the base of the channel made a nice retest back up to its supply zone at this upper range of this channel. There is a little potential flag Im watching for in this range to retest if we can maintain above 15.79. I set the grey zones over under the channel as a melt up and accumulation dip buy zones if it hits those ranges.
This accumulation bounce if we maintain this mid level on the bounce can create a nice run up potential to the 19.68 range IF we get through the grey zone. This is a play out till July 31 to Aug 14.
I will be watching this chop zone and the ABC Correction before looking at the entry at 14.57
Enjoy the education this is all theories not to be taken as financial advice.

RIVIAN: Buy the next pull backRivian Automotive is on the 0.5 Fibonacci level, approaching the top of the 2 month Channel Up with the 1D technicals on solid bullish levels (RSI = 61.905, MACD = 0.260, ADX = 28.294). We will short on the first red 1D candle and target the 1D MA50, where we will open a buy again. The target will be R1 (TP = 17.75). The long term trend on RIVN remains bearish though, we want to see a steady close above the 1D MA200 to buy this for the long term. Noticeably the RSI has been on a Bullish Divergence since the start of the year.
## If you like our free content follow our profile to get more daily ideas. ##
## Comments and likes are greatly appreciated. ##

RIVN - Rising Trend Channel🔹Broken through the floor of a rising trend channel in the short term.
🔹inverse head and shoulders formation.
🔹POSITIVE signal with 15.02 resistance breakout, NEGATIVE with opposite formation reject.
🔹Between support 14 and resistance 15.6.
🔹Volume correlate with price up and down.
🔹Technically POSITIVE for the short term.
Chart Pattern;
🔹DT - Double Top | BEARISH | 🔴
🔹DB - Double Bottom | BULLISH | 🟢
🔹HNS - Head & Shoulder | BEARISH | 🔴
🔹REC - Rectangle | 🔵
🔹iHNS - inverse head & Shoulder | BULLISH | 🟢
Verify it first and believe later.
WavePoint ❤️

June Gainers (RIVN, account up 4.83%)11th trade in June is NASDAQ:RIVN .
Holding period is 0 day.
Account is up 4.83%.
Total return in June is 15.04%.

RIVN - Bullish PitchforkThis is what I am seeing on RIVN, looks very bullish. this pull back was a buying opportunity imho.

RIVN ShortTrade idea for RIVN. If we break resistance and bounce take long to around $17.78 or if we reject at resistance I'd look to short to around $13 area.


Rivian Update: Count Invalidated?As y'all have been seeing, Rivian was playing really nice, hitting all the standard targets, and then all the sudden started to break down. Rather that was the news they were removed from the NASDAQ-100 or something else, it didn't follow through. The only bull count I see left is a leading diagonal into our wave (3), which is extremely unlikely. Diagonal's are so unreliable and for a wave 3 of any degree starting as a leading diagonal...I just don't think it is likely at all. Nonetheless, it is still possible, so until we invalidate it I'll leave it on the chart.
A breach of $13.62 officially invalidates this count and means it was most likely another wave 4 of the C wave it was in.
Whenever we get some more information that I can use I will track Rivian again. Until it starts to paint a more clear picture though I am not trading it. Rivian has a lot of stuff going for it right now. It also has a lot of bad going on with its revenue. Can they pull out of this and be successful?? Imagine how they would have fared had we not had COVID, and the supply crunch that destroyed a lot of businesses. The fact that Rivian has pulled through thus far and is still planning their expansion (plant) into Georgia, gives me great confidence in their future. I don't trade on hopes though, I trade on facts. So for now, I will avoid Rivian.
Bonam Fortunam,
--Tyler