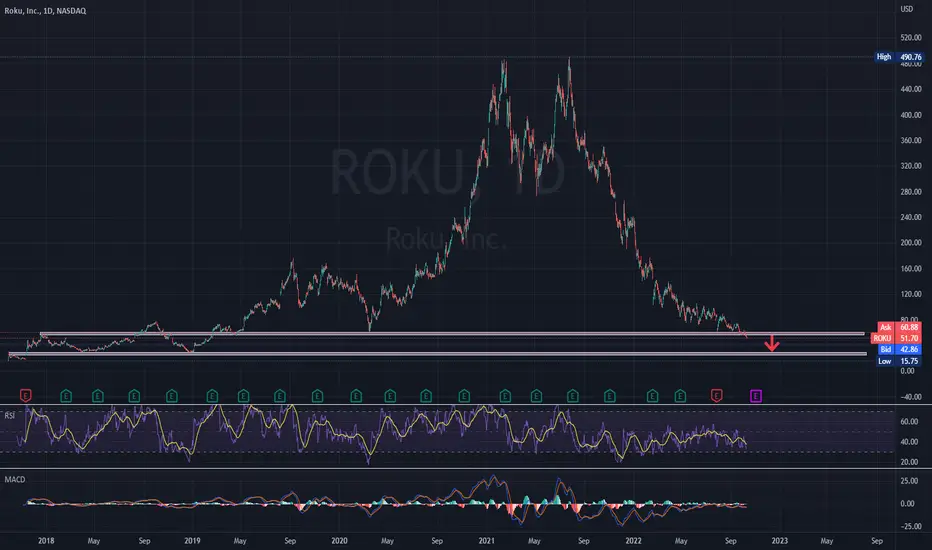
LONG - based on RSI and failed breakdown on weekly$ROKU
Started to look good. After $NFLX ER, ROKU started to have change in dynamics and price action.
Holding crucial levels, tried to come out of failed breakdowns and nice RSI is showing nice signs of being high since Nov-Dec 2021.
I am long $ROKU as far as 49-50 level holds.
$ROKU is still below covid lows but i think this is worth a risk reward here unless 49-50 level is lost
ROKU trade ideas

ROKU PANDEMIC BUBBLE now near fib bottom supportROKU PANDEMIC BUBBLE now near fib bottom support
COMPANY HAS BEEN MAKING MONEY so.....
a leap put sale at $130 after fed news is a nice safe trade DYOD

ROKU LongRSI divergence
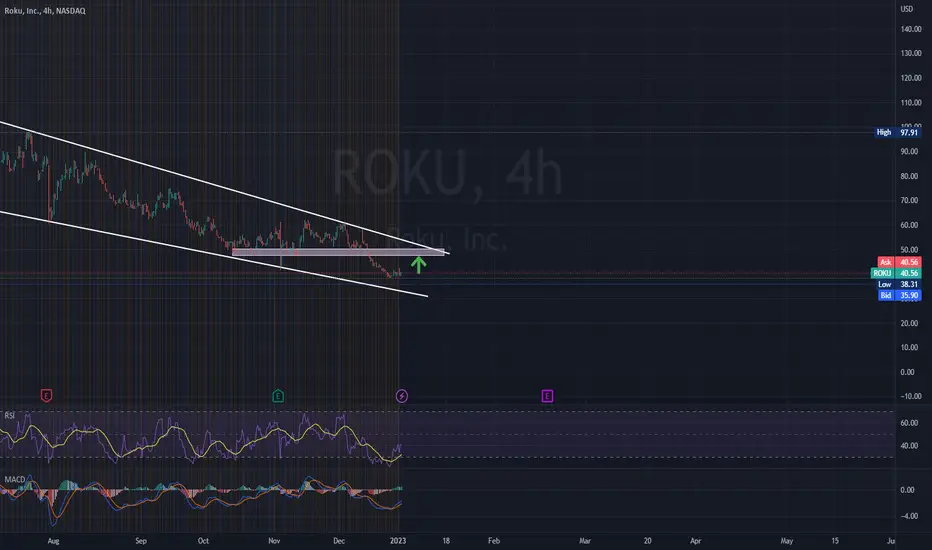
Wedge breakout + retest
Earning 11/2/2022 Est. -0.88
Entry 54
Stop 45
Target 85
Risk management is much more important than a good entry point.
I am not a PRO trader.
In my trading plan, the Max Risk of each short term trade should be less than 1% of an account.

ROKU short ideaROKU potential short play
Nasdaq listed stock Roku shares dipped 1.8% in pre-market after Truist downgraded the company to a hold from a buy rating, saying that the streaming stock is hypersensitive to a tough macro environment given that a large chunk of revenues are tied to advertising.
Do people even use ROKU, we think it the offering is pretty lacklustre to be honest, a short for us.
Price action subject to a breakout from this flag pattern after running into resistance in the early $50 territory.

ROKU setting up a SHORT TRADE ROKU double topped on November 14 and December 2 and then dropped in a downtrend
until 12/28 and reversed. The mid Fib levels of the retracement a drawn onto the chart
are being approached.
I look for ROKU to bounce down off the Fib Level at 52. 2 and drop to approach the SMA 200 ( Red Line)
after first crossing under the SMA 100 ( Blue Line ) and then to the POC line of the volume profile
where buyers should take over and support price. Overall three targets ( SMA 100, SMA200, POC)
and a three tier take profit scheme for a very conservative trade.

ROKU Reaching an Inflection PointI recently started looking at Fibonacci arcs and circles. I see them as something similar to support and resistance lines. Charts have an uncanny way of touching support and resistance lines. I've drawn arrows where the chart touched or came very close to touching the two circles I drew.
I noticed that ROKU is very close to reaching an inflection point where the circles intersect around January 30th. The lower circle also intersects with a support level of 26.64 around March 7th. I've labeled this the Inflection Area. After reaching this area, the price action could head much lower or even higher. I'm not saying that to make sure I'm not wrong, I'm saying it because I don't know. The major bearish double-top pattern from 2021 may have reached the end of its influence, but I think ROKU will reach the support level of 26.64 at least. After that is anyone's guess.
Disclaimer: I am not a financial advisor, and the above statements are not investment advice. My comments are only intended for educational purposes. You are solely responsible for your own trading decisions.

ROKU - BULLISH SCENARIOIt was a difficult year for Roku whose stock lost more than 90% of its value amid worsening macroeconomic headwinds, such as rising interest rates, and soaring inflation.
Roku shares have become extremely attractive after the massive selloff this year, given its impressive active account growth, and improving monetization of existing and new users.
A short-term bullish scenario is expected.
The 1st resistance level is located at $50.
Risk Disclosure: Trading Foreign Exchange (Forex) and Contracts of Difference (CFD's) carries a high level of risk. By registering and signing up, any client affirms their understanding of their own personal accountability for all transactions performed within their account and recognizes the risks associated with trading on such markets and on such sites. Furthermore, one understands that the company carries zero influence over transactions, markets, and trading signals, therefore, cannot be held liable nor guarantee any profits or losses.
52wk low incoming to $30 - huge short opportunity Expecting a short technical bounce before the continuing collapse of $ROKU stock

$ROKU calls near $48.65Roku has made HIgher highs since November 1 , there is liquidity stacked up near $62 loos like we should tap into this lower OB so it can take out that liquidity and finish the trend.


ROKU Long IdeaBuy Roku low and sell it high.
Roku is presently sitting at the near bottom of the recent volume profile
and above the POC line for support. On the 15-minute chart, levels are
marked out for a stop loss and a three-tiered take profit. This will be about
a 15% upside depending on the proportions of the take-profits.

ROKU Bottom Formation: Dark Pool Buy ZoneROKU is a good example of a high-risk sell short. The HFT gap was reversed the same day. You are looking at a Dark Pool BUY ZONE. Accumulation/Distribution confirms a shift of sentiment even as this stock turns down at a bottoming resistance level which is NORMAL and expected.
The company reports earnings for the holiday season in mid February. This makes for a common timeframe for a bottom formation's base to develop.

Recap : QuickTrade 198 : ROKUThe price triggered the bullish level and moved to the target and higher
Max DD 0%
Top Performance +3.76%

ROKU monthly despair phase of bubble cycleStop loss $0 take profit $453.92
ROKU monthly despair phase of bubble cycle

ROKU | LongRoku is one of Cathie Wood's holdings. I think in the short run ARKK could have some bullish movements. this could lead Roku to test 70th level

ROKU Inc Options Ahead of EarningsIf you haven`t shorted the Double Top Bearish Chart Pattern:
or the Q2 earnings:
then you should know that looking at the ROKU Inc options chain, i would buy the $50 strike price Puts with
2022-11-4 expiration date for about
$3.35 premium.
If the options turn out to be profitable Before the earnings release, i would sell at least 50%.
Looking forward to read your opinion about it.

oh wow ROKU1. below monthly
2. below weekly
3. massive gap below yesterdays close
can we retest any price action
OR
do we fill an old weekly gap

pre-market idea for ROKU1. i like this gap over friday
2. above weekly
3. will take targets at monthly

tiny gap downi would have like this to have gapped down more...but i think we see continuation down with two possible targets


daily moveslets see if we can move up in this range - we're still under alot of pressure (zone above and 10-20-50 EMA)...take plays quick

we've been here beforeon a weekly chart - you can see the last two time we've rocketed out from here...and on daily we had a hammer of thor..so i'd take plays above yesterdays hammer

ROKU - BEARISH SCENARIOBig troubles for Roku inc. For the past 14 months, the tech company is in a downtrend which caused a loss of almost 90 % of its stock price. The trend seems to be irreversible after the price broke the $ 62 support level on Monday.
The next major support level is located around $25.
Risk Disclosure: Trading Foreign Exchange (Forex) and Contracts of Difference (CFD's) carries a high level of risk. By registering and signing up, any client affirms their understanding of their own personal accountability for all transactions performed within their account and recognizes the risks associated with trading on such markets and on such sites. Furthermore, one understands that the company carries zero influence over transactions, markets, and trading signals, therefore, cannot be held liable nor guarantee any profits or losses.