SPY Macro Wave Outlook – Bullish Fifth Wave into AI Supercy📈 SPY Macro Wave Outlook – Bullish Fifth Wave into AI Supercycle?
🧠 WaverVanir DSS | VolanX Protocol | Institutional AI Alignment
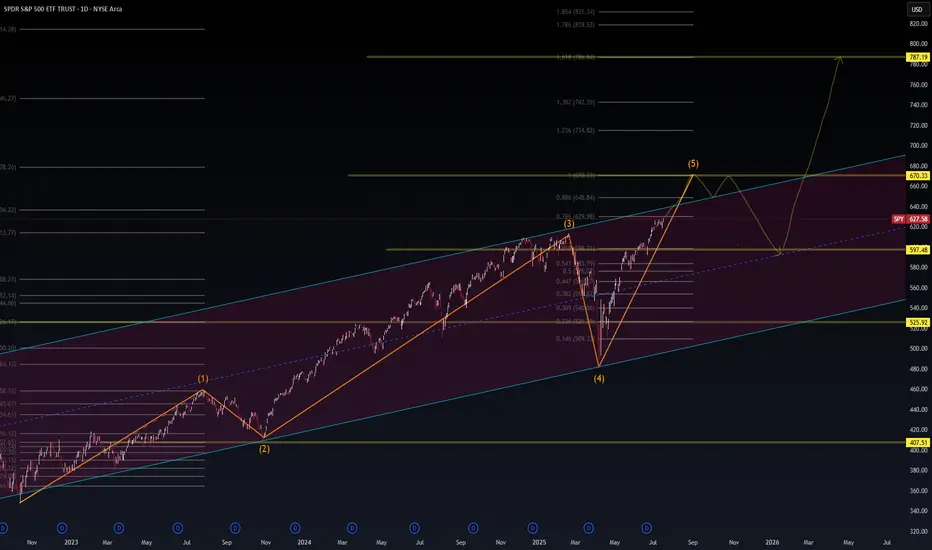
The SPY rally appears to be unfolding within a 5-wave macro impulse, currently inside Wave (5) targeting the 670–787 zone, depending on macro alignment and Fed behavior. This structure converges with long-term Fibonacci clusters and macro transition signals.
🔍 Thesis:
Wave (5) in Progress – Next resistance seen at ~670.33, followed by long-term targets near 787.19.
Pullback Scenario – A temporary correction into the 597–600 range is possible before further upside.
Structure Validity – Channel and Fibonacci extensions confirm bullish continuation unless macro conditions deteriorate sharply.
🧠 Macro Alignment Required:
Fed Pivot Late 2025 → Probability: 60%
Earnings Growth Led by AI → 11% projected for S&P500 (GS)
Productivity > Consumption → AI-led industries showing 5%+ labor productivity growth (Dallas Fed)
Low Inflation Reacceleration Risk → Core PCE stabilization key
⚠️ Risk Matrix:
Macro Risk Probability Notes
Fed Hawkish Reversal 30% Data-dependent but unlikely unless inflation re-flares
AI Concentration Shock 25% Tech-heavy rally, breadth remains a concern
Valuation Compression 20% Shiller CAPE near 37
Trade War Reignition 15% Tariff risk remains a geopolitical tail
🎯 Target Zones:
Near-term: 670.33 (Wave 5 peak)
Medium-term: 714–787 (Fib clusters)
Correction Zone: 597–600, invalidation below 525
The AI economy is accelerating—productivity is now outpacing consumption in several sectors. This macro regime shift could be the foundation for the next secular bull wave.
🔺 Powered by VolanX Protocol
⚠️ Not financial advice. Educational chart generated by institutional DSS models.
#SPY #VolanX #WaverVanir #ElliottWave #MacroTrading #AIProductivity #Fibonacci #FedPivot #USEquities #TradingSignals #SmartMoneyConcepts #InstitutionalStrategy #AIInvesting #SP500
SPY trade ideas
Double Bull Flags on an Ascending Triangle breakout on the dailyDaily, double Bull Flag, on top of an Ascending Triangle Breakout. Golden Pocket on the Fib Ext is $588 🥂

Stock Market Forecast | TSLA NVDA AAPL AMZN META MSFTStock Market Forecast | CME_MINI:NQ1! CME_MINI:ES1!
Mag 7 Forecast | NASDAQ:TSLA NASDAQ:NVDA AAPL AMZN META MSFT GOOG

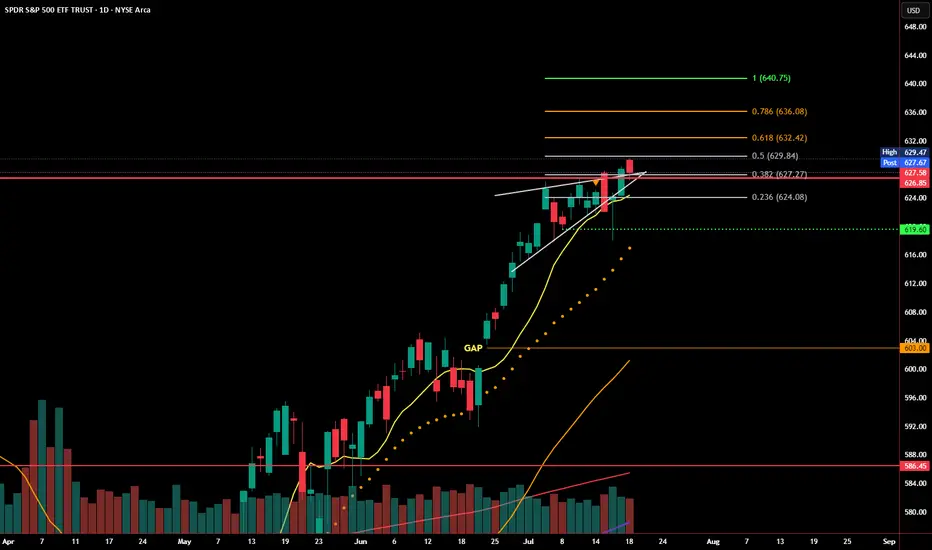
SPY Reclaims Rising Wedge Support - Bear Trap or Breakout Setup?SPY dropped below its rising wedge earlier this week, but that move may have been a bear trap. Price quickly reversed, reclaiming the wedge trendline and closing just below a key Fibonacci level at 629.84.
Buyers stepped in aggressively near the 0.382 and 0.236 retracement zones, defending short-term support. The bounce came on increased volume, signaling strength behind the recovery. Momentum remains intact as long as SPY holds above 626.
Now, bulls need to confirm with a breakout above 629.84–631.96 to open the door to the next levels at 635.63 and 640.30. Failure to break through could lead to another rejection and revisit lower support zones.
Levels to watch:
Support: 626.64, 623.62, 619.60
Resistance: 629.84, 631.96, 635.63
SPY is at a decision point. Reclaiming wedge support is a bullish signal, but bulls need follow-through to avoid another fakeout in the opposite direction.
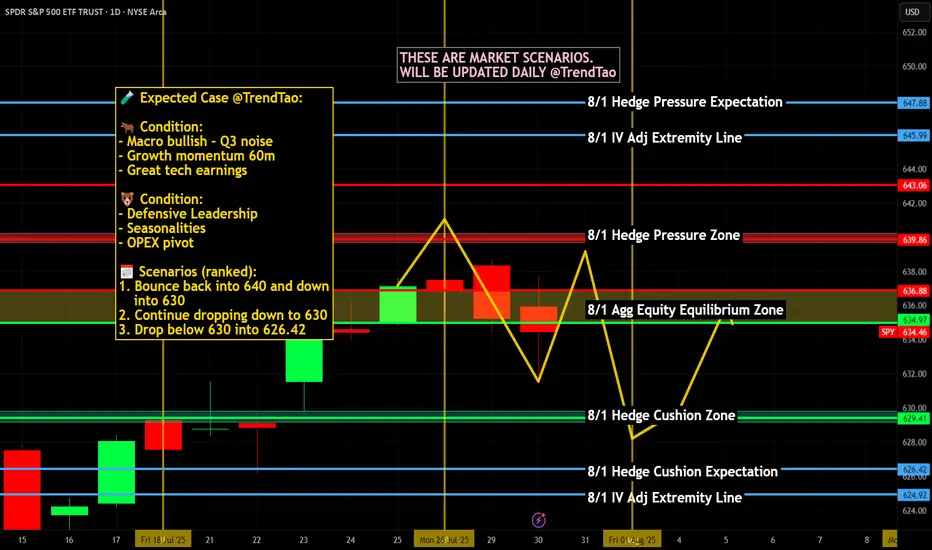
SPY: I think dollar milkshake is brewing, buying for long term📉 SPY Daily Breakdown – Aug 1, 2025 | VolanX Observations
🧠 Bot failed today, but the market taught more than any trade could have. Sitting out gave me the clarity to reassess structure and edge.
🔍 Market Structure Update:
Gap Down from Premium Zone: Today’s price action rejected the weak high and created a clean daily gap — signaling potential distribution at the top.
ORB (15-min) marked and ready: Likely to be retested on Monday. If price rallies into this zone and rejects, that’s where I’ll look for short entries.
Friday Bearish Close Rule: Statistically, when Friday closes red with strong momentum, Monday tends to follow — especially after a gap-down open.
🧭 Big Picture Outlook:
Liquidity Zones Below:
600 → First institutional reaction zone.
580 → Deeper demand and equilibrium area from previous consolidation.
Dollar Milkshake Brewing: Strong USD thesis could pressure equities short-term. This aligns with potential flow into defensives and out of high beta.
Long-Term Bias: Watching for deep discounts. If price moves into high-value demand zones, I’ll accumulate for the long haul — buying fear when it's priced in.
📌 What I’m Watching Next Week:
Monday open – will we see Gap & Go or a Gap Fill + Fade?
Reaction to ORB zone.
Volatility behavior and volume footprint in the first 90 minutes.
🔻 No trades today due to a bot error, but ironically, that gave me better vision. Sometimes, the best trades are the ones you don’t take.
VolanX Protocol engaged. Standing by.

S&P 500 Futures – Trendline Breach + AI Forecast Signals Major C📉 S&P 500 Futures – Trendline Breach + AI Forecast Signals Major Correction
VolanX Risk Engine Flags High Probability Downside
🧠 Narrative:
Markets have enjoyed a powerful uptrend off the March lows, but the structure is showing signs of exhaustion.
The ascending trendline—untouched for over two months—has now been breached.
Fibonacci levels cluster below current price, with critical demand at:
6319.25 (immediate test zone)
6179.25 (0.618 retrace)
5964.75 (macro support / VolanX institutional target)
Meanwhile, VolanX Protocol's predictive engine has shifted to a "Strong Sell" with a projected correction path clearly outlined. The 30-day price forecast (shown in red) leans toward a mean reversion toward 5842.12 by late August.
📊 Institutional Trade Plan (VolanX DSS):
Entry Zone: 6360-6380 (Confirmed breakdown retest)
Target 1: 6179.25
Target 2: 5964.75
Final Target: 5842.12
Invalidation: Close above 6480 (new highs with strength)
🔎 Risk/Reward: 3.4+
📈 Trend Deviation: 7.4%
📉 Bearish Conviction: 84.1%
📌 Key Insights:
Breakdown below trendline confirms shift in control to bears
Institutional models anticipate volatility-led selloff
Major liquidity rests below 6200 and 5960 zones
This is not the time to chase highs—risk is asymmetric
🔮 VolanX Opinion:
“Volatility expansion is near. Institutional capital is likely rotating out of risk. The squeeze has passed; now the trapdoor may open.”
This is where preparation outperforms prediction. Execute with risk logic, not emotion.
📚 #SNP500 #ESFutures #SPX #MacroTrading #SmartMoney #InstitutionalFlow #TrendReversal #Volatility #LiquiditySweep #FibonacciLevels #VolanX #AITrading #EminiFutures #WaverVanir #QuantStrategy #TechnicalAnalysis #Forecast #TradingView

Nightly $SPY / $SPX Scenarios for July 31, 2025🔮 Nightly AMEX:SPY / SP:SPX Scenarios for July 31, 2025 🔮
🌍 Market-Moving News 🌍
🏦 Fed Holds Rates — Dissent Indicates Division
The Federal Reserve maintained its benchmark rate at 4.25%–4.50%. Notably, two governors—Christopher Waller and Michelle Bowman—dissented in favor of a 25 bp rate cut, underscoring internal divisions amid growing political pressure
📈 Strong Q2 Growth, But No Rate-Cut Signal
U.S. GDP expanded at a 3.0% annualized rate in Q2, rebounding sharply from Q1's contraction. Despite this, Powell emphasized persistent inflation, particularly from tariffs, reinforcing the Fed’s cautious policy stance
🛢️ Oil Climbs as Tariff Tensions Rise
Brent crude rose to ~$73.51 and WTI to ~$70.37 on fears of supply disruptions tied to President Trump’s threats of new tariffs on Russian oil and new tariffs imposed on Brazil and South Korea
📊 Key Data Releases & Events 📊
📅 Thursday, July 31:
8:30 AM ET – Initial Jobless Claims (week ending July 26)
Initial claims rose to 222,000, up from 217,000 previously—an early gauge of labor-market trends
8:30 AM ET – Employment Cost Index (Q2)
Quarterly growth in labor costs edged lower to 0.8%, down from 0.9%—a signal of moderate wage pressures
8:30 AM ET – Personal Income (June)
Data released on household income and spending patterns—crucial for assessing consumer resilience heading into Q3
⚠️ Disclaimer:
This information is for educational and informational purposes only and should not be construed as financial advice. Always consult a licensed financial advisor before making investment decisions.
📌 #trading #stockmarket #economy #Fed #inflation #jobs #technicalanalysis
Market Outlook: Bulls are still in control, but be defensive.At theses levels don't let your guard down. I could see us pulling back next week, meanwhile we may continue to stay above the 10-EMA for now.

SPY: Aiming 626 today Slowly./ Let's observe what this market will give us. If there is a setup, we take the trade.

[$SPY] S&P500: The Big mini Short or Why hedging is not a crimeAMEX:SPY CBOE:XSP
No financial advice.
For Entertainment purpose only.
Have you ever considered to protect yourself and wake up from the 'Long-Only-Delirium'?
Now is the time.. do you hear the cracking in the bond-market?
Rate cutting will solve it?
No reason to panic?
Doomsday i*diot?
We will see... 😈 tic tac tic tac
This time THETA is against us, but GAMMA is bleeding.
📊 Strategy Characteristics
+++Note: We set this one as a 'Diagonal Ratio Put Spread'
> Diagonal: Because the options have different expiration dates (Sept 19 + Sept 30)
> Ratio: Because we are buying more puts than selling (4:2 ratio)
> Put Spread: Because both legs are puts with the same strike
"We are all at a wonderful ball where the champagne sparkles in every glass and soft laughter falls upon the summer air. We know, by the rules, that at some moment, the Black Horseman will come shattering through the great terrace doors, wreaking vengeance and scattering the survivors. Those who leave early are saved, but the ball is so splendid no one wants to leave while there is still time, so that everyone keeps asking, ‘What time is it? What time is it?’ But none of the clocks have any hands." ~George Goodman

[$SPY] S&P500: The Big mini Short or Why hedging is not a crimeAMEX:SPY
No financial advice.
For Entertainment purpose only.
Have you ever considered to protect yourself and wake up from the 'Long-Only-Delirium'?
Now is the time.. do you hear the cracking in the bond-market?
Rate cutting will solve it?
No reason to panic?
Doomsday i*diot?
We will see... 😈 tic tac tic tac
This time THETA is against us, but GAMMA is bleeding.
"We are all at a wonderful ball where the champagne sparkles in every glass and soft laughter falls upon the summer air. We know, by the rules, that at some moment, the Black Horseman will come shattering through the great terrace doors, wreaking vengeance and scattering the survivors. Those who leave early are saved, but the ball is so splendid no one wants to leave while there is still time, so that everyone keeps asking, ‘What time is it? What time is it?’ But none of the clocks have any hands." ~George Goodman
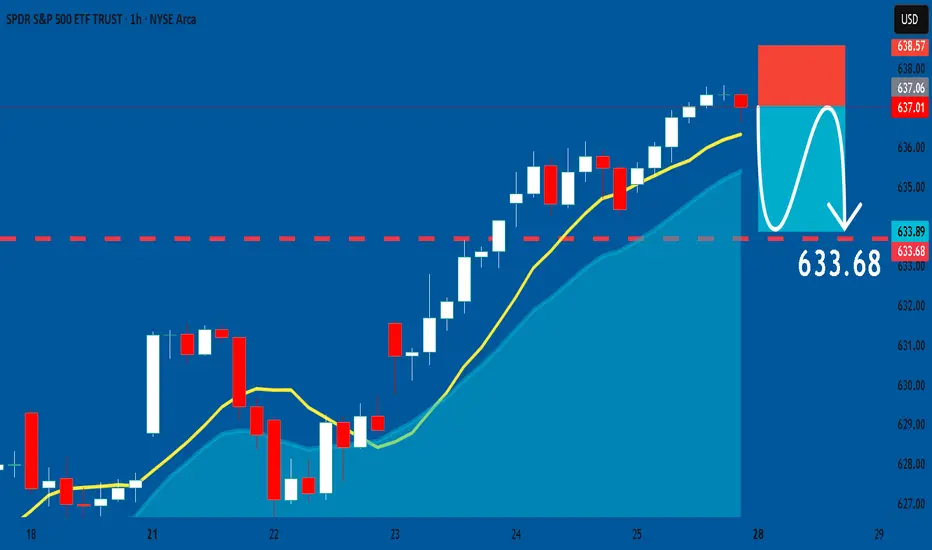
SPY: Bearish Continuation & Short Signal
SPY
- Classic bearish setup
- Our team expects bearish continuation
SUGGESTED TRADE:
Swing Trade
Short SPY
Entry Point - 637.01
Stop Loss - 638.57
Take Profit - 633.58
Our Risk - 1%
Start protection of your profits from lower levels
Disclosure: I am part of Trade Nation's Influencer program and receive a monthly fee for using their TradingView charts in my analysis.
❤️ Please, support our work with like & comment! ❤️
SPY Options Analysis Summary (2025-07-22)
🔻 AMEX:SPY Weak Bearish Put Setup (0DTE) – 07/22/25
All models agree: price is weak, momentum is limp, and VWAP is above.
But conviction? Not unanimous. High-risk, high-reward 0DTE scalpers only.
⸻
📉 Trade Setup
• 🟥 Direction: PUT
• 🎯 Strike: $626.00
• 💵 Entry: $0.57
• 💰 Target: $1.70 (+200%)
• 🛑 Stop: $0.28 (–50%)
• 📅 Expiry: Today (0DTE)
• ⚖️ Confidence: 65%
• ⏰ Entry Timing: Market Open
⸻
🧠 Multi-AI Consensus
Model Bias Action
Grok/xAI Weak Bearish ⚠️ No Trade
Claude Weak Bearish ⚠️ No Trade
Gemini Bearish ✅ $627 Put
Llama Moderately Bearish ⚠️ Conservative Put
DeepSeek Bearish ✅ $626 Put
🔹 VWAP < Price = Bearish bias
🔹 RSI = Neutral → watch for fakeouts
🔹 VIX favorable (<22)
🔹 Volume = weak = risk of whipsaw
⸻
⚠️ Risk Notes
• Bounce risk off session lows is real
• Lack of momentum may cause theta burn
• Best for scalpers who react fast — not a swing trade
• No conviction = smaller size, tighter leash
⸻
📢 Tagline (for virality):
“ AMEX:SPY is limping, not bleeding. But if it breaks, 200% comes fast. 0DTE scalpers: this is your window.” 💣

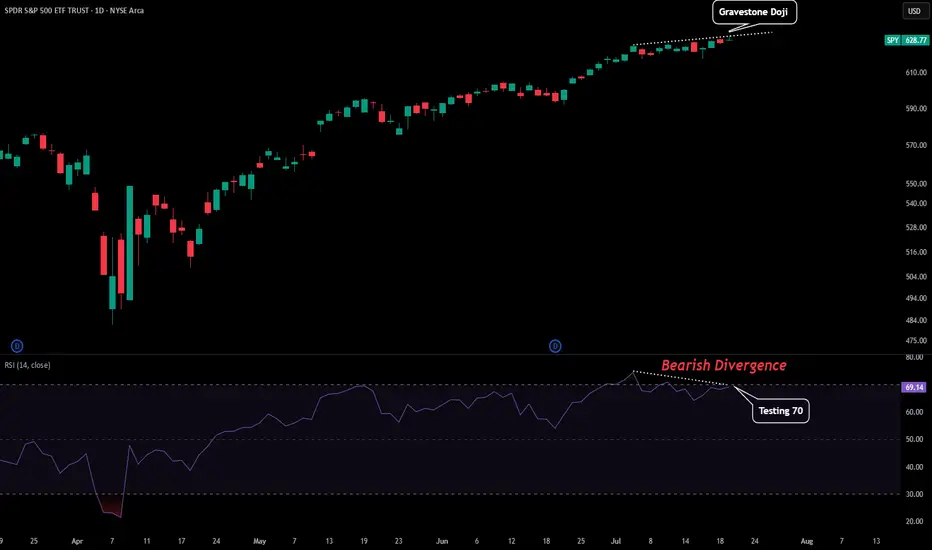
SPY - First Signs of TroubleFrom this entire uptrend we might be seeing the first signs of trouble.
Here are some reasons for this from a technical perspective:
-Daily Printed a Gravestone Doji
-RSI Testing Overbought as Resistance
-Slight Bearish Divergence on Daily RSI
-Momentum Stalling
There could also be some catalyst tomorrow that contribute to this. Powell speaks tomorrow so depending on what he says could either add fuel to a market reversal or negate these bearish signals and send us on another leg. Prepare for volatility.
SPY: Climbing the Wall of Worry — But Is a Turn Coming?SPY: Climbing the Wall of Worry — But Is a Turn Coming?
The S&P 500 (SPY) is pushing into a critical zone as we approach July 28th, and I can’t ignore the confluence of signals piling up here.
Technical Setup
We’re testing the top of a rising wedge formation.
Key round number overhead at $640 — a psychological and options magnet.
Price is extended well above moving averages with declining volume, often a warning sign for bulls.
Multiple resistance lines converge in this zone, creating a high-pressure point.
📆 Timing Matters
July 28 = weekly options expiry — with massive open interest clustered around $630–$640.
Seasonally, late July often marks a peak before August chop.
Add in some “tin foil hat” vibes: SPY’s riding momentum while major indices are diverging (looking at you, IWM), and the macro narrative feels shaky at best.
What Would Confirm a Reversal?
Breakdown below $625 with a high-volume red candle.
Bearish engulfing or shooting star candle near resistance.
VIX divergence or big money flowing into puts mid-week.
Key Levels
Resistance: $640 / $649.90
Support: $630 / $622 / $595
Reversal target (if confirmed): $594–$575 area
Final Thoughts
As we all know, markets can stay irrational longer than you can stay solvent. However, when trendlines, round numbers, timing, and seasonality align, I start watching for cracks. This may not be the top — but it might be the spark.
Following closely. Alerts set. Ready for the flush if it comes.

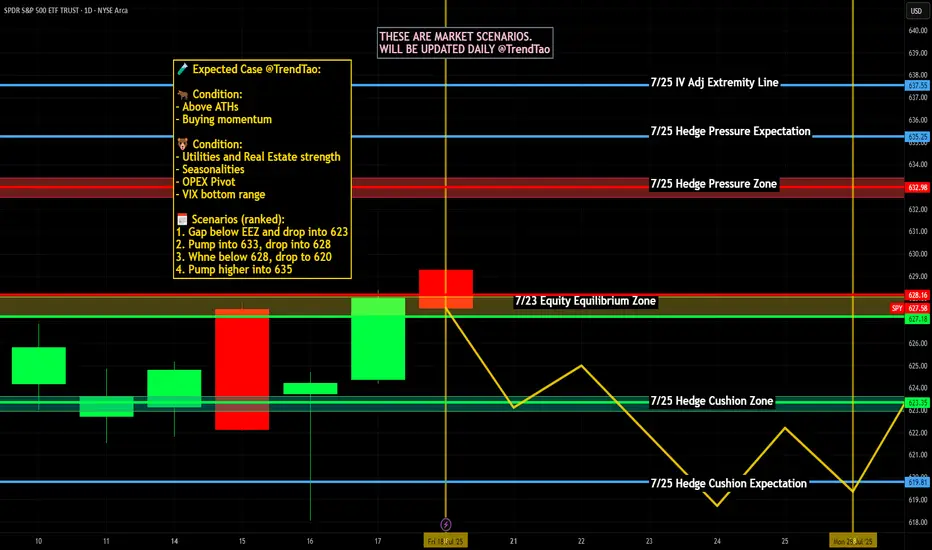
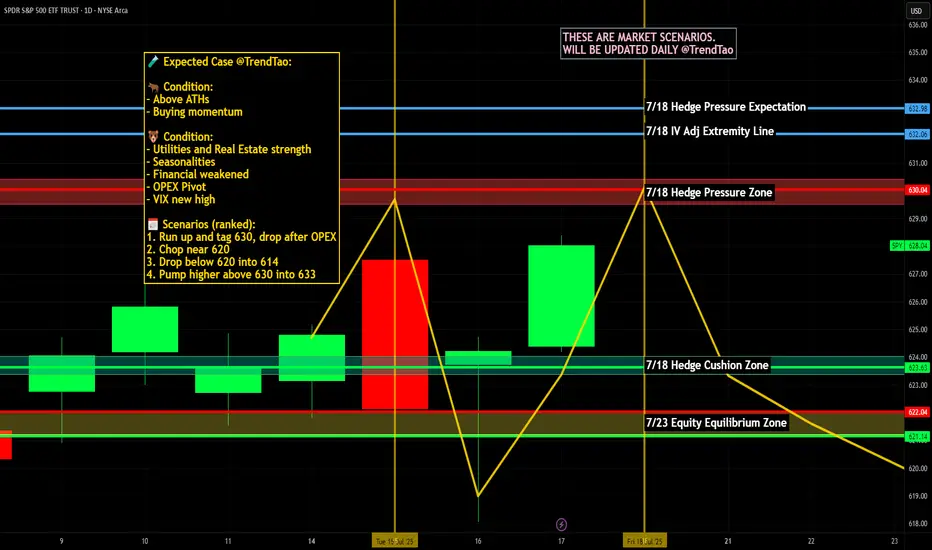
Weekly $SPY / $SPX Scenarios for July 21–25, 2025🔮 Weekly AMEX:SPY / SP:SPX Scenarios for July 21–25, 2025 🔮
🌍 Market-Moving News 🌍
🏦 Fed Chair Powell Speaks — Markets Key Into Tone
Federal Reserve Chair Jay Powell’s Jackson Hole speech is the week’s centerpiece. Markets will be closely listening for clues on inflation strategy, rate-cut timing, and sensitivity to geopolitical inflation drivers like tariffs.
📦 Tariff Deadlines Gain Spotlight
Multiple tariff deadlines are set this week for targeted trade partners including the EU, Mexico, Canada, Japan, South Korea, and Thailand. Any new announcements or extensions could trigger volatility in trade-exposed sectors.
🛢️ Oil Market Mixed Signals
Brent crude prices have stabilized near mid-$70s, but OPEC+ discussions regarding supply extensions and global growth concerns continue to inject uncertainty into energy-linked equities.
📈 Big Tech Earnings Kick Off
The “Magnificent Seven” tech giants begin reporting: Nvidia leads on Tuesday, followed by Microsoft, Amazon, Alphabet, and Meta later in the week. Expect significant sentiment swings based on forward commentary.
📊 Key Data Releases & Events 📊
📅 Monday, July 21
Quiet session ahead of a packed week of speeches and data.
📅 Tuesday, July 22
8:30 AM ET – Existing Home Sales (June):
Measures signed contracts on previously owned homes—a key housing indicator.
After Market Close – Nvidia Q2 Earnings:
Market will watch guidance and China commentary.
📅 Wednesday, July 23
8:30 AM ET – Leading Economic Indicators (June):
An early gauge of U.S. economic momentum.
📅 Thursday, July 24
8:30 AM ET – Initial & Continuing Jobless Claims:
Labor-market health indicator.
📅 Friday, July 25
8:30 AM ET – Durable Goods Orders (June):
Signals demand for long-lasting goods, often driven by business spending.
8:30 AM ET – New Home Sales (June):
Follows existing home data for housing sector insight.
4:00 PM ET – Fed Chair Powell Speech at Jackson Hole:
Expect commentary on inflation, growth, and rate-path clarity.
⚠️ Disclaimer:
This content is for educational and informational purposes only and should not be construed as financial advice. Consult a licensed financial advisor before making investment decisions.
📌 #trading #stockmarket #economy #Fed #earnings #housing #durablegoods #JacksonHole #technicalanalysis
hihiThe convergence of artificial intelligence and decentralized finance presents a paradigm shift in global economic systems, where algorithmic governance, autonomous agents, and smart contracts could redefine trust, efficiency, and access. This fusion offers transformative potential but raises critical ethical, regulatory, and socio-technical challenges demanding interdisciplinary exploration and resilient systemic safeguards.
Ask ChatGPT

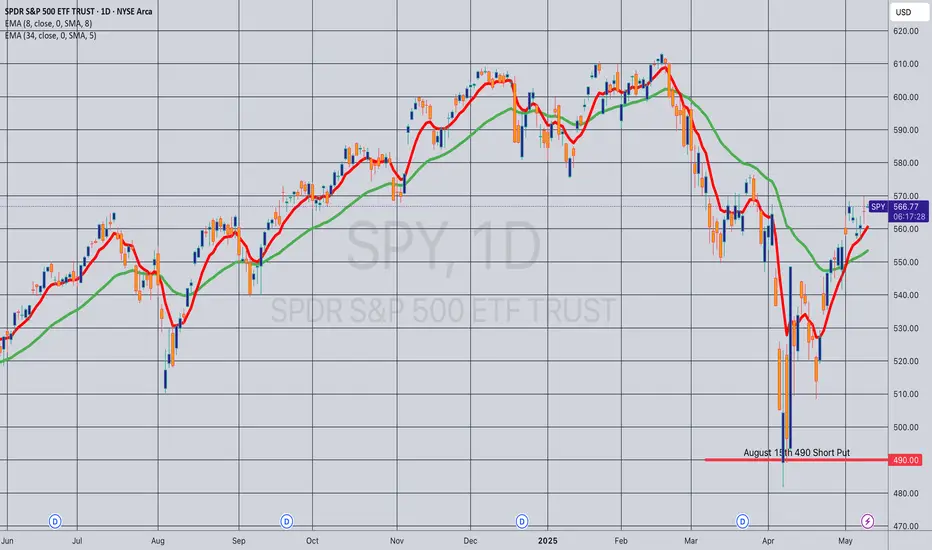
Opening (IRA): SPY August 15th 490 Short Put... for a 5.00 credit.
Comments: Laddering out, targeting the strike paying around 1% of the strike price in credit ... .
Will generally look to roll up to the shortest duration <16 delta strike paying 1% of the strike price if in profit.
Earnings Heat Up - 6300 and 6200 SPX Key Levels RemainMarket Update
SPX Key Levels
-SPX poked 6300 Tuesday, Thursday, and poked higher Friday (but settled back to 6300)
-6200 support remains a key level
-6050/6000/5800 next floor levels, I'll be looking for dips
I can see the market slowly (and I mean SLOWLY) grinding higher but preparing for a
reasonable seasonal selloff through end of July into end of September window
July 28-August 1 is a monster week in the markets
-Megacap Earnings (MAG7 Tue/Wed/Thu)
-Wed July 30 - FOMC (Pause expected but Powell's Press Conference is important)
-Friday August 1 - Non-Farm Payroll, Tariff Deadline
I'm hitting fresh YTD highs so I'm not complaining about this melt-up and grind, I'm simply wanting to allocate positions and add to my positions at better levels and with a slightly
higher VIX to help take advantage of the expected move being greater than the actual move
Have a great weekend and thank you watching!!!

SPY risk on for a few weekslooks like we are still moving up (SPX 6,400-6,500) but the risk to a correction is increasing.
FOMO phase on meme stock. so still profit to be had

Nightly $SPY / $SPX Scenarios for July 19, 2025🔮 Nightly AMEX:SPY / SP:SPX Scenarios for July 19, 2025 🔮
🌍 Market-Moving News 🌍
🏢 U.S. Corp Buybacks Set to Propel Stocks
Citadel Securities expects U.S. companies to repurchase roughly $1 trillion of stock in 2025. With the blackout period ending in August, buybacks—historically strong in July, the stock market’s best month—could bolster valuations
⚖️ Fed Independence Debate Intensifies
President Trump’s continued criticism of Chair Powell has already weakened confidence in Federal Reserve autonomy. The fallout shows up in a weaker dollar, elevated Treasury yields, and rising inflation expectations—though stocks have remained resilient
🇺🇸 Immigration Rollback Sparks Economic Concern
The rescinding of Temporary Protected Status for ~900,000 immigrants could remove up to 1.1 million workers from the labor force. Analysts warn of potential stagflation risks, with GDP growth potentially down 0.3–0.4 percentage points and labor-market tightening ahead
💵 Massive T-Bill Issuance Incoming
Following the debt-ceiling deal, the Treasury plans over $1 trillion in T-bill issuance in the next 18 months. Money-market funds are expected to absorb much of it, influencing short-term rates and cash-market dynamics
📊 Key Data Releases & Events 📊
📅 Friday, July 19:
8:30 AM ET – Initial Jobless Claims
Weekly figure on new unemployment filings—a real-time indicator of labor-market resilience.
8:30 AM ET – Existing Home Sales (June)
Measures signed contracts on previously owned homes; key for gauging housing-market health.
All Day Events:
Ongoing corporate buybacks entering open window
Treasury auctions and T-bill issuance updates
⚠️ Disclaimer:
This information is for educational and informational purposes only and should not be construed as financial advice. Always consult a licensed financial advisor before making investment decisions.
📌 #trading #stockmarket #economy #monetarypolicy #debt #housing #labor #technicalanalysis
Elliott Wave Analysis: SPY Poised To Extend Higher In Bullish SeElliott Wave sequence in SPY (S&P 500 ETF) suggest bullish sequence in progress started from 4.07.2025 low. It expects two or few more highs to extend the impulse sequence from April-2025, while dips remain above 6.23.2025 low. SPY ended the daily corrective pullback in 3 swings at 480 low on 4.07.2025 low from February-2025 peak. Above there, it favors upside in bullish impulse sequence as broke above February-2025 high. Currently, it favors wave 3 of (1) & expect one more push higher from 7.16.2025 low in to 630.31 – 651.1 area before correcting in wave 4. In 4-hour, it placed 1 at 596.05 high, 2 at 573.26 low as shallow connector & extend higher in 3. Within 3, it placed ((i)) at 606.40 high, ((ii)) at 591.89 low, ((iii)) at 627.97 high & ((iv)) at 618.05 low.
In 1-hour above ((ii)) low of 591.89 low, it ended (i) at 605.96 high, (ii) at 603.17 low, (iii) at 626.87 high as extended move, (iv) at 620 low & (v) as ((iii)) at 627.97 high. Wave ((iv)) ended in 3 swing pullback as shallow connector slightly below 0.236 Fibonacci retracement of ((iii)). Within ((iii)), it ended (a) at 619.8 low, (b) at 624.12 high & (c) at 618.05 low on 7.16.2025 low (this week). Above there, it favors rally in ((v)) of 3 targeting in to 630.31 – 651.1 area before correcting in 4. Within ((v)), it placed (i) at 624.73 high, (ii) at 623.08 low & favors upside in (iii) of ((v)). We like to buy the pullback in clear 3, 7 or 11 swings correction at extreme area in 4 and later in (2) pullback, once finished (1) in 5 swings.
