ONE LINE: A focused trendline view Sometimes it's all you need. When I choose ONE spot I am looking at, I am honing in not just on tops and bottoms, but I have found that the spots with the most frequent historical PIVOTS and highest traffic areas are the areas that the price action gets hung up on, pauses, or pivots most often. And this bearish drop seems to be taking dead aim at that $550(ish) spot.
SPY trade ideas

Spy I think we have one more leg down to 538-540 before earnings season kicks off next week ..
NASDAQ:QQQ and TVC:DJI showing same chart
I will update this more later but I wanted to get this out before market closes... Of course if we gap above trendline resistance and CLOSE above it the the resistance is negated .
Another, you see that gap from March 14th that the spy and Qqq closed? Well the Dow Jones gap is still left open and TVC:NYA

Using The CRADLE Pattern To Time/Execute TradesThis simple video highlights one of my newest pattern definitions - the Cradle Pattern.
In addition to the many other patterns my technology identified, this Cradle Pattern seems to be a constant type of price construct.
I'm sharing it with all of you so you can learn how to identify it and use it for your trading.
Ideally, this pattern represents FLAGGING after a trend phase.
It is a consolidation of price within a flag after a broad trending phase.
It usually resolves in the direction of the major trend, but can present a very solid reversal trigger if the upper/lower pullback range is broken (see the examples in this video).
Learn it. Use it.
Price is the ultimate indicator.
Learn to read price data more efficiently to become a better trader.
Get some.
#trading #research #investing #tradingalgos #tradingsignals #cycles #fibonacci #elliotwave #modelingsystems #stocks #bitcoin #btcusd #cryptos #spy #gold #nq #investing #trading #spytrading #spymarket #tradingmarket #stockmarket #silver

SPY/QQQ Plan Your Trade Update Update For 4-2 : ConsolidationThis quick update shows why I believe the SPY/QQQ will struggle to make any big move as long as we stay within the 382-618 "Battle Zone".
The SPY continues to rally up into this zone and stall out. If the SPY stays within this zone, I believe the markets will simply roll around in a tight range and go nowhere today.
Thus, I published this article to warn traders not to expect any big trends until we breakout - away from this Fibonacci "Battle Zone".
You can't kick the markets to make it go anywhere. And, unless you are trading very short-term swings in price - you are probably better off sitting on the sidelines waiting for a broad market trend to establish.
This is a warning. As long as we stay in the Fibonacci "Battle Zone", price will struggle to build any major trend.
So, play your trades accordingly - or just take a break from trading while you wait for the markets to roll out of the "Battle Zone".
Get some.
#trading #research #investing #tradingalgos #tradingsignals #cycles #fibonacci #elliotwave #modelingsystems #stocks #bitcoin #btcusd #cryptos #spy #gold #nq #investing #trading #spytrading #spymarket #tradingmarket #stockmarket #silver

SPY/QQQ Plan Your Trade For 4-2 : GAP Reversal Counter TrendToday's pattern suggests price may attempt to move downward in early trading, trying to find support near recent lows, then potentially roll a bit higher.
I do expect price to move into a downward price trend - attempting to break below the 549 price level and targeting the 535-545 target Fib level this week.
Today, Thursday, and Friday are all GAP/Breakaway types of patterns. So we should be entering an expansion of price trend and I believe that trend will be to the downside.
Gold and Silver are nearing a Flag Apex level. Very exciting for a potential breakout rally driving Gold up above $3250 and Silver up above $36.
I personally believe there is nothing stopping Gold and Silver in this rally phase until Gold reaches levels above $4500. GET SOME.
BTCUSD had a very interesting spike low. I still believe BTCUSD will roll downward - targeting the $76-78k level, then break downward towards the $60k level. Time will tell.
The rest of this week should be very exciting with the Breakaway and GAP patterns.
Get some.
#trading #research #investing #tradingalgos #tradingsignals #cycles #fibonacci #elliotwave #modelingsystems #stocks #bitcoin #btcusd #cryptos #spy #gold #nq #investing #trading #spytrading #spymarket #tradingmarket #stockmarket #silver

SPY, S&P 500 expected to correct to 500 before further upsideBased on RSI divergence, EW count and volume support it seems likely that SPY will correct to equal leg (ABC) region between 480-520 before the correction is over and further upside can be seen.

What Is the Difference Between ETFs and Index Funds?What Is the Difference Between ETFs and Index Funds?
ETFs and index funds are designed to provide access to diversified portfolios of assets, often tracking the performance of a specific market index. But while they may appear similar at first glance, they have distinct characteristics that cater to different types of investors and strategies. This article breaks down the key differences between ETFs vs index funds, explores how they work, and explains why traders and investors might choose one over the other.
What Are ETFs?
Exchange-traded funds (ETFs) are investment vehicles that trade on stock exchanges, much like individual shares. They’re structured to replicate the performance of a particular benchmark, sector, commodity, or a combination of asset classes.
What sets ETFs apart is their flexibility. Traders and investors buy and sell ETFs throughout the trading day at market prices. This makes them particularly appealing to active traders who value liquidity and the ability to react quickly to price movements.
Another key advantage is their typically low cost. Most ETFs are passively managed, meaning they aim to replicate a benchmark rather than beat it. This reduces management fees, making ETFs a cost-effective choice compared to actively managed offerings.
ETFs also offer diversification in a single transaction. By trading one ETF, investors can gain exposure to hundreds or even thousands of underlying securities. This makes them a popular choice for spreading risk across multiple assets.
What Are Index Funds?
Index funds are investment vehicles designed to mirror the performance of a specific index, like the FTSE 100 or the S&P 500. An index fund provides broad exposure by holding a portfolio of assets that closely matches the composition of the benchmark it tracks. An index vehicle tracking the S&P 500 would invest in the 500 largest companies in the US, in the same proportions as the index. This passive strategy keeps costs low, as there’s no need for active management or frequent trading decisions.
So, how is an index fund different from an exchange-traded fund? The index fund can take the form of either an ETF or a mutual fund; for instance, the SPDR S&P 500 ETF, or SPY, is an index fund.
Mutual fund versions of index funds are traded at the end-of-day net asset value (NAV), while ETF versions are bought and sold throughout the trading day like individual shares. This distinction is important for traders considering factors like liquidity and pricing flexibility.
Low-cost index funds are popular for their relative simplicity compared to some other financial instruments, cost efficiency, and diversification. By investing in a single product, investors can gain exposure to an entire market, reducing the need for extensive research or active management.
Is an ETF an index fund? Not necessarily. An ETF can be an index fund if it tracks an index, but ETFs can also track different sectors, assets, or geographies without being one.
Differences Between ETFs and Index Funds
ETFs and index funds share a common purpose: to track the performance of an underlying benchmark. However, the debate of ETFs vs mutual funds vs index funds often comes down to trading mechanisms and investment strategies, which can influence their suitability for different types of traders and investors.
Trading Mechanism
One of the most noticeable differences between ETFs vs index funds is how they’re traded. ETFs trade on stock exchanges, allowing them to be bought and sold throughout the trading day at market prices. This means their value fluctuates based on demand, similar to individual shares. In contrast, mutual fund indices are priced and traded only once a day, at the net asset value (NAV) calculated after markets close.
Variety
ETFs encompass diverse assets like stocks, bonds, and commodities, covering sectors, regions, or mixed asset classes. Index funds, on the other hand, only track a specific market index, like the S&P 500, FTSE 100, or Nasdaq 100.
Cost Structure
Both ETFs and mutual fund indices are known for low fees, but there are nuances. ETFs typically have slightly lower expense ratios, as they incur fewer administrative costs. However, trading ETFs may involve brokerage fees or bid-ask spreads, which can add up for frequent traders. Mutual fund vehicles often require no trading fees but may impose a minimum investment amount.
Tax Efficiency
ETFs tend to be more tax-efficient than mutual fund indices. This is due to how they handle capital gains. ETFs generally use an “in-kind” redemption process, which minimises taxable events. Mutual fund index funds, on the other hand, may trigger taxable capital gains distributions, even if you haven’t sold your shares.
Liquidity and Accessibility
ETFs can be bought in small quantities, often for the price of a single share, making them more accessible to retail investors. Mutual fund vehicles may require higher minimum investments, which could limit access for some investors. Additionally, ETFs offer instant trade execution, while mutual vehicles require you to wait until the end of the trading day to complete transactions.
ETF CFD Trading
ETF CFD (Contract for Difference) trading is a versatile way to speculate on the price movements of ETFs without actually owning the underlying assets. When trading ETF CFDs, you’re entering into an agreement with a broker to exchange the price difference of an ETF between the time the position is opened and closed. Unlike traditional ETF investing, where you purchase shares on an exchange, CFD trading allows you to take positions on price movements—whether upwards or downwards.
Leverage and Lower Capital Requirements
One major advantage of ETF CFD trading is leverage. With CFDs, you only need to put down a fraction of the trade’s total value as margin, allowing you to control larger positions with less capital. However, leverage amplifies both potential gains and losses, so careful risk management is essential.
Potential Short-Term Opportunities
ETF CFDs add a layer of flexibility for traders exploring the difference between ETFs, mutual funds, and index funds by focusing on short-term speculation rather than long-term holding. Traders can react quickly to news, economic events, or trends without the constraints of traditional ETF investing, such as settlement times or the need to meet minimum investment requirements. Since ETF CFDs can be traded with intraday precision, they allow traders to capitalise on smaller price movements.
A Complement to Long-Term Investing
For those who already invest in traditional ETFs or indices, ETF CFD trading can serve as a complementary strategy. While long-term investments focus on gradual wealth-building, CFDs enable active traders to seize potential short-term opportunities, hedge against risks, or diversify their trading activities.
Flexibility Across Markets
With ETF CFDs, traders gain access to a wide range of markets, from equity indices to commodities and sectors. This diversity allows for tailored trading strategies that align with market conditions or specific interests, such as tech or energy ETFs.
Uses for ETFs and Index Funds
The differences between index funds and ETFs mean they play distinct but complementary roles in financial markets, offering tools for various investment and trading strategies. Whether focusing on long-term goals or seeking potential short-term opportunities, these products provide flexibility and diversification.
Portfolio Diversification
Both are popular for spreading risk across a broad range of assets. For example, instead of buying shares in individual companies, a single investment in an ETF tracking the S&P 500 provides exposure to hundreds of large US firms. This diversification may help reduce the impact of poor performance of any single asset.
Cost-Effective Market Exposure
Both types offer relatively low-cost access to markets. Passive management strategies mean lower fees compared to actively managed products, making them efficient choices for building portfolios or gaining exposure to specific sectors, regions, or asset classes.
Tactical Market Moves
ETFs, with their intraday trading capability, are particularly suited to tactical adjustments. For instance, a trader looking to quickly increase exposure to the tech sector might buy a technology-focused ETF, while potentially reducing risk by selling it as conditions change.
Long-Term Wealth Building
Index funds, particularly in their mutual fund format, are designed for patient investors. By tracking broad indices with minimal turnover, they offer a way to potentially accumulate wealth over time, making them popular instruments for retirement savings or other long-term objectives.
How to Choose Between Index Funds vs ETFs
Choosing between an index fund vs ETF depends on your trading style, investment goals, and how you plan to engage with the markets. While both offer relatively cost-effective access to diverse portfolios, your choice will hinge on a few key factors.
- Trading Flexibility: ETFs are popular among active traders looking for potential intraday opportunities. Their ability to trade throughout the day allows for precision and quick responses to market changes. Index funds, whether ETFs or mutual products, are usually chosen by long-term investors who are less concerned about daily price movements.
- Fees and Costs: While both options are low-cost, ETFs often have slightly lower expense ratios but may incur trading fees or bid-ask spreads. Mutual fund products typically skip trading fees but may have higher management costs or minimum investment requirements.
- Tax Considerations: ETFs often provide better tax efficiency due to their structure, particularly when compared to mutual fund indices. For investors concerned about capital gains distributions, this could be a deciding factor.
- Strategy: If you’re targeting specific themes, sectors, or commodities, ETFs that aren’t tied to an index can provide unique exposure. For broad, passive market tracking, index funds—whether ETFs or mutual funds—offer simplicity and consistency.
The Bottom Line
ETFs and index funds are powerful instruments for traders and investors, each with unique strengths suited to different strategies. Whether you’re focused on long-term growth or short-term price moves, understanding their differences is key. For those looking to trade ETFs with flexibility, ETF CFDs offer a dynamic option. Open an FXOpen account today to access a range of ETF CFDs and start exploring potential trading opportunities with competitive costs and four advanced trading platforms.
FAQ
What Is an Index Fund?
An index fund is an investment vehicle designed to replicate the performance of a specific market index, such as the S&P 500 or FTSE 100. It achieves this by holding the same securities as the index in similar proportions. These vehicles can be either mutual funds or ETFs, offering investors broad market exposure and low costs through passive management.
What Is the Difference Between an ETF and an Index Fund?
An ETF trades like a stock on an exchange throughout the day, with prices fluctuating based on market demand. They track various assets across different sectors, markets, and asset classes. Index funds track indices, like the S&P 500 or FTSE 100, and can be traded as an ETF or mutual fund.
What Is Better, an S&P 500 ETF or Mutual Fund?
The choice depends on your needs. ETFs offer intraday trading, lower fees, and no minimum investment, making them popular among those who look for flexibility. Mutual funds often waive trading costs and are chosen by long-term investors comfortable with end-of-day pricing.
Are ETFs as Safe as Index Funds?
ETFs and index funds carry similar risks since both track market performance. So-called safety depends on the underlying assets, overall conditions, and your investment strategy, not the type itself.
What Is the Difference Between a Mutual Fund and an Index Fund?
A mutual fund is a broad investment vehicle managed actively or passively, while an index fund is a type of mutual fund or ETF specifically designed to replicate an index.
What Are Index Funds vs Equity Funds?
Index funds are designed to track the performance of an index. Equity funds, on the other hand, focus on stocks and can be actively or passively managed. While all index funds are equity funds, not all equity funds track indices.
This article represents the opinion of the Companies operating under the FXOpen brand only. It is not to be construed as an offer, solicitation, or recommendation with respect to products and services provided by the Companies operating under the FXOpen brand, nor is it to be considered financial advice.

SPY Divergence - Bullish Comeback?SPY is showing quite a significant bullish divergence on the Daily timeframe. This appears to concur with a potential double-bottom formation. We also see the RSI beginning to poke up through it's moving average:
Alongside this we see a Rug Pull target on the 4h timeframe of the ES1! S&P futures ticker.
Rug-pull events on this ticker have seen a great degree of accuracy over the past few years, as seen below:
This rug-pull target alongside strong divergence on the higher timeframes indicates a high probability the markets will trend towards the upside in the near future.

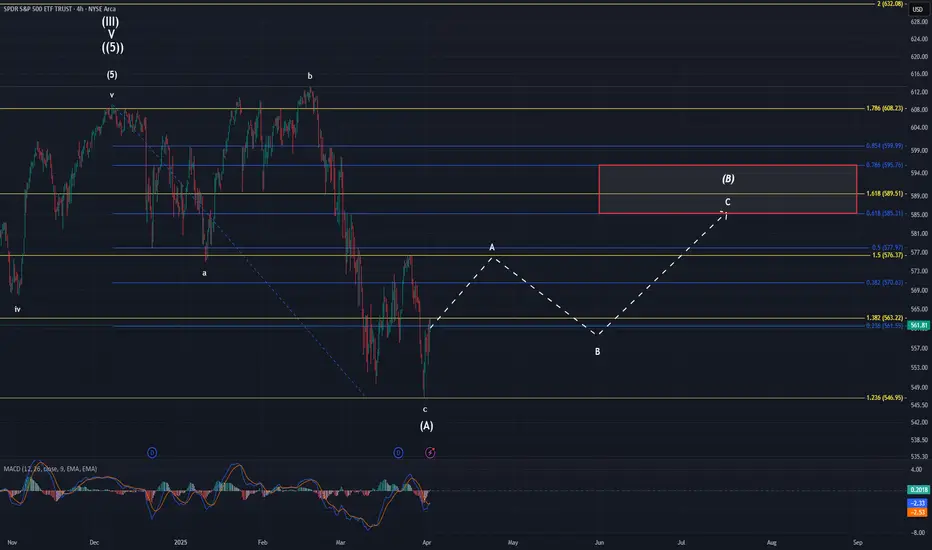
House of Cards - $585 before the crashHouse of Cards - $585 before the crash
I'm unable to update my previous idea that I originally posted in February when AMEX:SPY was at the top. Going to make this brief and will add screenshots and additional notes once the structure of Wave (B) is confirmed or invalidated.
On the 500R chart ($5), the price has risen in a distinct 3-wave pattern labelled A-B-C, with C reaching the 1.236 extension of A and finding resistance at the 100SMA (yellow). The low of Wave (A) respected the boundary of the lower line of the regression trend I have added to the chart. While this trend started prior to what I am considering Wave (A), I still think it provides a good target for the top of the retracement.
Wave (c) of A of (B) (still following me?) is not confirmed as complete yet. It could extend as far as $584 without pulling back, however I anticipate the market building more liquidity on the way up while burning options in the process. I bought 3/28 $570p at the end of the day in case we see a 50%-61.8% pullback to $560-$563 by the end of the week. If that happens, we should have enough room to reach the upper band at $585, which would be a little over a 50% retracement of Wave (A). This would also cause the price to touch the 200 SMA (green), which is common in the first major retracement of a bear market.
Lastly, from a psychological perspective, the market reached an overwhelmingly bearish consensus from mid-February to mid-March. Sentiment during Wave (a) was mostly bearish, but sentiment has shifted positive since the price entered Wave (c) and gapped up on Monday, resulting in a >+1% day. This sets the stage for a rug pull and subsequent bear trap for late sellers who will assume the downtrend has resumed prematurely.
We'll see how this plays out. I'll switch to calls if a higher high is made Wednesday 3/26. Good luck to all.

Nightly $SPY / $SPX Scenarios for April 2, 2025 🔮 🔮
🌍 Market-Moving News 🌍:
🇺🇸📈 President Trump’s 'Liberation Day' Tariff Announcement: President Donald Trump is set to announce new reciprocal tariffs on April 2, aiming to align U.S. import duties with those imposed by other countries on American goods. This move is expected to impact various sectors, including automotive and manufacturing, and may lead to market volatility as investors react to potential shifts in trade policies.
📊 Key Data Releases 📊
📅 Wednesday, April 2:
🏭 Factory Orders (10:00 AM ET):
Forecast: 0.6%
Previous: 1.7%
Indicates the dollar level of new orders for both durable and non-durable goods, reflecting manufacturing demand.
⚠️ Disclaimer: This information is for educational and informational purposes only and should not be construed as financial advice. Always consult a licensed financial advisor before making investment decisions.
📌 #trading #stockmarket #economy #news #trendtao #charting #technicalanalysis

SPY UpdateIt appears that intermediate (A) had OML to give us before it was finished. Price literally moved $0.08 cents below the larger 1.236 and then gave us a reaction. We also got better pos div completing the reqs for a healthier consolidation higher. If we have in fact bottomed, then I would expect the ensuing price action to resemble the dotted line I have drawn on the chart. This doesn't mean that price will follow this pattern to the T. It is just what a standard abc pattern would appear like. Don't forget that b waves are extremely complex more times than not, so that could alter the way this pattern gets carved out. Also, the dotted line may look straight, but the structure will be far from it. People often times forget that price doesn't move in one direction, and there will be choppy overlapping moves. Regardless on how the pattern turns out, if the (A) wave is in fact complete, then the target box is the standard place for intermediate (B) to terminate at.
I expect this next move to take 2-4 months if it is to compare to the time duration of the (A) wave. There are no rules governing duration, though. Technically speaking, (B) could be over by the end of the week. The odds of that happening are extremely low, but it is possible.
SPY Shows Strong BOS, But Faces Gamma Resistance at $563 (?)Market Structure (1H – SMC View):
* Price rebounded after BOS at ~$552 and has since broken multiple minor structure levels to the upside.
* Multiple Breaks of Structure (BOS) confirm bullish shift, with recent CHoCH validating demand zone below $550.
* Price is consolidating near a supply zone around $561–$563 which acted as a prior CHoCH zone.
Key Price Zones:
* Demand Zone (Support): $546–$552
* Supply Zone (Resistance): $561–$563 (where price currently sits)
* Macro Support: $550 = PUT wall + gamma support
* Micro Resistance: $563 = strong GEX call resistance
Trendlines + Price Action:
* Clean stair-step move up into resistance.
* Price approaching apex of recent flag-like structure; breakout confirmation needed.
* Watch for either rejection at this gamma wall ($563) or breakout continuation above.
Indicators:
* MACD: Bullish crossover still intact but showing slight flattening—watch for histogram weakness.
* Stoch RSI: Near overbought, curling—possible minor pullback or consolidation.
* 9 EMA > 21 EMA: Trend remains bullish for now.
Options Sentiment & GEX (from GEX Chart):
* IVR: 41.8 — moderately elevated, shows short-term volatility interest.
* IVx Avg: 25.4 — indicating steady option pricing.
* Put/Call Ratio: 84.5% puts — extremely defensive positioning in options market.
* GEX: 🚦Red, Yellow, Green — Neutral-to-bearish gamma zone.
* Major GEX Levels:
* Resistance / Gamma Wall: $563 – Highest positive NETGEX (major level to watch).
* Support / Gamma Cushion: $550–$555 – Includes PUT wall and GEX support.
Scenarios to Watch:
🟢 Bullish Case:
* Break & hold above $563 → potential rally toward $568+
* Confirmation of continued structure shift and gamma squeeze likely if open interest reshuffles upward.
🔴 Bearish Case:
* Rejection at $563 + failure to hold $560 → fast pullback to $555 or test of $550 demand zone.
* Watch for bearish divergence in MACD or failure to maintain EMA trend alignment.
Trade Ideas (Not Financial Advice):
* Scalp Long: If price confirms breakout above $563 with volume, target $568+
* Put Credit Spread or Long Calls: If holding above $560 with strong tape.
* Fade Setup: If SPY rejects $563 with bearish engulfing or momentum stalling, consider short to $555–$550.
🧠 Final Thoughts: SPY is at a decision point. Gamma wall at $563 could act as a ceiling unless there’s sufficient momentum + institutional call flow to drive a breakout. FOMC or macro catalysts could also be trigger points. Stay nimble.
This analysis is for educational purposes only and does not constitute financial advice. Always do your own research and trade responsibly.

FULL MOON and SPYHello traders! One of the great legends, OSHO, explains that if the moon has enough power to cause turbulence in the oceans, then why can't it affect human beings thinking and behaviors when the human body is made up of roughly 60% water? OSHO further explains that in history many people have been enlightened and many become mentally disturbed on days like a FULL MOON, and he explained that there must be a connection between planets positions and human behaviors.
Now, if it comes to trading SPY based on the moon phases, then I have backtested a few full-moon dates, and I have found something interesting that makes me think of incorporating a full-moon strategy while trading SPY/SPX or any other major index. I am not promoting astrology or abnormal ideas, but I want to share my research with you all because I found a connection and patterns in the behavior of SPY and the full moon. You are not forced to think about astrology in trading, but having knowledge and the ability to see patterns in the world can help you build your intuitive thinking and deep subconscious knowledge.
This year, taking Los Angeles as a reference, full moon dates were on Jan 13, Feb 12, and March 13. On January 13, the price showed a bullish run all day with low and high points of about 575.36 and 581.69, respectively. The similar bullish run was observed on February's full moon day, i.e., on 12th February, when SPY showed a low of 598.41 and a high of 604.52, making the market bullish all day. In contrast, we have observed a sharp decline in SPY on March 13, 2025 (full moon), which could seem to invalidate the full-moon strategy, but in the long run, SPY and the SPX Index remain bullish most of the time.
Carefully observing previous year (2024) full-moon dates, I have found that SPY opened 4 times gap-up on full moon dates (May 23 2024, July 21 2024 (market off but gap-up next session), October 17 2024, December 15 2024 (market off but gap-up next trading session). 5 times out of 12 were classified as bullish to strongly bullish: January 20 2024 (Bullish after 11:00 AM PST), March 25 2024 (sideways market but bullish overall), April 23 2024 (Bullish), August 19 2024 (bullish), and September 18 2024 (bullish after 9:00 AM PST). The market remains gap-down and bearish two times on February 24 2024, and on November 15 2024.
Now, since I have found that the SPX Index remains bullish on most of the FULL MOON dates, and the chances of a gap-up opening on or the next day of the FULL MOON (in case the market is closed on the FULL MOON) are very high based on the results obtained from the PY 2024 and 2025 previous months. The next FULL MOON is on Saturday, 12th April 2025, and the market is closed on this date; therefore, on 14th April 2025, if the market repeats itself, then I can expect SPY to open gap-up, and it would be interesting to see if FULL MOON really has the power to influence the stock market. Let’s give it a try, and on 11th April, 2025, if the market gives signs of huge buying pressure, then I will be buying some calls expiring April 14th, 2025, to test the full moon strategy.
I am the only writer of this article, so there are high chances that I might have made some mistakes while publishing. Therefore, I would be happy to see if you can correct me if I'm wrong or if you can share your own knowledge and insights about the relationship between MOON and SPY. Thoughts and comments?

overview after the close quick overview after the close. I wasn't happy with the pump at the end of the day but I still lean bearish for some reasons I discuss.

Bear flag on 1hr chartDecent size bear flag on 1hr chart. It’s looks like it setting up for tomorrow. It is currently breaking the bottom trend line and completing the pattern. If it rejects we could see it bounce one more time before the drop tomorrow. If this closes at 555-556. We could see in the next couple of days 540-545.

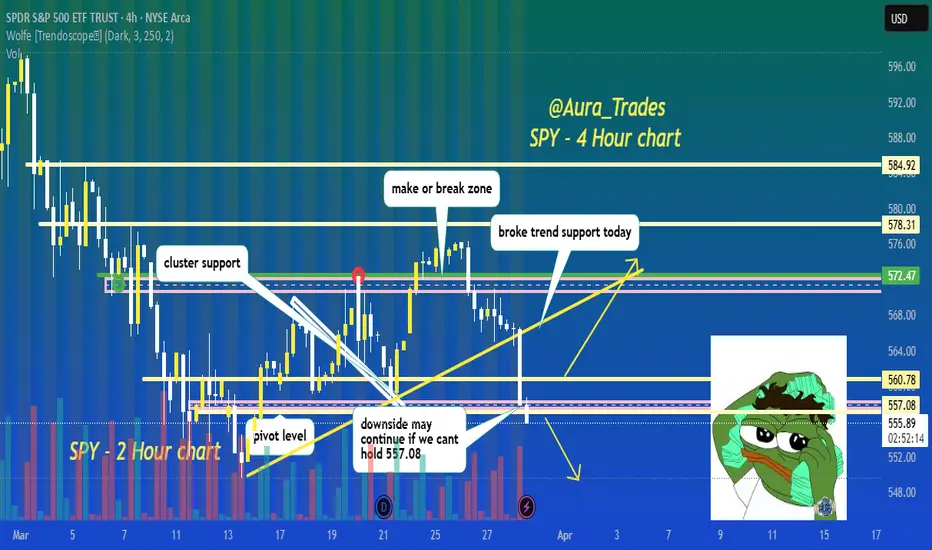
SPY is breaking support! can it reclaim?bearish break of trend support and pivot level today, if it cant reclaim 557 by close we probably see more downside next week, break above 560.78 and the bulls can start to run it back higher
boost and follow for more! 🔥
SPY at a Pivotal Zone – Bounce or Breakdown? 🧠 Market Structure + Price Action (1H)
* Trend: Downtrend confirmed. Recent Break of Structure (BOS) followed a Change of Character (CHoCH) from bulls to bears.
* Bearish momentum intensified after SPY broke support near 570.90, then plummeted through 564.85 and 558.11 key demand levels.
* Current price: 554.15 — bouncing slightly within a local demand/reaction box, but still under selling pressure.
* Price is now consolidating below structure, but inside a potential reaction zone (possible dead cat bounce or minor retracement).
🔍 Smart Money Concepts (SMC)
* CHoCH & BOS align with institutional exit behavior. The BOS confirms bearish intent.
* SPY has entered a minor demand zone, but hasn’t reclaimed any bullish market structure yet.
* If it breaks below 549.68, the next support zone opens toward the 540s.
🔁 Indicators
MACD:
* MACD is starting to curve up, with histogram showing decreasing red momentum – a potential bounce brewing.
Stoch RSI:
* Oversold condition with both lines crossing upward — supports a short-term relief rally or retracement.
🔥 GEX & Options Sentiment Analysis
* IVR: 37.8 (Moderate); IVx Avg: 22.6
* Put Positioning: Very high at 71% — bears are loaded up.
* GEX Sentiment:
* GEX is red 🔴🔴🔴 — strong gamma exposure to puts, favoring downward pressure.
* Highest negative NETGEX / PUT Support at 555.83, which is just above current price — this acts as a magnet and pivot.
* If SPY stays below this level, dealer hedging accelerates selling.
* Major Put Walls at:
* 545: GEX8 at -22%
* 544-540: Very deep bearish gamma — potential acceleration if we break lower.
* Call Resistance (Gamma Wall):
* 573 → 577 → 580 zone = Gamma ceiling.
* Dealers short calls here and hedge by selling, which adds resistance on rallies.
⚖️ Trade Scenarios
🐂 Bullish Reversal Setup:
* Trigger: Break & close above 555.83 with volume.
* Target: 558.11 → 564.85
* Invalidation: Below 549.68
* Risk/Reward: Favorable if volume confirms.
🐻 Bearish Continuation Setup:
* Trigger: Break below 549.68 with follow-through.
* Target: 545 → 540 zone (GEX & PUT walls)
* Stop-Loss: Above 555.83 or structure retest
* Confluence: GEX alignment + broken structure + dealer flow pressure.
🧭 Directional Bias:
Bearish bias still intact — but signs of short-term bounce forming. Likely we see a dead cat bounce unless 555.83 is reclaimed with conviction.
🎯 Actionable Strategy:
* Intraday scalp: Long toward 558 if price reclaims 555.83.
* Swing short: Below 549.68 toward 540 using SPY or PUT options.
⚠️ Disclaimer:
This analysis is for educational purposes only. It does not constitute financial advice. Always do your own research and manage your risk.

$SPY April 2, 2025AMEX:SPY April 2, 2025
15 Minutes
Downtrend intact as long below 200 in 15 minutes for the day.
For the fall 570.02 to 546.87 AMEX:SPY has retraced to 61.8 level around 561.
For the rise 546.87 to 560.69 holding 552-553 is important.
For the day consider the last rise from 552.73 to 560.69.
Holding 555-556 we can expect 561-563 as target for the day. It should be resisted around 564-565 being 200 averages in 15 minutes.

SPY/QQQ Plan Your Trade For 4-1-25 : Temp Bottom PatternToday's pattern suggests the SPY/QQQ will attempt to find temporary support near recent lows or a bit lower.
I'm not expecting much in terms of price trending today. I do believe the downward price trend will continue today with the SPY attempting to move down to the 548-550 level trying to find support.
The QQQ will likely attempt to move downward toward the 458-460 level trying to find the support/base/bottom level today.
Gold and Silver are in a moderate consolidation phase that I believe is transitioning through a Flag-Trend-Flag-Trend-Flag-Trend type of phase. Ultimately, the trend will continue to push higher through this phase as metals have moved into the broad Expansion phase. This phase should see gold attempt to move above $4500+ before the end of May/June 2025.
BTCUSD is rolling within the 0.382 to 0.618 Fibonacci price levels related to the last price swing. I see this middle Fib level and the "battle ground" for price. I expect price to stall, consolidate, and roll around between these levels trying to establish a new trend.
Thus, I believe BTCUSD will move downward, attempting to move back down to the $78,000 level.
Nothing has really changed in my analysis except that we are experiencing a 48-96 hour consolidation phase before we move back into big trending.
Play smart. Position your trades so that you can profit from this rolling price trend and prepare for the bigger price move downward (targeting the bigger base/bottom near April 15, 2025).
Get some.
#trading #research #investing #tradingalgos #tradingsignals #cycles #fibonacci #elliotwave #modelingsystems #stocks #bitcoin #btcusd #cryptos #spy #gold #nq #investing #trading #spytrading #spymarket #tradingmarket #stockmarket #silver

Nightly $SPY / $SPX Scenarios for April 1, 2025🔮 🔮
🌍 Market-Moving News 🌍:
🇺🇸📈 ISM Manufacturing PMI Release: The Institute for Supply Management (ISM) will release its Manufacturing Purchasing Managers' Index (PMI) for March. A reading below 50 indicates contraction in the manufacturing sector, which could influence market sentiment.
🇺🇸🏗️ Construction Spending Data: The U.S. Census Bureau will report on February's construction spending, providing insights into the health of the construction industry and potential impacts on related sectors.
🇺🇸📄 Job Openings Report: The Job Openings and Labor Turnover Survey (JOLTS) for February will be released, offering a view into labor demand and potential implications for wage growth and consumer spending.
📊 Key Data Releases 📊
📅 Tuesday, April 1:
🏭 ISM Manufacturing PMI (10:00 AM ET):
Forecast: 49.5%
Previous: 50.3%
Assesses the health of the manufacturing sector; a reading below 50% suggests contraction.
🏗️ Construction Spending (10:00 AM ET):
Forecast: 0.3%
Previous: -0.2%
Measures the total value of construction work done; indicates trends in the construction industry.
📄 Job Openings (10:00 AM ET):
Forecast: 7.7 million
Previous: 7.7 million
Provides insight into labor market demand by reporting the number of job vacancies.
⚠️ Disclaimer: This information is for educational and informational purposes only and should not be construed as financial advice. Always consult a licensed financial advisor before making investment decisions.
📌 #trading #stockmarket #economy #news #trendtao #charting #technicalanalysis

SPY/QQQ Plan Your Trade EOD Update : Rejecting The BreakdownDoes this big rejection bar mean the selling trend is over?
I doubt it.
In my opinion and experience, big rejection bars like this reflect a critical price level where the markets will attempt to REVISIT in the near future.
Normally, when we get a big rejection bar, like today, we are testing a critical support/resistance level in price and you can see the difference between the SPY, DIA and QQQ charts.
The QQQ price data is already below the critical support level and barely trying to get back above the rejection level. Whereas the SPY and DIA are still above the rejection lows.
I see this as a technology driven breakdown and because of the continued CAPTIAL SHIFT, we may move into a broader WAVE-C breakdown of this current trend.
I see the SPY already completing a Wave-A and Wave-B. If this breakdown plays out like I expect, we'll see a bigger breakdown in price targeting $525-535, then possibly reaching $495-505 as the immediate ultimate low.
If you follow my research, there is a much lower level near $465-475 that is still a likely downward target level, but we'll have to see how price reacts over the next 2+ days before we can determine if that level is still a valid target.
Watch for more support near recent lows tomorrow, then a potential breakdown in the SPY/QQQ/DIA.
Get some.
#trading #research #investing #tradingalgos #tradingsignals #cycles #fibonacci #elliotwave #modelingsystems #stocks #bitcoin #btcusd #cryptos #spy #gold #nq #investing #trading #spytrading #spymarket #tradingmarket #stockmarket #silver

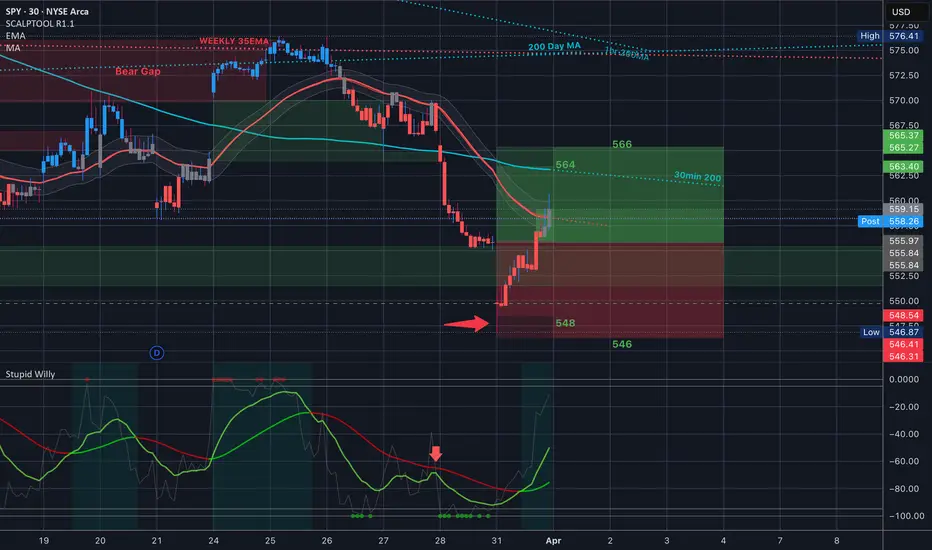
$SPY BOOOM Perfectly Nailed the Bottom in last nights video
548/546 Bull put spreads were the money play today on that drop. And of course that would have been the place to go long on the day.
SPY timing for low Tgt $585My short idea target was hit (and blown yesterday, tho QQQ idea was almost perfect), and if you saw the last idea, I mentioned the date of the 11th was in play. This seems accurate from what I'm getting now with my dowsing work.
I am quite pumped that the timing was so good. The upside target (repeating) is around $585. When I ask what date this hits by, I get 3/25. We shall see if lightning can strike twice!
