Nightly $SPY / $SPX Scenarios for June 20, 2025🔮 Nightly AMEX:SPY / SP:SPX Scenarios for June 20, 2025 🔮
🌍 Market-Moving News 🌍
🏦 Fed Holds Rates, Warns on Tariffs
Fed kept interest rates steady on June 19, cautioning that tariffs could stoke inflation and slow growth. Inflation projections were raised from 2.7% to 3.0%, while growth estimates were revised lower to 1.4%
🌍 Middle East Risk Drags Markets
Global stocks fell and safe-haven assets surged after U.S. futures weakened amid heightened tensions in the Israel–Iran conflict. Yields were mixed: gold weakened and bonds gained, while oil held steady near seven-week highs
📈 Treasury Yields Edge Higher
Despite safe-haven demand, U.S. 10‑year yields ticked up as markets absorbed the Fed’s updated rate outlook. The yield curve remains elevated ahead of next week’s $38 bn auction of long-dated notes
📊 Key Data Releases 📊
📅 Friday, June 20:
(No major U.S. economic reports)
Markets will be driven by Fed commentary follow-ups and geopolitical headlines over the weekend.
⚠️ Disclaimer:
This information is for educational and informational purposes only and should not be construed as financial advice. Always consult a licensed financial advisor before making investment decisions.
📌 #trading #stockmarket #economy #geopolitics #fixedincome #inflation #charting #technicalanalysis
SPY trade ideas

Choppy daySPX closed under the channel trendline which I think bodes well for bears. Gold looks like it's breaking down. Nat Gas looks strong. USOIL looks like it will go higher. BTC is at support.

SPY/QQQ Plan Your Trade For 6-19: GAP Reversal Counter TrendToday's pattern is a GAP Reversal in Counter Trend mode. I believe this could represent a breakdown in the ES/NQ as the US stock market is closed for the Juneteenth holiday.
Obviously, after the Fed comments yesterday (stating "uncertainty") and with the continued Israel/Iran conflict playing out, it makes sense to me that the US markets would move into a pre-weekend consolidation phase.
Even though the US stock market will be closed, the futures market will likely stay open and will carry some general market sentiment and reactions to news.
Watching Gold/Silver and Bitcoin should be very interesting today. I suspect the markets will continue to consolidate downward today - leading to a potential breakdown seeking support day on Friday.
Buckle up. We'll likely have 3-5+ days of news related to the Israel/Iran conflict and other issues over this weekend. It could be very interesting to see how the global markets move through this news.
Get some.
Happy Juneteenth
#trading #research #investing #tradingalgos #tradingsignals #cycles #fibonacci #elliotwave #modelingsystems #stocks #bitcoin #btcusd #cryptos #spy #gold #nq #investing #trading #spytrading #spymarket #tradingmarket #stockmarket #silver

$SPY Call Credit Spread for 7/3 Expy IdeaAMEX:SPY Call Credit Spread
+1 $604 call 7/3
-1 $600 call 7/3
~$200 credit
1:1 risk:reward
Breakeven @ Expy = $602
We'll see...

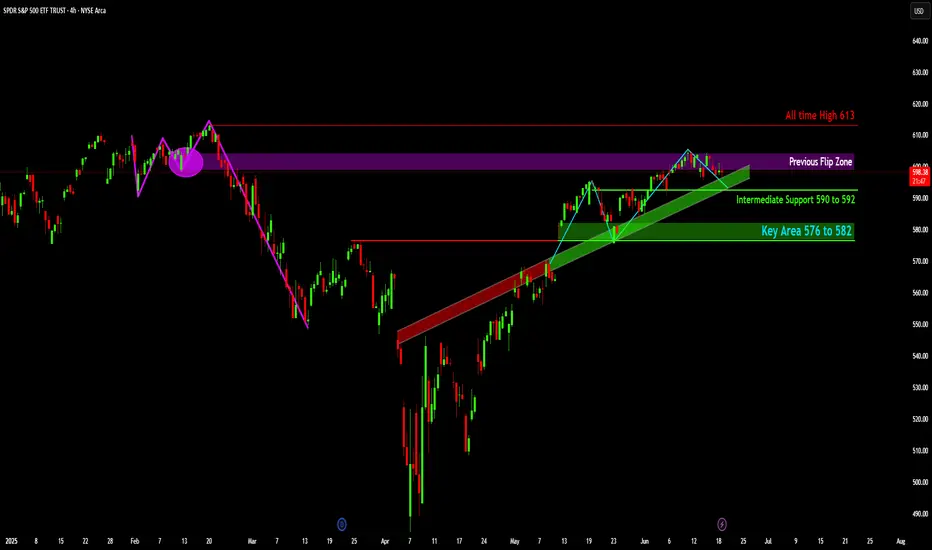
SPY: What's Next After the Resistance Retest?
The price action of SPY, shows a significant decline from early February highs, followed by a strong recovery and an established uptrend from mid-April.
Price is currently testing the "Previous Flip Zone" (indicated by the purple shaded area), a level that previously acted as support before the market's sharp decline and has since been retested as resistance.
The "All time High 613" is marked as a major overhead resistance level, representing the peak achieved before the February drawdown.
An "Intermediate Support" zone is identified between 590 and 592, coinciding with the upward-sloping green trendline that has supported the recent rally.
A "Key Area" of support is highlighted further down between 576 and 582, indicating a more substantial demand zone should the intermediate support be breached.
Disclaimer:
The information provided in this chart is for educational and informational purposes only and should not be considered as investment advice. Trading and investing involve substantial risk and are not suitable for every investor. You should carefully consider your financial situation and consult with a financial advisor before making any investment decisions. The creator of this chart does not guarantee any specific outcome or profit and is not responsible for any losses incurred as a result of using this information. Past performance is not indicative of future results. Use this information at your own risk. This chart has been created for my own improvement in Trading and Investment Analysis. Please do your own analysis before any investments.
SPY/QQQ Plan Your Trade For 6-18 : GAP Potential PatternToday's GAP Potential pattern suggests the SPY/QQQ may GAP a bit higher at the open, then move into a melt-up phase, trying to identify resistance, then roll into a topping pattern and move downward.
I believe the recent "rollover" of the markets (initiating last Friday with the Israel/Iran conflict) is still dominating the markets and news related to the ongoing conflict could drive a moderate pullback in US assets.
Headed into the Juneteenth holiday (Thursday, June 19), I suggest traders prepare for the US markets to move into somewhat of a SETTLEMENT mode today - where traders don't want to hold too many open positions into Friday's trading.
Additionally, Gold and Silver could move into a very strong upward price move over the next 4-5+ days. So be prepared for metals to hedge risks when the US stock market is closed.
BTCUSD seems to be struggling into the FLAG APEX. I'm waiting to see if my FLAG count is correct and if we get the breakdown in BTCUSD as I expect.
Get some.
#trading #research #investing #tradingalgos #tradingsignals #cycles #fibonacci #elliotwave #modelingsystems #stocks #bitcoin #btcusd #cryptos #spy #gold #nq #investing #trading #spytrading #spymarket #tradingmarket #stockmarket #silver

SPY repeating patternsSo just look at patterns that coincide with the RSI. Just keep an eye on the levels & channels & paly it smart

Nightly $SPY / $SPX Scenarios for June 18, 2025🔮 Nightly AMEX:SPY / SP:SPX Scenarios for June 18, 2025 🔮
🌍 Market-Moving News 🌍
💼 Business Inventories Flat in April
U.S. business inventories held steady in April, indicating stable consumer and wholesale demand. That suggests production won't need to cut sharply in the near term, supporting GDP outlook
🏭 Industrial Production Slips
Industrial output declined 0.2% in May, signaling ongoing weakness in factory activity amid less favorable global trade conditions .
🌐 Geopolitical Pressures Persist
Heightened tension in the Middle East continues to pressure risk assets. Investors remain focused on safe-haven flows into gold, Treasuries, and defensive equities, with analysts noting the risk backdrop remains tilted to the downside
📊 Key Data Releases 📊
📅 Wednesday, June 18:
8:30 AM ET – Housing Starts & Building Permits (May)
Measures new residential construction — leading indication of housing sector health.
8:30 AM ET – Initial Jobless Claims
Tracks the weekly count of new unemployment filings — useful for spotting early labor-market weakening.
2:00 PM ET – FOMC Interest Rate Decision
The Federal Reserve is expected to hold steady. Market focus will be on any commentary that hints at future tightening or easing plans.
2:30 PM ET – Fed Chair Powell Press Conference
Investors will parse Powell’s remarks for guidance on rate paths, inflation trends, and economic risks.
⚠️ Disclaimer:
This is for educational/informational purposes only and does not constitute financial advice. Consult a licensed advisor before making investment decisions.
📌 #trading #stockmarket #economy #housing #Fed #geo_risk #charting #technicalanalysis

(No) IdeaWhy the handle of "The Uncertain Trader"? Let's check the daily SPY (S&P 500 ETF) chart just after the close of 17 Jun 2025;
I've got no idea where this thing is going.
Thus the handle.
No one has any idea where this is going. If they insist they do they are selling you something. In the words of Brad Hamilton, "Learn it. Know it. Live it".
However, one must form a hypothesis to trade from, right or wrong. And TradingView has excellent tools to do so AND a FREE social network to share such theories.
Back to SPY, I have my suspicions;
SPY closed at 597.53, below it's all-time high of 611.39 (gray line and box) from Feb 19 and above it's 200 day simple moving average of 577.41 (purple line and box). Besides some support at 595.48 (arrow), which is way too close to be useful, and maybe resistance at Wed's high (also too close), there's really no other obvious support or resistance. So, it's ~14 points to the solid resistance at that significant high and ~20 points to support. If one goes long it's 20 points to be proven wrong, 14 points to the good and where the trade will likely stall - not a good reward to risk. Going short is a little better, with 20 points to support with 14 points of risk, but still a rather meager reward to risk.
And now factor in an FOMC meeting tomorrow (Wed 18th). SPY could easily hit one of those marks (2.3% up, 3.4% down), or both, tomorrow afternoon.
The (safer) play is to hold off, stay neutral, and let SPY resolve this, up or down. Let it test/hold it's all-time high or it's 200-day.
Again, I have no idea where this is going - just my theory.
And please, read the following and, again, "Learn it. Know it. Live it";
My ideas here on TradingView are for educational purposes only. It is NOT trading advice. I often lose money and you would be a fool to follow me blindly.

$SPY // June 17 2025 // CPI Analysis & Targets for Day TradersAMEX:SPY // June 17 2025 // CPI Analysis & Targets for Day Traders

SPY/QQQ Plan Your Trade for 6-17: Top Resistance PatternToday's pattern suggests the SPY/QQQ will move into a type of topping pattern, attempting to identify resistance, then roll away from that resistance level and trend downward.
I suggest the news related to the conflict between Israel & Iran may continue to drive market trends with traders moving away from uncertainty near these recent highs.
Silver makes a big move higher. Gold will likely follow later this week or early next week.
BTCUSD moves into a sideways FLAGGING pattern - possibly attempting a BIG BREAKDOWN event over the next few weeks.
Overall, the markets look like they are poised for a very big move - just waiting for the GREEN LINK (GO).
Stay safe. Protect capital and HEDGE.
Get some.
#trading #research #investing #tradingalgos #tradingsignals #cycles #fibonacci #elliotwave #modelingsystems #stocks #bitcoin #btcusd #cryptos #spy #gold #nq #investing #trading #spytrading #spymarket #tradingmarket #stockmarket #silver


SPY Breaks Rising Wedge! Gamma Wall Rejected. Jun 17SPY Breaks Rising Wedge! Gamma Wall Rejected — Bearish Momentum Building Into OPEX 🔻
🔬 GEX (Gamma Exposure) Sentiment Breakdown:
* Gamma Resistance Above:
* Gamma Wall / Call Resistance: $602
* $603–$604.50 = additional CALL walls (2nd & 3rd tier resistance)
* $606.37 = Local high; unlikely to reclaim without macro tailwind
* PUT Walls / Downside Zones:
* $597 = HVL + Key Flip Level
* $595 = 1st Major PUT Support (Highest negative NET GEX)
* $593 / $590 = deeper GEX-supported flush zones
* Options Flow Metrics:
* IVR: 19.4 (slightly below avg)
* IVx avg: 19
* PUT Flow: 91.5% 🟥
* GEX Sentiment: 🔴🔴🔴 (Bearish dealer positioning + skewed delta exposure)
* Interpretation:
* Heavy call rejection at $602 combined with high PUT flow suggests dealers are short gamma.
* If SPY closes below $597, gamma exposure flips net negative — potential acceleration into $595/$593.
🧠 15-Minute SMC Breakdown:
* Current Price: $598.00
* Structure Overview:
* Clean rising wedge break
* Two CHoCHs confirmed at top → shift from bullish to bearish control
* Price broke into demand box (~$597–$598), testing support
* Volume spiked on breakdown = institutional participation confirmed
* Trend View:
* Uptrend is broken.
* Now entering potential distribution-to-downtrend transition phase
🧭 Trade Scenarios:
🟥 Bearish Breakdown Setup (High Probability):
* Trigger: Clean breakdown below $597
* Target 1: $595 (GEX Put wall)
* Target 2: $593 / $590
* Stop-loss: Above $600.50
Gamma flip + SMC structure shift supports downside. Dealer flows likely exacerbate drop under $597.
🟩 Bullish Reclaim Setup (Low Probability):
* Trigger: Reclaim of $602 with volume
* Target 1: $604.50
* Target 2: $606.50 (high)
* Stop-loss: Below $597.50
Only possible with major market strength, such as dovish Fed cues or macro catalysts.
📌 My Thoughts:
* SPY is showing signs of weakness across the board — structure, options flow, and volume confirm sellers stepping in.
* Put flows are extreme (>90%), so bounces may be brief and used to reload shorts.
* This is not a dip to buy blindly — best play is momentum PUTs under $597, tight risk control.
* Ideal setup for zero-day or 1DTE options trades with defined exits.
📉 Conclusion:
SPY failed to hold $602 Gamma Wall, rejected hard, and now tests $597 support. With options sentiment flipping negative and SMC structure breaking down, a drop to $595 or lower is increasingly likely.
Disclaimer: This analysis is for educational purposes only. Always manage risk and trade based on your plan.

Nightly $SPY / $SPX Scenarios for June 17, 2025🔮 Nightly AMEX:SPY / SP:SPX Scenarios for June 17, 2025 🔮
🌍 Market-Moving News 🌍
📈 U.S. Retail Spending Holds Firm
May’s retail sales were flat month-over-month, defying expectations of a slowdown. Core retail sales (ex-autos) edged up +0.2%, signaling resilience in consumer purchases—an encouraging sign for economic momentum
🤖 Tesla’s Robotaxi Buzz Accelerates
Tesla stock surged after a weekend robotaxi video surfaced ahead of its planned Austin launch. A viral clip showed a Model Y “robotaxi” navigating traffic autonomously, sparking fresh investor enthusiasm despite safety debates
📊 BoJ Holds Rates; Dollar Edges Higher
Japan’s central bank left policy unchanged at 0.5%, maintaining its dovish bias. This lifted the dollar slightly versus the yen, drawing focus to global interest-rate divergence
📊 Key Data Releases 📊
📅 Tuesday, June 17:
8:30 AM ET – Retail Sales (May)
Consumer purchases are tracked, excluding autos. Monitor if activity stays steady despite inflation and rate pressures.
9:15 AM ET – Industrial Production & Capacity Utilization (May)
Provides insight into factory activity and plant usage—a gauge of economic health amid global slowdown concerns.
10:00 AM ET – Business Inventories (April)
Shows stock levels held by wholesalers and manufacturers. Higher inventories with weaker sales may signal slowing demand.
⚠️ Disclaimer:
This information is for educational and informational purposes only and should not be construed as financial advice. Always consult a licensed financial advisor before making investment decisions.
📌 #trading #stockmarket #economy #news #trendtao #charting #technicalanalysis

SPY: Watching for EntryWatching for entry on SPY. Guessing the fib sequences and what not. That should be enough for the note.

SPY/QQQ Plan Your Trade For 6-16 : Up-Down-Up PatternToday's Up-Down-Up Pattern suggests the markets will transition into a moderate upward trending price bar - which is quite interesting in the world we have today.
War and a big weekend of events, protests and other new items could drive market trends over the next few days.
Still, the SPY Cycle Pattern for today is an Up-Down-Up - which suggests last Thursday was an Up bar, last Friday was a Down bar, and today should be an Up bar.
The Gold/Silver pattern is a POP pattern in Counter-trend.
I believe the US markets are benefiting as a safe-haven for capital as the global turmoil drives global investors to seek safety and security for their capital.
That means as long as the world continues to spin out of control, the US markets and the US-Dollar will act as a moderate safe-haven for capital.
Gold and Silver should also benefit from this global chaos.
Bitcoin is benefiting from the strength of the US markets (and the technology sector) as well.
Let's see how this week start to play out. I'm waiting for some more news.
Could be very interesting this week.
Get some.
#trading #research #investing #tradingalgos #tradingsignals #cycles #fibonacci #elliotwave #modelingsystems #stocks #bitcoin #btcusd #cryptos #spy #gold #nq #investing #trading #spytrading #spymarket #tradingmarket #stockmarket #silver

Weekly $SPY / $SPX Scenarios for June 16–20, 2025 🔮 Weekly AMEX:SPY / SP:SPX Scenarios for June 16–20, 2025 🔮
🌍 Market-Moving News 🌍
🏦 Fed Holds Rates, Powell Expresses Caution
The Federal Reserve is widely expected to keep rates at 4.25–4.50%, though Chair Powell likely won’t provide fresh guidance. Markets see limited upside without stronger inflation or growth cues
💱 Dollar Strengthens on Geopolitical Risk
The U.S. dollar rose slightly as investors flocked to safe assets amid global tensions with Iran. Treasury yields eased slightly on risk-off flows
🛢️ Oil Near Multi-Week Highs on Mideast & OPEC Dynamics
Oil held near seven-week highs (~$67–70/barrel), buoyed by Iran-Israel tensions and OPEC+ output hikes (411K bpd added from May–July), offset by demand concerns .
⚠️ G7 Summit Faces Heightened Stakes
G7 finance ministers meet in Canada under pressure from Middle East escalation. Watch for policy coordination and commentary on trade, inflation, and global economic risks .
📊 Key Data Releases & Events 📊
📅 Monday, June 16
Regular markets open after Juneteenth holiday
Quiet day; oil & geopolitical headlines dominate
📅 Tuesday, June 17
8:30 AM ET – Retail Sales (May): Signals consumer spending strength/duration
8:30 AM ET – CPI (May): Confirms inflation trend post-CPI cooler reading
10:00 AM ET – Housing Starts & Building Permits (May): Gauges housing market demand
Unexpected Tesla Robotaxi Demo (Austin): Watch for surprise developments this week
📅 Wednesday, June 18
Global Central Bank Day: FOMC, BoE, BoJ policy updates; U.S. Fed will most likely hold steady
📅 Thursday, June 19 – Juneteenth Holiday – U.S. markets closed
📅 Friday, June 20
8:30 AM ET – Existing Home Sales (May): Measures U.S. housing activity
10:00 AM ET – Leading Economic Indicators (May): Early snapshot of economic momentum
⚠️ Disclaimer:
This information is for educational and informational purposes only and should not be construed as financial advice. Always consult a licensed financial advisor before making investment decisions.
📌 #trading #stockmarket #economy #news #trendtao #charting #technicalanalysis

S&P 500 OutlookS&P closed below the 9-EMA, showing there is weakness going into next week. Starting to build my watchlist when we get the bounce. If it closes back above the 9-EMA, then I'll start to look for entries.

$SPY Watchlist Plan: Week of 6/17Watchlist Plan: Week of 6/17
Stock Near All-Time High
Approaching ATH at 613.23 — key pivot zone
Break and hold above: Look for calls targeting momentum continuation (e.g., 620, 630 psychological levels)
Rejection off ATH: Look for puts targeting a retracement toward 599, then 568
Retracement and Support Zones
599: Micro support on smaller timeframes (15m/1h). Watch for intraday bounce or breakdown.
568: Key downside target if rejection at ATH confirms and 599 fails. Consider swing puts toward this level.
Also monitor the 585–590 range for potential consolidation or minor support.
Game Plan Triggers
Bullish confirmation:
Clean break and hold above 613.23 with strong volume
Market-wide risk-on tone (SPY, QQQ green)
Bearish setup:
Strong rejection at or below ATH
Market-wide pullback or macro weakness (especially in tech or consumer sectors)
Catalysts
June 17 (Monday): Retail Sales Report — gauge of consumer strength
June 18 (Tuesday): Unemployment Claims — snapshot of labor market health
Strong data may fuel market optimism
Weak data could tilt market bearish
Additional Notes
Watch for volume divergence near ATH — breakout with low volume can trap longs
Use pre-market action to frame bias: gap up with follow-through = strength; gap up followed by fade = weakness
Keep an eye on VIX and bond yields for macro pressure indicators
SPY Technical Analysis - Jun 16⏱️ 1‑Hour Chart Overview
Key Zones
* Support: $597–$601 — built on put-gamma support
* Resistance: $605–$607 — topped by call-gamma walls
Bias: Cautiously bullish — awaiting confirmation above $600–601
Trade Idea:
* Structure: Bull call spread (600/605 strikes)
* Targets:
* T1: $605 (initial gamma cap)
* T2: $607 (upper gamma wall)
* Invalidation: Break decisively below $595
Management:
* Entry: Buy near $600–601 with bullish candle and supportive volume
* Scaling: Start small and layer in if price holds
* Exit:
* Take partial profits at $605
* Trail to $607
* Exit if SPY drops below $595
Why It Works: Gamma flows from option expiries tend to provide momentum near the spread’s strikes, and the debit structure defines both risk and reward.
⏳ 15‑Minute Chart (Intraday Entry)
Setup Window: Zooming in for precise entry within 1‑hour framework
What to Observe
1. Pullback to $600–601
* Look for a bullish reversal candle (hammer, engulfing) on 15‑m
* Ideally, with increasing volume
2. Confirmation Signal
* Break above the high of that reversal candle
* Volume support confirms genuine demand
3. Momentum Alignment
* Pair with an intraday oscillator (e.g., Muscle mover, RSI rising)
* Candles should show higher lows or extended wick above support
15‑Minute Trade Rules
* Entry: Market or limit buy on a 15‑m candle closing above reversal high (~$601)
* Stop: Under that candle’s low (e.g., ~$599.50)
* Profit Scaling:
* Partial de‑risk at ~$605
* Full exit planned at ~$607
🚦 Multi‑Timeframe Strategy Summary
1‑Hour: Macro bias and strike framework
15‑Min: Precision entry zone & risk control
Spread Trade: Leverages GEX structure for momentum capture
Risk Defined: Debit known, stops clear
Upside Potential: Push toward gamma-neutralizing walls
Flow Edge: Option hedging dynamics predominantly active around spread levels
🧠 Watchlist
* Price behavior near $600–601 on 15‑m
* Volume surge with bullish candle
* Macro drivers: Fed noise, SPX futures action, sector rotation
* Shifts in implied volatility that may affect spread pricing
Trade with discipline — defined risk, entry precision, steady management.
Disclaimer: Not financial advice. All trading involves risk; do your own due diligence.

$SPY – Bearish Momentum Meets Spiral Timing🌀 AMEX:SPY – Spiral Timing, Macro Tension, and Bearish Momentum Brewing
Not financial advice. Short-term sentiment shifted bearish.
I’ve been tracking AMEX:SPY using both Fibonacci retracements and Fib spirals across the daily and weekly timeframes, and we’re now at a critical inflection zone. My sentiment has shifted more cautiously bearish in the short term, while acknowledging upside remains intact on the longer timeframes.
🔍 Macro Backdrop: Pressure Building
CPI Data (May) came in at 2.4%, slightly higher than April’s 2.3%, but still below forecast — showing inflation is sticky but not accelerating.
Geopolitical tensions between Israel and Iran flared again over the weekend, adding risk-off pressure to already fragile sentiment.
Market volatility remains high, with trillions of dollars swinging across a narrow window — validating shorter Fib cycles and accelerated price exhaustion.
🧭 Daily Chart Analysis: December 2024 High → April 2025 Low
I used a bearish Fib retracement from the December 2024 highs to the April 2025 lows.
SPY has now retraced nearly 100% of that drop, currently hovering between the 0.786 and 0.886 retracement levels — which often act as exhaustion zones in corrective rallies.
The Fib spiral from the April low shows we’ve lost the initial vertical trendline that marked the recovery leg — a shift in momentum tone.
MACD has remained flat for 16 sessions, with a bearish divergence confirmed on Friday (6/13/25).
Momentum, which briefly turned positive on Thursday, flipped sharply back negative by week’s end.
📆 Weekly Chart Structure: March 2020 → Feb 2025
The weekly spiral, drawn from the March 2020 low to the February 2025 high, reflects a similar pattern:
→ Price is moving beyond the arc and approaching the vertical time marker, a zone where reversals or expansions often occur.
Long-term trend remains bullish, but short-term action suggests compression ahead of a possible pullback.
🔥 Spiral Interpretation Reminder:
The Fib spiral doesn’t predict direction — it identifies time-based pressure points.
When price crosses the arc or vertical band, volatility often follows.
🎯 Key Trade Levels:
Breakdown Watch:
→ Close below $595, then $587 could trigger downside toward $560 (0.618) and $545 (0.5) levels from the retracement
Breakout Watch:
→ A confirmed breakout above $609 (full retrace from the Fib) would invalidate the short-term bear thesis and resume bullish continuation
🤔 Positioning Outlook:
I’m tactically bearish here. The technicals show:
Momentum divergence
Fib exhaustion
Spiral confluence
Macro pressure mounting
I don’t think the long-term trend is broken — but we’re entering a time window for volatility, and that often brings opportunity on both sides. Short setups may offer better risk/reward right now if we see confirmation.
Would love to hear your bias here — bear trap brewing or topping process?


$spyyieahh
Retest of mid line parallel.
Let's see how thos one works out, by 28 July we should see that touch of mid line and then boom or bust ?
