SDPY Weekly Chart (2-4 months projection)SDPY Weekly Chart (2-4 months projection) divergence, time to sell? yes for me
Just my idea, thought and wishes, nos financial advice
Key stats
About SPDR SERIES TRUST SPDR PORTFOLIO S&P 500 HIGH DIVIDEND ETF
Home page
Inception date
Oct 21, 2015
Structure
Open-Ended Fund
Replication method
Physical
Dividend treatment
Distributes
Distribution tax treatment
Qualified dividends
Income tax type
Capital Gains
Max ST capital gains rate
39.60%
Max LT capital gains rate
20.00%
Primary advisor
SSgA Funds Management, Inc.
Distributor
State Street Corp. (Fund Distributor)
SPYD offers a no-nonsense approach to high yield in the US large-cap space. The fund ranks all dividend payers in the S&P 500 by indicated yield (the most recent dividend, multiplied by dividend frequency, divided by share price) and selects the top 80. SPYD does not include any of the dividend sustainability or quality screens that are baked into some peer ETFs. SPYD equally weights its portfolio while some similar, income-focused funds weight by yield. It is worth noting that SPYD is placed in the large-cap segment due to its S&P 500 univers.
Related funds
Classification
What's in the fund
Exposure type
Finance
Utilities
Consumer Non-Durables
Stock breakdown by region
Top 10 holdings

dumping of dividendsnow looks like a time folks are building cash reserves, and dividends are heavy and looking like a top within this cycle. It ties in together nicely w/ folks dumping bonds and dividends. Risk off? I would like to buy up these in about 18 months-2 years for the long haul As I see both $spyd and $tlt

a better chart for anyone upset it was clear what I meant. 1st chart was a a bit vague for some people so i wanted to help clear up any miss understandings and make things much more clear. Trying to be helpful can come with its own learning curve. I hope this chart helps better explain the verbage its attached to with the one prior. Happy to help .

Fill the $37.85 Gap before the $36.85 It seems likely we fill the gap above Before the one below. Once we get Both of these gaps filled, we will then have a BIG decision ahead of us.
Most likely more Drama to come sooner than later but i could be wrong. Either way even if we claim 3800 back on the big boy and turn it into Temporary s

5/18/22 SPYDSPDR Series Trust High Dividend ETF ( AMEX:SPYD )
Sector: Miscellaneous (Investment Trusts/Mutual Funds)
Market Capitalization: $ --
Current Price: $43.04
Breakout price: $43.80
Buy Zone (Top/Bottom Range): $43.40-$42.40
Price Target: $44.20-$44.40 (1st), $46.20-$46.90 (2nd)
Estimated Duration to

Analysis-downtrendOn this chart we have an intersection between resistance and support. Additionally, we have a squeeze after an uptrend, which means sellers are pushing buyers away. We will have a downtrend.thanks.

SPYD Candlestick backtest 1HLooks like on the long side, Hammers are the best entry and ironically a bullish Harami is the best exit. On the Short side of things it looks like DarkClouds are the best entry and doji up is the best exit.
My reason for looking into SPYD is to improve my overall dividend portfolio.

$SPYD - loaded and readyChart looks amazing! There must be something else that will affect this...like "the sky will soon fall" mentality?
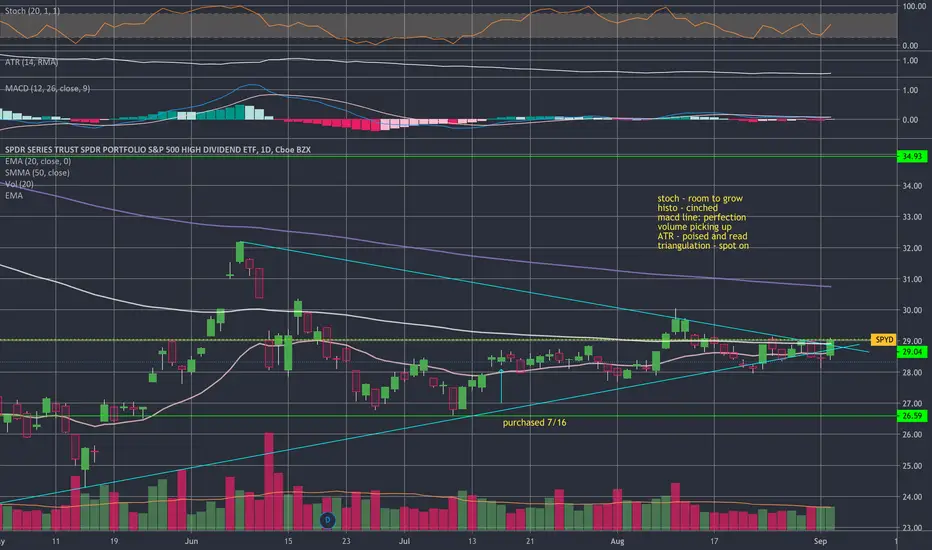
SPYD on the Move UpBut signal trigger from 9SMA sloping up, candle above the 9, MACD crossover and rising RSI. Looking for a 0.40-0.55 or until the buy signals are no longer valid.

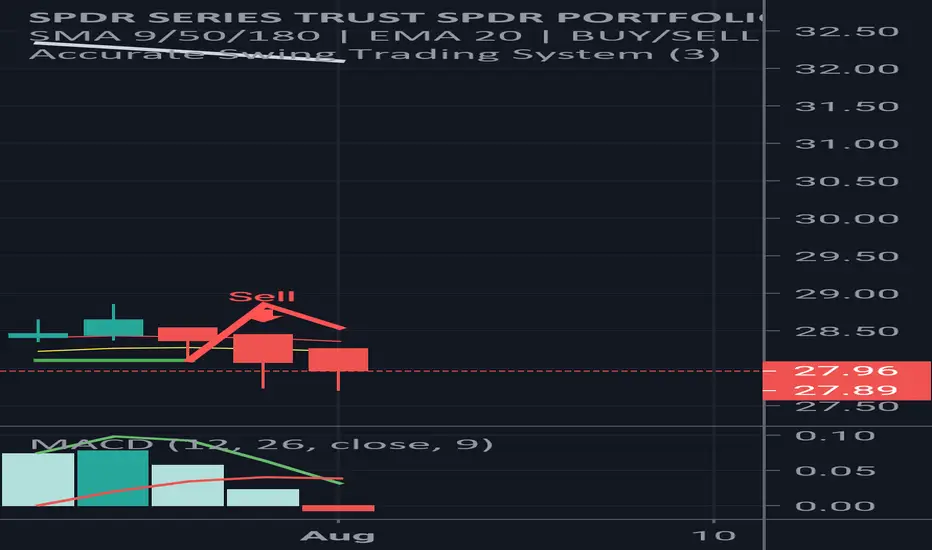
Temporary Short PlayThird day printing a bearish candle and now fully under the 9SMA with a negative MACD. Looking to short this for a couple days until the indicators turn around.
See all ideas
Summarizing what the indicators are suggesting.
Oscillators
Neutral
SellBuy
Strong sellStrong buy
Strong sellSellNeutralBuyStrong buy
Oscillators
Neutral
SellBuy
Strong sellStrong buy
Strong sellSellNeutralBuyStrong buy
Summary
Neutral
SellBuy
Strong sellStrong buy
Strong sellSellNeutralBuyStrong buy
Summary
Neutral
SellBuy
Strong sellStrong buy
Strong sellSellNeutralBuyStrong buy
Summary
Neutral
SellBuy
Strong sellStrong buy
Strong sellSellNeutralBuyStrong buy
Moving Averages
Neutral
SellBuy
Strong sellStrong buy
Strong sellSellNeutralBuyStrong buy
Moving Averages
Neutral
SellBuy
Strong sellStrong buy
Strong sellSellNeutralBuyStrong buy
Displays a symbol's price movements over previous years to identify recurring trends.
Frequently Asked Questions
An exchange-traded fund (ETF) is a collection of assets (stocks, bonds, commodities, etc.) that track an underlying index and can be bought on an exchange like individual stocks.
SPYD trades at 838.000 MXN today, its price hasn't changed in the past 24 hours. Track more dynamics on SPYD price chart.
SPYD net asset value is 809.65 today — it's fallen 0.13% over the past month. NAV represents the total value of the fund's assets less liabilities and serves as a gauge of the fund's performance.
SPYD assets under management is 127.59 B MXN. AUM is an important metric as it reflects the fund's size and can serve as a gauge of how successful the fund is in attracting investors, which, in its turn, can influence decision-making.
and its yearly performance shows a 24.15% increase. See more dynamics on SPYD price chart.
NAV returns, another gauge of an ETF dynamics, have risen by −0.13% over the last month, have fallen by −0.13% over the last month, showed a −9.63% decrease in three-month performance and has increased by 13.32% in a year.
NAV returns, another gauge of an ETF dynamics, have risen by −0.13% over the last month, have fallen by −0.13% over the last month, showed a −9.63% decrease in three-month performance and has increased by 13.32% in a year.
Since ETFs work like an individual stock, they can be bought and sold on exchanges (e.g. NASDAQ, NYSE, EURONEXT). As it happens with stocks, you need to select a brokerage to access trading. Explore our list of available brokers to find the one to help execute your strategies. Don't forget to do your research before getting to trading. Explore ETFs metrics in our ETF screener to find a reliable opportunity.
SPYD invests in stocks. See more details in our Analysis section.
SPYD expense ratio is 0.07%. It's an important metric for helping traders understand the fund's operating costs relative to assets and how expensive it would be to hold the fund.
No, SPYD isn't leveraged, meaning it doesn't use borrowings or financial derivatives to magnify the performance of the underlying assets or index it follows.
In some ways, ETFs are safe investments, but in a broader sense, they're not safer than any other asset, so it's crucial to analyze a fund before investing. But if your research gives a vague answer, you can always refer to technical analysis.
Today, SPYD technical analysis shows the sell rating and its 1-week rating is neutral. Since market conditions are prone to changes, it's worth looking a bit further into the future — according to the 1-month rating SPYD shows the buy signal. See more of SPYD technicals for a more comprehensive analysis.
Today, SPYD technical analysis shows the sell rating and its 1-week rating is neutral. Since market conditions are prone to changes, it's worth looking a bit further into the future — according to the 1-month rating SPYD shows the buy signal. See more of SPYD technicals for a more comprehensive analysis.
Yes, SPYD pays dividends to its holders with the dividend yield of 4.56%.
SPYD trades at a premium (5.37%).
Premium/discount to NAV expresses the difference between the ETF’s price and its NAV value. A positive percentage indicates a premium, meaning the ETF trades at a higher price than the calculated NAV. Conversely, a negative percentage indicates a discount, suggesting the ETF trades at a lower price than NAV.
Premium/discount to NAV expresses the difference between the ETF’s price and its NAV value. A positive percentage indicates a premium, meaning the ETF trades at a higher price than the calculated NAV. Conversely, a negative percentage indicates a discount, suggesting the ETF trades at a lower price than NAV.
SPYD shares are issued by State Street Corp.
SPYD follows the S&P 500 High Dividend Index. ETFs usually track some benchmark seeking to replicate its performance and guide asset selection and objectives.
The fund started trading on Oct 21, 2015.
The fund's management style is passive, meaning it's aiming to replicate the performance of the underlying index by holding assets in the same proportions as the index. The goal is to match the index's returns.