STWD on the moveGood momentum with volume after positive earnings.
Potential targets 21.30 / 21.90 from 20.22
Stop @ 19.65 +/- 3%
STWD trade ideas

STWD down off trendling to fill gap at 50% fib?Just sharing this idea. Seems like a pullback is imminent. Thoughts?

Blackstone and Starwood Capital Group Complete Acquisition of ExSTAY,BXMT,STWD: Extended Stay America, Inc.
2021-06-16 09:56:41
Blackstone and Starwood Capital Group Complete Acquisition of Extended Stay America

Blackstone and Starwood Capital Group to Acquire Extended Stay ASTAY,STWD,BXMT: Extended Stay America, Inc.
2021-03-15 08:00:00
Blackstone and Starwood Capital Group to Acquire Extended Stay America

$STWD - cup and handle or W?on the short list for watching.
The historgram on the MACD is nice.
Move could be over or could form a handle.


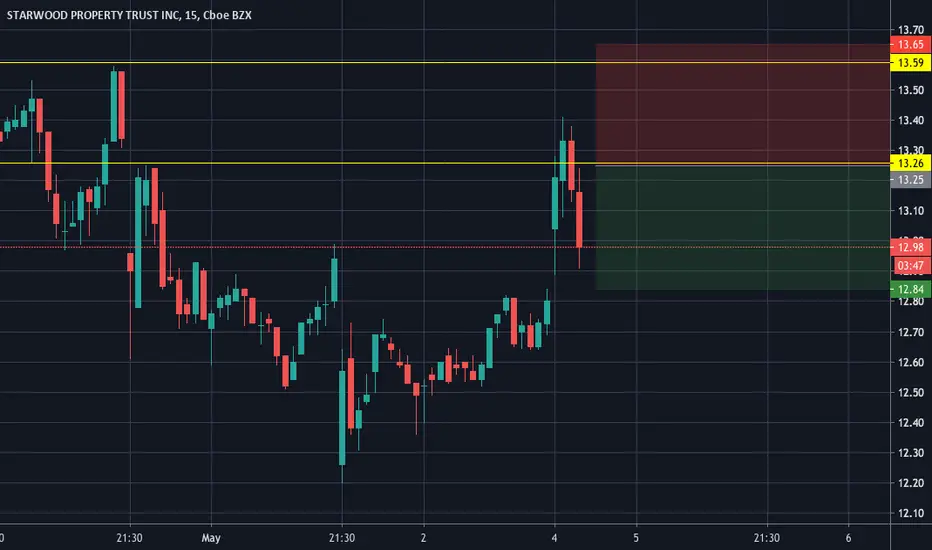
STWD ShortDaily resistance at 13.25 and 13.60. Entry at 13.3. TP at 12.80. Cut loss at 13.80.
Cause for the gap up is the positive earnings insights on the company.


STWD reaching upper limit, going strongLooks like this REIT will meet significant resistance soon. Opportunity for a short in the short term.
STWD change of trendAwaiting for price to retrace and confirm rejection/support on trendline.
SSB: As discussed on telegram, a double support on trendline and 50MA would be good. Ensure all/most indicators are bullish upon entry.

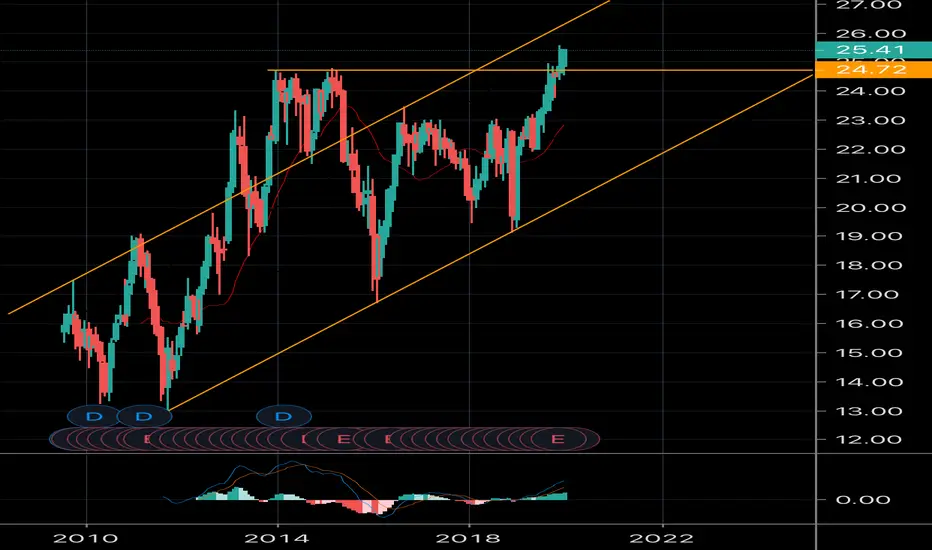
STWD: great valuation, massive uptrend and ready for more upsideSTWD has a very promising setup here, you can go long at market, risking 2% of your capital for a longer term position, or risking 0.5% with 90 cent risk per share.
Good luck!
Ivan Labrie.

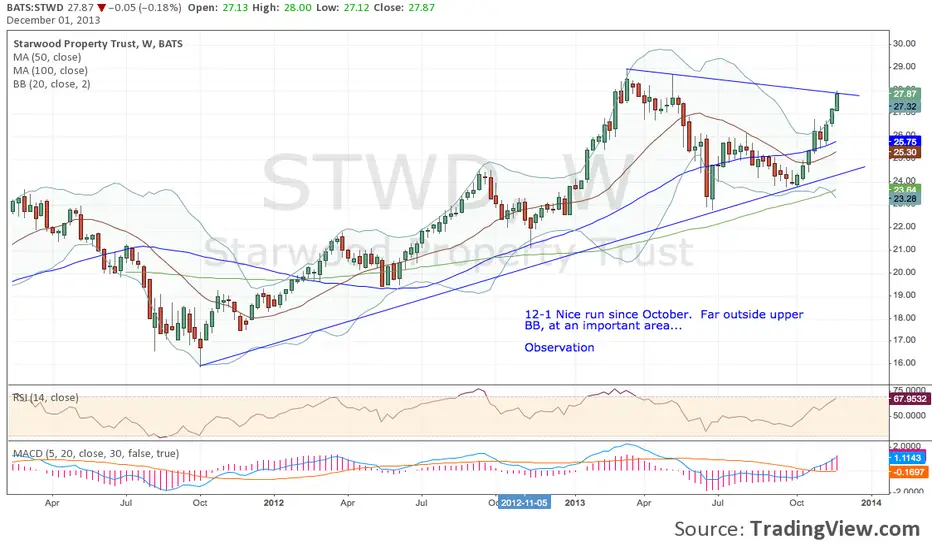
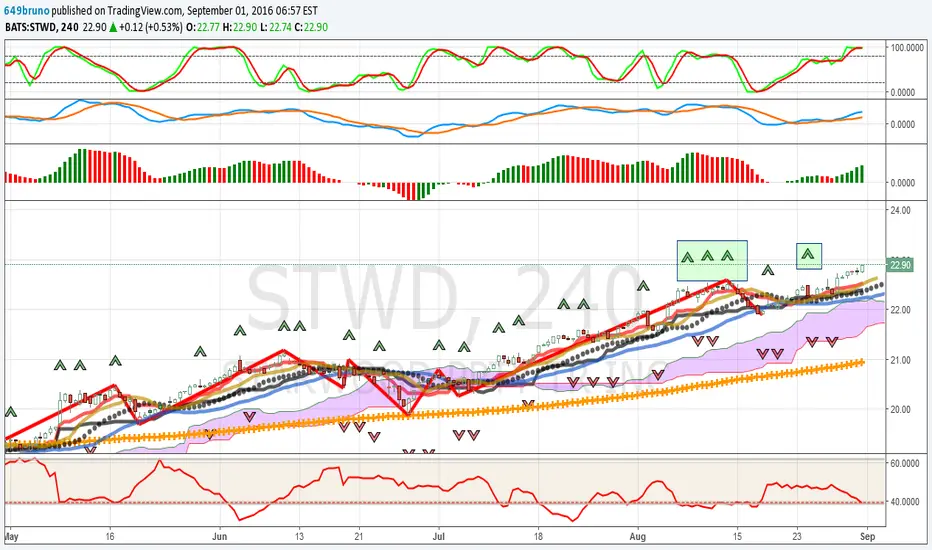
STWD Update: Bearish Three Drives PatternSTWD-has completed a bearish three drives pattern. (Three red arrows ).
This setup could forecast possible change in trend from up to down.
Negatives :
Bearish three drives pattern.
Four hour charts are already very negative.
The DMI-has become negative (top indicator).
Phase energy (top lower) has a downward trend.
Chop Zone (under chart) has gone from positive to neutral (green to white).
Conclusions :
This might be a perception that the Fed will raise in December, and real estate stocks might take a hit.
If you are long, my suggestion is to fade any rallies.
I hope that all of your trades go well. Don.

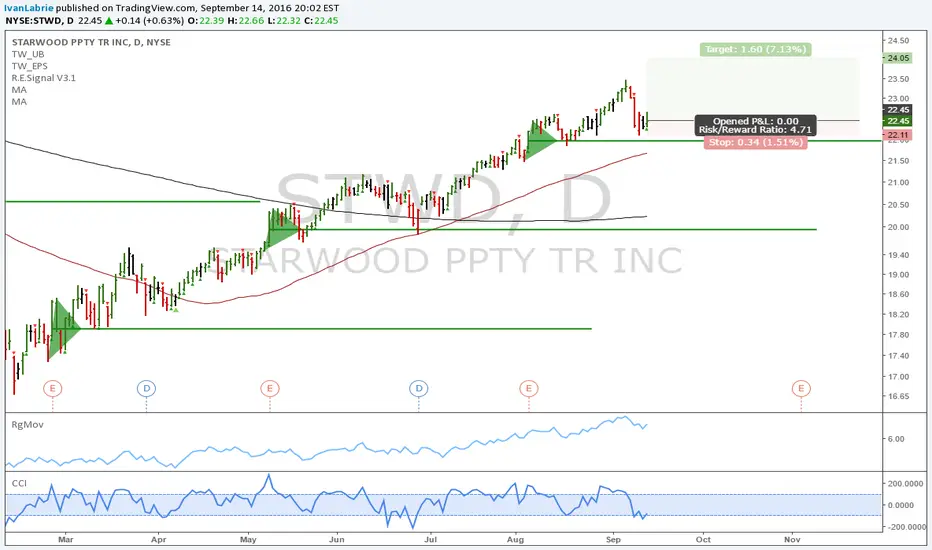
STWD: Looks like a good, low risk buyWe can enter longs here asap, risk 0.5% on this position, the uptrend might resume its upwards trayectory here.
The previous signal we got in this stock was great, I think we have good odds here as well.
Cheers,
Ivan Labrie.
Trending Now: STWD Continues Higher: Buy Fractals In EffectSTWD-had a very strong gap up move at the open.
Here are the positives:
1. Currently multiple buy Fractals (highlighted in green boxes). Note: the sell Fractals afterwards are not valid as they came with prices above alligator's jaw.
2. The lower indicator under the chart is CHOP; readings below the shaded area (38.2) indicate a strong trend. The STWD-trend is getting stronger.
3. The top lower indicator is phase energy, and this is positive. Very strong.
4. The alligator is feeding in the uptrend.
5. RSI / Stochastic (top indicator) is strong.
6. Prices are trading above the Ichimoku Cloud .
7. Prices are trading above the thick red Ichimoku Cloud conversion line.
8. Prices are trading above the Ki jun-Sen baseline of the Ichimoku Cloud and this has been HEADING HIGHER.
9. The 5/34 Momentum indicator (top middle) is strong.
10. The Ichimoku Cloud is rising.
11. The moving average trend line is rising.
In my opinion, STWD-is in a solid uptrend.
Good luck to you. Don.

Update: Starwood Property Trust Still In Strong UptrendThe strong technicals that I published in BAC-are also very similar in-STWD.
Here are the positives:
1. Currently multiple buy Fractals (highlighted in green boxes). Note: the sell Fractals afterwards are not valid as they came with prices above alligator's jaw.
2. The lower indicator under the chart is CHOP; readings below the shaded area (38.2) indicate a strong trend.
3. The top lower indicator is phase energy, and this is positive. Very strong.
4. The alligator is feeding in the uptrend.
5. RSI / Stochastic (top indicator) is strong.
6. Prices are trading above the Ichimoku Cloud .
7. Prices are trading above the thick red Ichimoku Cloud conversion line.
8. Prices are trading above the Ki jun-Sen baseline of the Ichimoku Cloud and this has been HEADING HIGHER.
9. The 5/34 Momentum indicator (top middle) is strong.
10. The Ichimoku Cloud is rising.
11. The moving average trend line is rising.
In my opinion, STWD-is in a solid uptrend.
Good luck to you. Don.
Update: STWD Trend Improves During Todays TradingThis morning I recommended Starwood-Property-Trust.
The stock is trending up and during the day the trend got stronger.
Please observe the indicator below the chart. This is CHOP.
There are two buy Fractals. As the buying pressure improves the CHOP line moves lower.
This indicates that the trend has IMPROVED.
Here is a summary for the positives in-STWD:
1. Currently two buy Fractals.
2. The lower indicator under the chart is CHOP; readings below the shaded area (38.2) indicate a strong trend, it is drifting towards that level.
3. The top lower indicator is phase energy, and this is positive.
4. The alligator is feeding in the uptrend.
5. RSI / Stochastic (top indicator) is strong.
6. Prices are trading above the Ichimoku Cloud .
7. Prices are trading above the thick red Ichimoku Cloud conversion line.
8. Prices are trading above the Ki jun-Sen baseline of the Ichimoku Cloud and this has been HEADING SHARPLY HIGHER.
In my opinion, STWD-is in a solid uptrend. I hope you establish your own "Rules of Engagement" and stand by them.
One final thought: if you swing trade and look left for structure, an understanding of trend enhances your probabilities of being correct.
Good luck to you. Don.

STWD: Starwood Properties: My Personal "Rules Of Engagement"What determines whether or not I take a position, up or down, in a stock, commodity, or futures contract?
WHAT IS THE SINGLE BIGGEST FACTOR THAT I SHOULD KNOW?
To me the answer is simple. Is what I am reviewing "TRENDING" or "RANGE BOUND"?
I need to know if a stock or commodity is trending. Why? RANGE BOUND assets are very hard to make money, long or short.
Let's look at Starwood-Properties.
Starwood Property Trust, Inc. is a real estate investment trust. The Company operates through three business segments: Real estate lending (the Lending Segment), which engages primarily in originating, acquiring, financing and managing commercial first mortgages, subordinated mortgages, mezzanine loans, preferred equity, commercial mortgage-backed securities, residential mortgage-backed securities, and other real estate and real estate-related debt investments; Real estate investing and servicing (the Investing and Servicing Segment), which includes servicing businesses in the United States and Europe that manage and work out problem assets; an investment business that selectively acquires and manages unrated, investment grade and non-investment grade rated-CMBS, and a mortgage loan business, and Real estate property (the Property Segment), which engages primarily in acquiring and managing equity interests in stabilized commercial real estate properties.
Their track record for growth and strong earning is well documented. Is-STWD TRENDING? Yes. How do I know?
Several things tell me. The buy Fractals. The rising Ichimoku Cloud. The rising trend-line. The Alligator is feeding in the up trend.
IMPORTANT : to determine the STRENGTH of the trend I use CHOP, (lower indicator below chart). The lower the red line the stronger the trend.
The higher the red line the more likely I will see "choppiness", or range bound trading. ( It is harder to make money with lots of chop ).
Right now CHOP tells me-STWD has a trend, the trend is strong, and the dashed line is the price trend in CHOP, so the trend will likely remain strong.
The lower the line is below the shaded area, the stronger the trend. For an example, look at the BAC-chart I published three days ago.
Here are the positives for-STWD :
1. Currently a buy Fractal.
2. The lower indicator under the chart is CHOP; readings below the shaded area (38.2) indicate a strong trend, it is drifting towards that level.
3. The top lower indicator is phase energy, and this is positive.
4. The alligator is feeding in the uptrend.
5. RSI / Stochastic (top indicator) is strong.
6. Prices are trading above the Ichimoku Cloud .
7. Prices are trading above the thick red Ichimoku Cloud conversion line.
8. Prices are trading above the Ki jun-Sen baseline of the Ichimoku Cloud and this has been HEADING SHARPLY HIGHER.
In my opinion, STWD-is in a solid uptrend. I hope you establish your own "Rules of Engagement" and stand by them.
One final thought: if you swing trade and look left for structure, an understanding of trend enhances your probabilities of being correct.
Good luck to you. Don.

STWD: Potential time at mode uptrendTim West discussed this chart in the Key Hidden Levels chatroom today.
I'm expanding the analysis here, presenting a potential 'Time at mode' uptrend signal after today's bullish action.
The trade implies going long tomorrow, if we open and close above the 18.52 mark, without retesting it, with a stop loss underneath this level (we can use ATR as well, or try multiple entries with different stop loss locations depending on our risk appetite).
Look to enter longs tomorrow, if we get confirmation. For the time being, keep this in your watch list, and make sure to subscribe to Tim's 'Key Hidden Levels' indicator pack, and join the chatroom for more ideas like this.
Cheers,
Ivan Labrie.