Symbotic Inc. (SYM) Grows With AI-Powered RoboticsSymbotic Inc. (SYM) is a leading provider of AI-powered robotics and automation systems for warehouses and distribution centers. Its advanced technology helps retailers and wholesalers improve efficiency, speed, and accuracy in inventory management and order fulfillment. The company’s growth is driv
Next report date
—
Report period
—
EPS estimate
—
Revenue estimate
—
−1.36 MXN
−265.80 M MXN
35.23 B MXN
43.85 M
About Symbotic Inc.
Sector
Industry
CEO
Richard B. Cohen
Website
Headquarters
Wilmington
Founded
2020
FIGI
BBG01LY5SLF0
Symbotic, Inc. is an automation technology company, which engages in a robotics and automation-based product movement technology platform. It focuses on developing, commercializing, and deploying innovative, end-to-end technology solutions for supply chain operations. It operates through the United States and Canada geographical segments. The company was founded by Richard B. Cohen on December 11, 2020 and is headquartered in Wilmington, MA.
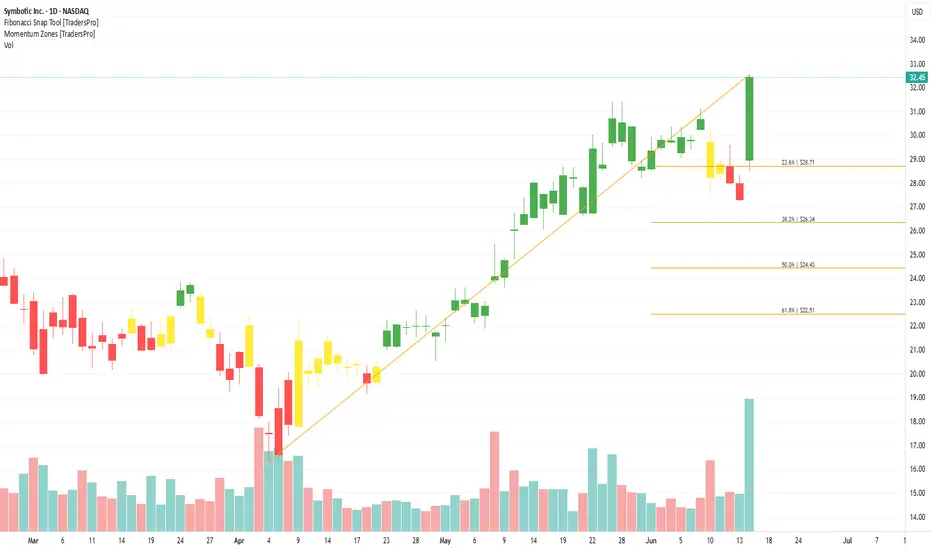
Breakout confirmed The price confirms last week's breakout, closing above the purple trendline.
The $17 area could also form a double bottom, but it is necessary to wait for the price to reach the neckline (around $40) to confirm it.
At the moment, the price is heading towards $34, where the weekly SMA100 (green lin

SYM formed double bottom SYM formed Double bottom pattern
Company Profile
Name: Symbotic Inc.
Ticker: SYM
Exchange: NASDAQ
Sector: Technology
Industry: Robotics / AI / Supply Chain Automation
Headquarters: Wilmington, Massachusetts, USA
Business Model: Provides AI-enabled robotics systems that automate warehouse oper

$SYM Long term hold and bullish outlook 6 months 🤖 Strategic Expansion with Walmart
In January 2025, Symbotic completed the acquisition of Walmart's Advanced Systems and Robotics business for $200 million, with potential additional payments of up to $350 million based on future orders. This acquisition is part of a broader $520 million agreement w

Symbotic Inc. (SYM) Bullish Opportunity – Growth & Momentum Play🔹 Current Price: $21.65
✅ TP1: $24.50 – Short-term bounce from support
✅ TP2: $30.00 – Key previous resistance level
✅ TP3: $40.00 – Next major resistance level ( long-term )
🔹Stop Loss: If trading with leverage, consider a stop below $18-$19.
🔥 Why Are We Bullish?
✅ Strong Revenue Growth
35% YoY

SYM, setup like TSLAThis chart reminds me of TSLA so much it hurts. A multi month correction forming a massive wedge. Do I care about the fundamentals of this robotic company that serves walmart warehouses? no. Does it fit a narrative that draws attention yes. A bottomed stochastic RSI is noted with a falling BBWP. Thi

HIGH RV; Symbotic's / Short-term long potential with earnings inShort-term long potential with earnings in about two weeks. Opening a long position with a stop 8% lower.
If the price continues higher, I’ll sell the majority before earnings but may hold around 20%.
This trade is taken with a small position size.

Symbotic $25.60 Buy.2024 was a bad year for Symbotic. The company were involved in some kind of accounting scandal, I don’t know the full facts but it sounds more like someone cocked up with the numbers rather than something more sinister.
As a result of this they are now being sued by investors which doesn’t help, so

Symbotic Hypergrowth? $850 Price TargetOverview
Symbotic Inc. is an A.I. and robotics automation company based in Wilmington, Massachusetts that is looking to increase the ability for companies to keep up with growing demand. To do this, they utilize artificial intelligence software to maintain records and warehouse organization with t

Symbotic has broken out and is about to SQUEEZE! 145% UpsideSymbotic NASDAQ:SYM has broken out and is about to SQUEEZE! 145% Upside
- Green on the High Five Setup Indicator
- Bull Flag Breakout held this week
- Sitting on a large volume shelf with a free range above the ATH area.
- 17%+ Short Float
- Wr% has created support in the consolidation box.
L

See all ideas
Summarizing what the indicators are suggesting.
Neutral
SellBuy
Strong sellStrong buy
Strong sellSellNeutralBuyStrong buy
Neutral
SellBuy
Strong sellStrong buy
Strong sellSellNeutralBuyStrong buy
Neutral
SellBuy
Strong sellStrong buy
Strong sellSellNeutralBuyStrong buy
An aggregate view of professional's ratings.
Neutral
SellBuy
Strong sellStrong buy
Strong sellSellNeutralBuyStrong buy
Neutral
SellBuy
Strong sellStrong buy
Strong sellSellNeutralBuyStrong buy
Neutral
SellBuy
Strong sellStrong buy
Strong sellSellNeutralBuyStrong buy
Displays a symbol's price movements over previous years to identify recurring trends.
Related stocks
Frequently Asked Questions
The current price of SYM is 535.00 MXN — it has decreased by −6.30% in the past 24 hours. Watch SYMBOTIC INC stock price performance more closely on the chart.
Depending on the exchange, the stock ticker may vary. For instance, on BMV exchange SYMBOTIC INC stocks are traded under the ticker SYM.
SYM stock has risen by 3.08% compared to the previous week, the month change is a 3.08% rise, over the last year SYMBOTIC INC has showed a −22.85% decrease.
We've gathered analysts' opinions on SYMBOTIC INC future price: according to them, SYM price has a max estimate of 1,134.26 MXN and a min estimate of 189.04 MXN. Watch SYM chart and read a more detailed SYMBOTIC INC stock forecast: see what analysts think of SYMBOTIC INC and suggest that you do with its stocks.
SYM stock is 6.73% volatile and has beta coefficient of 2.55. Track SYMBOTIC INC stock price on the chart and check out the list of the most volatile stocks — is SYMBOTIC INC there?
Today SYMBOTIC INC has the market capitalization of 67.00 B, it has increased by 1.02% over the last week.
Yes, you can track SYMBOTIC INC financials in yearly and quarterly reports right on TradingView.
SYMBOTIC INC is going to release the next earnings report on Aug 4, 2025. Keep track of upcoming events with our Earnings Calendar.
SYM earnings for the last quarter are 1.23 MXN per share, whereas the estimation was 0.86 MXN resulting in a 42.54% surprise. The estimated earnings for the next quarter are 0.90 MXN per share. See more details about SYMBOTIC INC earnings.
SYMBOTIC INC revenue for the last quarter amounts to 11.26 B MXN, despite the estimated figure of 10.70 B MXN. In the next quarter, revenue is expected to reach 10.11 B MXN.
SYM net income for the last quarter is −80.41 M MXN, while the quarter before that showed −72.47 M MXN of net income which accounts for −10.96% change. Track more SYMBOTIC INC financial stats to get the full picture.
No, SYM doesn't pay any dividends to its shareholders. But don't worry, we've prepared a list of high-dividend stocks for you.
As of Jun 17, 2025, the company has 1.65 K employees. See our rating of the largest employees — is SYMBOTIC INC on this list?
EBITDA measures a company's operating performance, its growth signifies an improvement in the efficiency of a company. SYMBOTIC INC EBITDA is −519.29 M MXN, and current EBITDA margin is −3.33%. See more stats in SYMBOTIC INC financial statements.
Like other stocks, SYM shares are traded on stock exchanges, e.g. Nasdaq, Nyse, Euronext, and the easiest way to buy them is through an online stock broker. To do this, you need to open an account and follow a broker's procedures, then start trading. You can trade SYMBOTIC INC stock right from TradingView charts — choose your broker and connect to your account.
Investing in stocks requires a comprehensive research: you should carefully study all the available data, e.g. company's financials, related news, and its technical analysis. So SYMBOTIC INC technincal analysis shows the buy rating today, and its 1 week rating is neutral. Since market conditions are prone to changes, it's worth looking a bit further into the future — according to the 1 month rating SYMBOTIC INC stock shows the strong buy signal. See more of SYMBOTIC INC technicals for a more comprehensive analysis.
If you're still not sure, try looking for inspiration in our curated watchlists.
If you're still not sure, try looking for inspiration in our curated watchlists.