(Live test) - Steve Primo #4 Setups (Day 1)Steve Primo - Setups for Tomorrow. Only Strategy #4. Stocks have been handpicked.
1. Strategy #4
2. Pet-D confirmed
T trade ideas

ATT BUYING OP!31.76 is the major support.
32.41 is the rising support
33.31 is the resistance
It's near the bottom of the trading range and has a 5% dividend.
Something to keep an eye on. 3/16

AT&T: Bat Pattern at The TrendlineI don't involve myself in the stock market as much as I used to but every once in a while I like to look about and see what's going on. AT&T caught my attention on the technical side (which is my specialty) for a few reasons.
Big picture (weekly) we're in consolidation in a pattern that is very similar to a bullish flag. Working our way down to the lower timeframes (daily)we've but in a series of higher lows. Our last cycle from NSH to our current OR shows hidden divergence as well which is a good sign of continuation.
Lastly on the 4hr we have a completed bat pattern down at $32.72. Key levels that I'd be focused on IF this price rallies are $33.60's, $34.15's and $35.00
Fundamentally I don't did into the numbers as much as I used to but the I personally like companies the offer dividends. I think it provides a bit of safety. Yes this company has some debt as well which is concerning, but with the risk being so small, it's certainly worth a shot in my opinion

Maybe heading towards another rallyAfter the resistance $T met with the 200 SMA line, is it time for it to rally and complete the bearish Bat pattern shown in the chart?
Possible bullish trading scenario with stops below 33.5$ and targets at 34.8$ and 35.8$

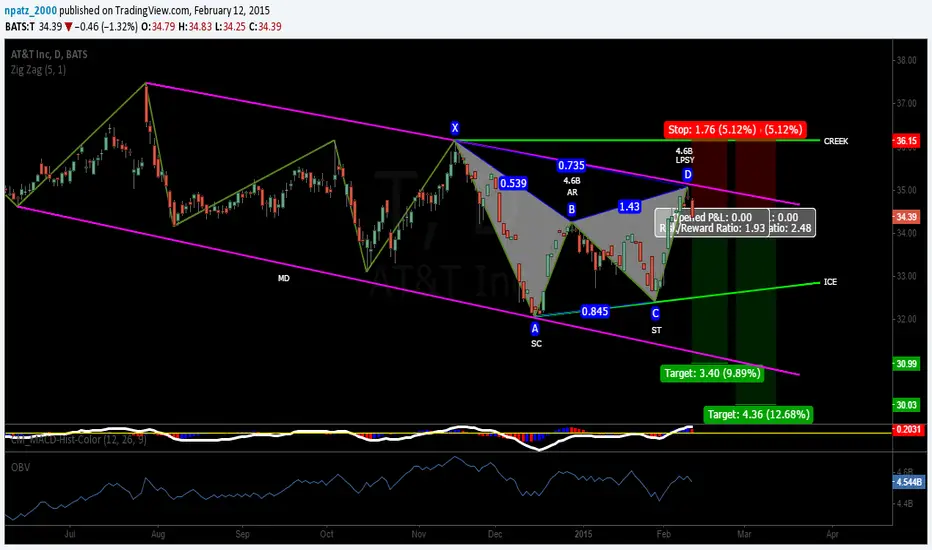
WYCKOFF SHORT ON AT&TThis is a combination of Wyckoff and price action. There are many names for this rally up to the upper channel line of the bearish channel, such as "Second Entry", "2 Leg Pullback", "Gartley", and of course "Redistribution". I think this shows an important aspect of trading. Even though there are many different methodologies regarding successful trading, at their core they are very similar. The "Second Entry" and "2 Leg Pullback" are terms taken from Price Action. "Gartley" is from Harmonic Trading. And "Redistribution" is of course from Wyckoff. And proponents from all of these methodologies would probably agree that a multi leg pullback within a channel is a high probability pattern for a continuation in the direction of the channel, in this case Bearish. Of course, a break of the high at "X" (AKA CREEK) would negate the bias, so that is where to put the stop. First Target is AB=CD extension with R:R of 1:1.93. Second Target is at the 1.236 Fib Ext with R:R 1:2.48. There could be support at the ICE level, so this would be a good spot to either tighten the stop or take off a portion of the position. Entry is on a 3 bar swing high, with the close of bar 3 below the lows of both bars 1 & 2. Plus the Wyckoff test, the volume on both the swing high at "B" and "D" are the same, even though the swing high at "D" is obviously higher than "B", indicating no support for higher prices. Good luck to all.
FYI - I am using a Zig Zag (5,1) and OBV only for this analysis.


AT&T Probably Ready To Short Breakout has theoretically began with force but can still get in on the momentum.
Rest of the notes on chart

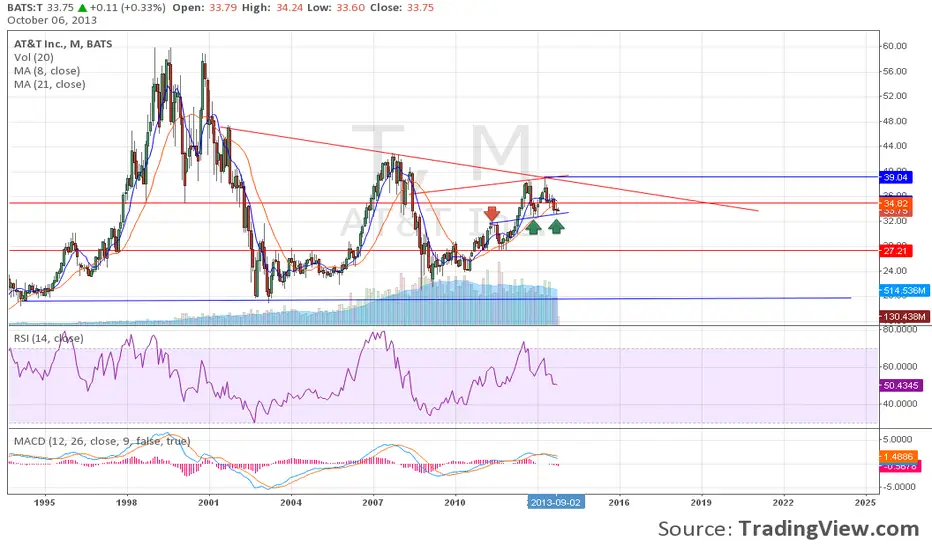
Is $60 a long-term target for AT&T?Many traders have seen a rising band on the chart of AT&T since 2009, followed by consolidation since 2013, which looks like a pattern continuing the flag trend.
But in general, there is nothing interesting.
If we look at the weekly or monthly section of the chart, we will see a triangle, which rose up on the fifth classical wave. It is too early to think that now the triangle will begin to draw up the height of the base, and the prices will make it to $80. But the peak of the first wave of the triangle at $60 is a realistic target over the mid-term.
I am taking part in Market Forecaster Contest. Vote for my forecast at s30140065784.whotrades.com and help me win first prize. Thank you!


AT&T - Ready to fall after a atcrazy rallySorry for the typo in the title.
AT&T has been forming divergences for quite some time and I believe it is ready to fall. Double class A bearish divergence on the MACD lines, double divergence on the MACD histogram, Class A bearish divergence on the 13 day FI and class B bearish divergence on the 2 day FI. All happening at a very important resistance area, after a crazy rally. Stop is at 37$ and targets at 34 and 33.50.
Weekly here : Not saying that much, but doesnt forbbid shorting either.

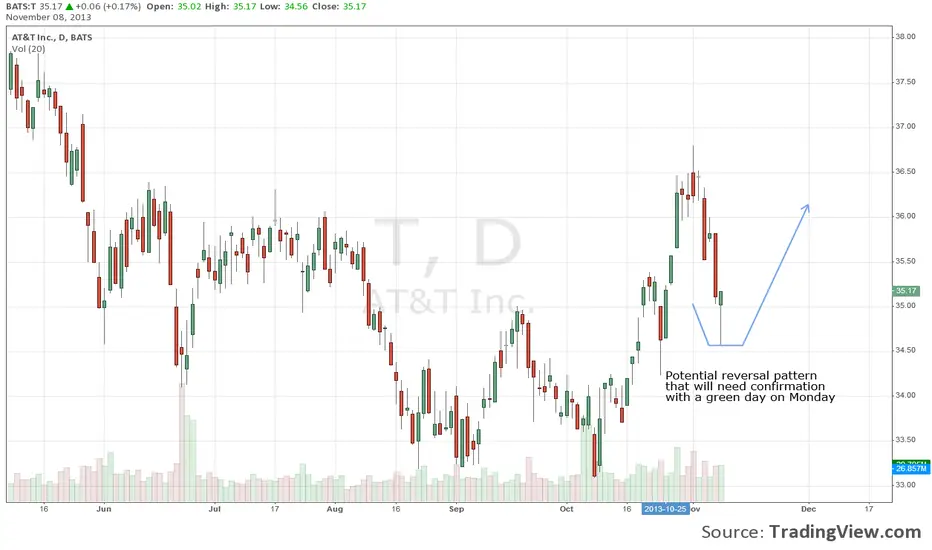
AT&T - Double bottom with divergence and engulfingThere is a saying that appears in a lot of books "Plan your trade and trade your plan". I never did this. I always keep a trade that is on profit until it looks like the trend changed, I never plan my exits. This is the first trade where I'm gonna make a plan and trade it, no matter what happens.
The US market opens in 10 minutes, and I'm gonna watch for the open. A strong gap down cancels the trade. With my risk management rules and my portofolio size, I can buy 100 shares of AT&T. The stop loss will be under the current low. I'm going to close half of the position at take profit 1, and move the stop loss on break even (including the commision costs) on the remaining 50 shares. If we close over the last swing high, that is 33.50$, I will move my stop loss at the last swing low on the hourly chart. If we reach 35$, I'm going to close the entire position.
Technically, we have a class B bullish divergence (the third one) both on the MACD lines and the histogram. Bullish engulfing with strong volume. Also, the support line at 32$ is a very strong weekly support.

AT&T HEAD AND SHOULDERS POSSIBLE ?I am already short at 35.35 and waiting for neckline test. It's intresting that 34.95 was previously tested so it's a nice confluence with possible target based on H&S :)


Monthly view - levels that i see Testing the blue line for possible support but too many times is a concern.
for a overall safe bet, over $39.05 could offer a excellent entry for long term hold

Follow up on the $T Trade. Downward Channel is looking mature. Here is the original $T chart showing the failed breakout.
Looking for a channel breakout to the upside within the next 2 weeks. Conservative Target is 36.05.
www.stocksetups.com

AT&T 5 month downtrend signals a tradeRemember the famous old market indicator that Robert Farrell invented back in his days at Merrill Lynch? It was the GM indicator. It simply said that whatever GM was doing was an indicator for the US economy and market. GM was a leading indicator for many years until GM became a bloated, non-competitive force in the global automobile market.
Now comes AT&T. The stock has a remarkable correlation to the US stock market. It moves up and down very tightly to the movement in the overall market. If the market is going up without AT&T, watch out. If the market is going down and AT&T is holding up, then assume the market will recover.
What we are seeing here is AT&T in a firm downtrend over the past 5 months. This is a sign that something is wrong. At least what we can do is to sell short the market and BUY AT&T and lock in this very wide spread. Then we will look for the market to fall down to catch up to where AT&T has fallen to. IF, on the other hand, AT&T lifts to catch back up to the market, then we can profit. In either situation we profit.
The way to lose is for the market to go on higher and for AT&T to stay down. I view the risk as acceptable.
Buy AT&T 33.90 last and sell short SPY 168.93 last. Risk 5% on the entire position. Target 5%-10% return in 30-60 days. If the market falls by 5% and AT&T holds steady, that is a 5% return. If AT&T rises by 5% and SPY (the market) holds steady, then that is a 5% return. If the market falls by 3% and AT&T rises by 3%, then that is a 6% return.
I'd suggest that each position be the same dollar amount.
The net-net. I shall put this as a "LONG" for AT&T, but it is a "NEUTRAL" POSITION. I could have also put it as a "SHORT" on the market. Either way, I hope we all can make some money on this setup.
Best regards,
Tim 2:05PM EST Friday September 27, 2013

