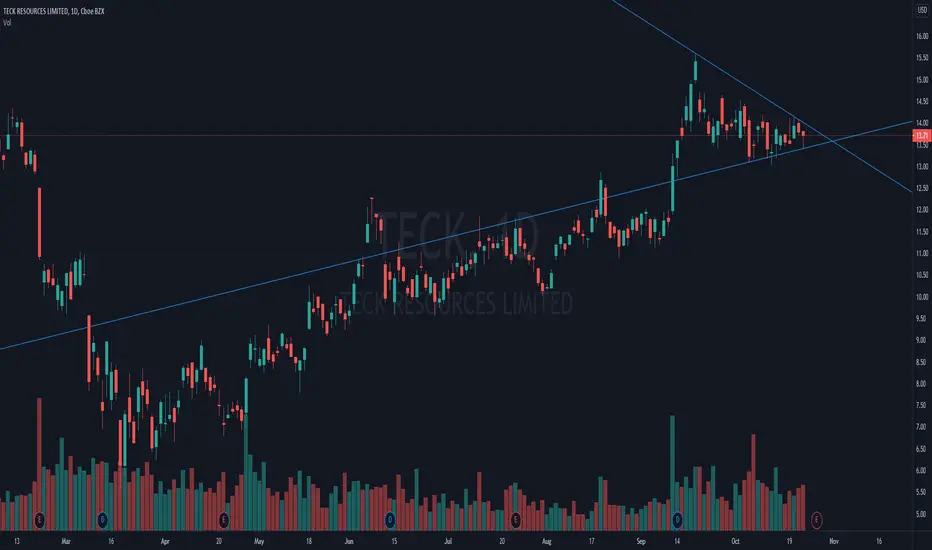
TECK Testing Previous Base Support$TECK pulled back to its previous 5 months base and successfully tested that level last week. Bounced strongly on Thursday and put an inside day on Friday
The same group as $FCX and as you know, i'm already in that one.
This group looking like it wants to go higher
TECK/N trade ideas

No brainerYou dont need brain to buy teck here You dont need brain to buy teck here You dont need brain to buy teck here

TECK swing low ideaBeautiful retest of swing low on a strong uptrend.
Has chance to make new highs or at least retest $30


10/9/21 TECKTeck Resources Ltd (TECK)
Sector: Non-Energy Minerals (Other Metals/Minerals)
Current Price: $26.70
Breakout price trigger: $26.75
Buy Zone (Top/Bottom Range): $25.50-$24.00
Price Target: $30.80-$31.20
Estimated Duration to Target: 110-117d
Contract of Interest: $TECK 1/21/22 30c
Trade price as of publish date: $1.57/cnt

TECK - in downtrending channelDowntrending channel
Bad earnings
Can easily go to the 1st strong support 18.50

TECK about to run?For the people who like to play in metals, TECK is a Mines & Minerals company out of British Columbia. It got dinged earlier in June due to the politics of the infrastructure bill and that it almost fell apart. TECK has slowly recovered to form a nice flag and had an impressive intraday run on Friday, exiting the week with a hammer candle. It has room to move. Maybe worth a look?
First stop is $24, 2nd is $26....
I am not a financial advisor and this is not financial advice.

TECK - TECK RESOURCES LTD FORECASTTECK giving us a half decent buy signal. This thing could sink lower but since the risk is next to nothing its worth a shot here at this price. Stoploss below white line, take profits at the colored lines above.
TECK is a mineral and metal mining, manufacturing business who didn't finish 2020 all too well. Keep in mind this ticker is nearly at the top of a previous rally but given the nature of this stocks business it could keep on climbing.
THIS IS NOT FINANCIAL ADVICE, DO NOT FOLLOW THIS TRADE BLINDLY.

TECK - GREAT Short Opportunity, IF ... !!Hello! Friends,
This would be a great short Opportunity, IF NYSE:TECK breaks down the Daily Support line at $21.36 (with a whole DAILY Candle) !!

Argument for Shorting TECK.It took me 2 hours to review 5 charts with this method of analysis. That is obviously not efficient enough, but I was really pleased with the way my ideas continually flowed into one another until I came up with a "solution". Have I created order out of this chaos? Probably not, but this is what I came up with and I'm really excited to see if it plays out. Normally, I am trying to do all of this in my head, so it felt really good to write it down on the chart for once.
Definitely need to refine this approach. From my perspective it is like if you were training to run a marathon by running for 30 miles. The marathon will never be easy, but compared to 30 miles maybe it will be achievable with regularity.
Realistically, I'm the 400/800 guy, but I prefer my suffering long and drawn out L.O.L.


TECK stock. Application of Fair Value Areas into TradingIn my last post I was simply marking points on a chart. In this post I'm kind of trying to trade it. Yes, I am holding a long position in this stock at the moment, so my bias is to the upside. With that I am taking not of the floor turned ceiling as the biggest point of inflection on the chart. I'd really like to see that get broken and some follow through from the lower EMA's to pull the 200 back to the upside.
Also, any comments on how I'm drawing in the Fair Value Areas, as well as excess price are welcome.
Once again, the FVA's bit comes from the book I'm reading entitled "Price Action Breakdown". Just trying to understand and apply the material within the 1st chapter. I have to say it does not give you enough to make a prediction in the 1st chapter alone. That is probably a good thing.


TECK: third times a charmNYSE:TECK eyeing for a breakout after a decline from 2011. Long after breakout, watch weakly candle for confirmation.

TECK - Cleared for TakeoffTECK breaking out of a decade long decline into an improving Macro backdrop.
- AUS coal unable to reach Chinese mkt
- Base metal demand side ramp into 2022 off fiscal support
- Supportive monetary stimulus backdrop, obviously


TECK ConsolidatingAppears to be consolidating with a hammer forming today. Lot of buying at support level on the smaller time frames. Could potentially break out soon.