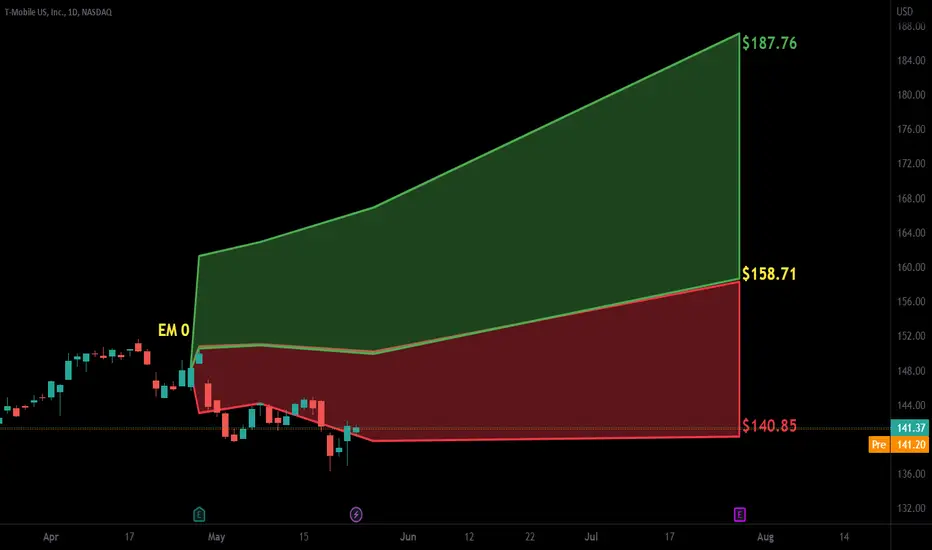
20% ROI potential on TMUST-Mobile US Inc. (TMUS) presently breaking through key resistance.
A weekly settlement above this resistance would place (TMUS) into a buy-signal with potential gains of 5% - 10% over the next 1 - 2 months for short-term traders, and gains of 20% expected over the next 6 - 8 months for long-term investors.
Inversely, failing to close above this resistance level on a weekly basis keeps (TMUS) susceptible to falling back to key support.
TMUS trade ideas

T-MOBILE 1st Bullish Break-out signalT-Mobile US (TMUS) broke today above the Lower Highs trend-line of April, the long-term Resistance and will most likely close the first 1D candle above the 1D MA50 (blue trend-line) since August 16. This is the first bullish break-out signal of this pattern. The second will be if the price breaks above the 1D MA200 (orange trend-line) / 1W MA50 (red trend-line) which are trading on the exact same spot.
If we get a 1D candle close above them, we will buy the first break of Resistance 1 (142.85) and target 150.00, which will be a +14.33% rise from the bottom, same as the July 25 peak.
-------------------------------------------------------------------------------
** Please LIKE 👍, FOLLOW ✅, SHARE 🙌 and COMMENT ✍ if you enjoy this idea! Also share your ideas and charts in the comments section below! **
-------------------------------------------------------------------------------
💸💸💸💸💸💸
👇 👇 👇 👇 👇 👇

$TMUS with a bearish outlook following its earnings #StocksThe PEAD projected a bearish outlook for NASDAQ:TMUS after a negative over reaction following its earnings release placing the stock in drift C .


T-Mobile US: Answer the Call! 📞Slowly but surely, T-Mobile US is answering the call of our dark green target zone between $161.69 and $168.80, heading further upwards. To finally pick up the receiver and complete wave B in dark green, the share should develop a three part upwards movement consisting of waves a, b and c in magenta, which should carry it above the resistance at $154.38. However, there is a 33% chance that T-Mobile US could have already hung up wave alt.B in dark green and thus drop below the support at $124.92.

$TMUS - Death Cross Pattern1. RSI Bearish Divergence in the upper timeframe, at the top of a long term uptrend, concluded 5 months ago.
2. Market showing signs of distribution as illustrated by the erratic price action it has been subject to since the last quarter of 2021.
3. The bias is to look for short opportunities.
4. 2 Weeks ago the yellow trendline breakout, close to the delimited resistance area, gave us the trigger we were looking for.
5. The past week came with a 10 EMA crossunder the 50 EMA, raising further authority and confirmation to the bearish thesis.
6. For the sake of working with a healthy risk to reward ratio, wait for the price to retrace to the EMAs and display a rejection candle against this area.
0. Remember that drawing lines on a chart means nothing if you do not command and deploy thorough risk management principles and rules.
Cheers,
Tenacious Tribe - Backtested, Quantified Trading Strategies

Trash Talk on TelecomsBloomberg reports AMZN in talks with telecoms and the carriers all sell off in response to the news. Reuters reports AMZN says they are not talking to telecoms and now we wait for investors to either buy back their positions or continue selling due to the spike down in prices. Which side are you on? The side I'm on will be selling PUT options next week on TMUS, expecting the inevitable bounce back to the price range it had been in prior to the false report.
At a minimum TMUS gets back to the mid 130s with resistance starting at $140.
Place your bets.

T-MOBILE hit the 1W MA100 after 7 months. Buy. T-Mobile (TMUS) has been trading within a long-term Channel Down pattern and yesterday started rebounding after hitting the 1W MA100 (red trend-line) for the first time since October 13 2022. That fractal is very similar with the current sequence. This is a buy call and with it we are targeting the 1D MA50 (blue trend-line) at 143.50.
Attention is needed as we are about to see the first 1D Death Cross since October 11 2021. As a result we will only turn bullish on T-Mobile again on the long-term if the price breaks above Resistance 1 (152.25).
-------------------------------------------------------------------------------
** Please LIKE 👍, FOLLOW ✅, SHARE 🙌 and COMMENT ✍ if you enjoy this idea! Also share your ideas and charts in the comments section below! **
-------------------------------------------------------------------------------
💸💸💸💸💸💸
👇 👇 👇 👇 👇 👇

$TMUS with a bullish outlook following its earnings #StocksThe PEAD projected a bullish outlook for NASDAQ:TMUS after a positive over reaction following its earnings release placing the stock in drift B with an expected accuracy of 75%.
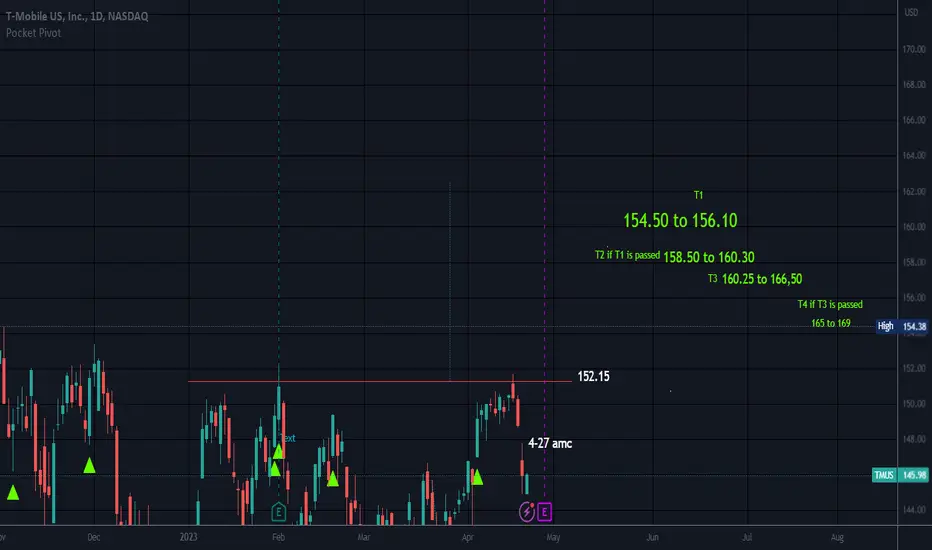
What do we do with this one? $TMUSDecent RR, if stopped out, re entry at the top of the range, in the trade for the last two months so still patiently waiting for this one.

RectangleEarnings 4-27 AMC
Targets in green are for a break up from the horizontal trading channel and targets in orange for a break to the downside,
No recommendation.
Neutral pattern until broken.
Price is above the .236
52 Week Range
120.90
154.38
Day Range
144.90
146.05
EPS (FWD)
7.15
PE (FWD)
20.40
Div Rate (TTM)
-0
Yield (TTM)
-0
Short Interest
5.48%
Market Cap
$175.86B
tmobileeeeee THIS SHOULD BE GREATHi this tmobile stock is looking decent in the long term sense. maybe a 10-20 Year Outlook, people aint going to give up phones before another asset quote unquote. Lets see where the price ends up.

NASDAQ: TMUS - BREAKOUT - MOMENTUMLast week T-MOBILE stock produced a breakout setup and this week retested entry point. Let’s see if this system I put together works on stocks as well!

Trade Idea: TMUS (T-mobile) TMUS is looking very topping heavy on the larger term time frame.
This would align with our thesis that we believe communication and aspects of the tech market are going to see some capital rotation.
If this weekly topping formation is triggered in this chart we will have a high probability trade setup.
Knowing the trend to trade is key.

TMUS- Possible head and shouldersTMUS (T-Mobile US)- a setting head and shoulders. Entry point is a box. Target for 10% gain.

T-Mobile, trend line, wedge patternT-mobile follows the ascending trend line and has formed a wedge pattern, from which further upward movement is expected after the breakout.

$TMUS with a Bearish outlook following its earnings #Stocks The PEAD projected a Bearish outlook for $TMUS after a Negative Under reaction following its earnings release placing the stock in drift D.

TMUS Earnings WeekOn Wednesday, TMUS reports its quarterly earnings. The last earnings report saw a gap on the surprise earnings, but overall the price did not do much. TMUS's price has remained rangebound between the high and low of the previous earnings week. Looking at the earnings estimate, analysts are predicting an increase in earnings from the prior quarter and the same quarter last year, which could provide the catalyst needed to break out of this range.
TMUS managed to post steady gains over 2022 when the SP500 and the Communications Sector (XLC), the sector in which TMUS is a member, declined. This upward progress shows underlying fundamental strength. The price action leveling off this last quarter could mean a few different things. The response to this earnings report could show it was just price action taking a breath.
Stepping back from the TMUS chart, the SPY marked a significant milestone last week by closing above its resistance line that formed during 2022. We also see that XLC is one of the top-performing sectors YTD.
A surprise on earnings coupled with a break of the previous earnings week high could mark the beginning of a new strong uptrend for TMUS.

TMUS - Potential Swing LongT-Mobile US - Potential Swing Long on clearance of declining trend line.
Has been in a consolidation phase over the last 5 months and is nearing the lower boundary of the gradually upward trending channel.
Potential Price Path on chart.
For more research, including trading ideas, get in touch today.

Tmobile About to Get Wrecked?TMUS has a lot of bullish fundamentals, however, I think I have identified a stage 2 uptrend with stage 3 top. I would appreciate any thoughts! Not financial advice, DYOR.


T Mobile TMUS Swing ShortTMUS onthe one hour chart has shown first a double bottom band touch
ten days ago and then a double top band touch around Thanksgiving.
The squeeze oscillator is shown a narrow volatility range over recent days.
This is setting up for the volatility pop to make for a swing short
with a stop loss above the upper Bollinger Band
5 put option for Friday Dec 2 @ $ 149 the five
options went up 56% today; took one off today then another tomorrow.
if trend continuation is seen.

T-Mobile Channel (Daily)Here's a channel that has been telling the technical story of T-Mobile. At the tops it has been consistently selling-off and at the bottoms, it gets bought up. Personally, I look to sell the pink zone or slight above and buy the green zone. If it breaks out of green however, I would liquidate all longs and go short.
Currently, it is pulling back from channel highs and looks to at least fill the gap.
Please check my channel tutorials for more info on how to use them/draw them.
Cheers.
