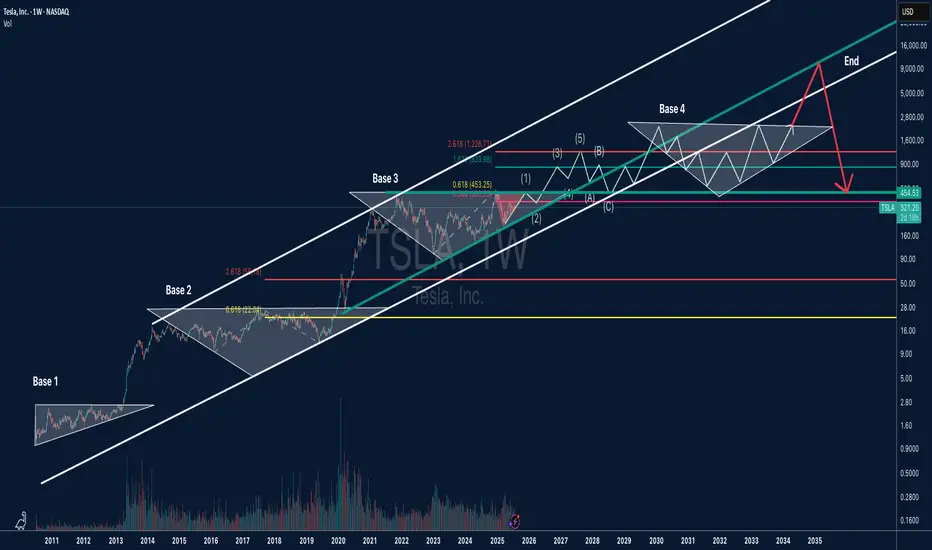
TSLA Long-Term Bold Projection (2025-2035)This is a long-term analysis of Tesla (TSLA) stock on the weekly timeframe, combining Elliott Wave Theory, Fibonacci extensions, and price structure (base formations) within a broad logarithmic trend channel.
Key Highlights:
🔹 Base Formations:
Base 1 (2010–2013): First consolidation before TSLA’s breakout.
Base 2 (2014–2019): A wide triangle structure leading to explosive growth.
Base 3 (2021–2024): Ongoing range suggesting wave (2) correction.
Base 4 (2026–2032): Projected future range before a possible euphoric blow-off phase.
🔹 Elliott Wave Structure:
Current wave count suggests TSLA is finishing wave (2) of a larger 5-wave structure.
Bullish impulse expected with wave (3), (4), and (5) leading to new ATHs, potentially into the $8,000–$10,000+ range.
A corrective ABC phase may follow, bringing price back toward key support (~$450 zone), aligned with Fibonacci retracements and channel support.
🔹 Fibonacci Levels:
0.618 and 2.618 extensions align with historical breakout points and future resistance zones.
Long-term projection targets include $1,226, $4,400, and potentially $8,000+, with eventual reversion to the mean.
🔹 Log Channel:
Price has respected a long-term ascending channel.
Midline and upper resistance bands guide potential future resistance zones.
TSLA trade ideas
TSLA: Watching for short. I think there might be sell off, looking at the chart. I could be wrong so ll observe for now. I will go in if the momentum towards downward accelerate.
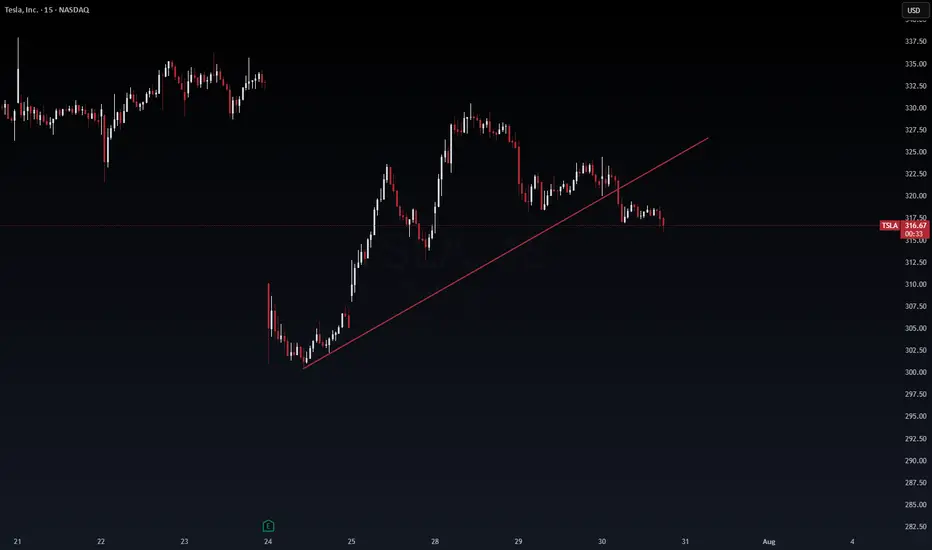
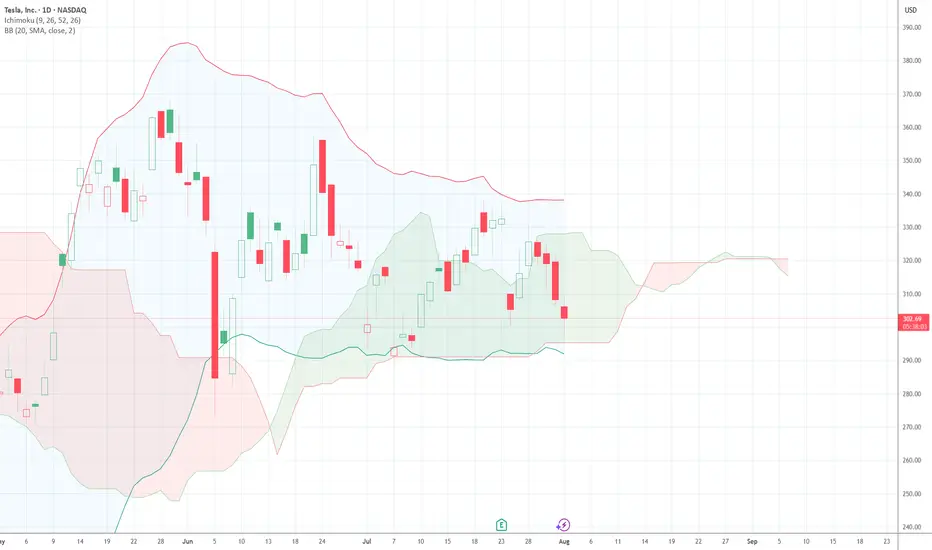
Inflection point"Tesla is at a binary point on the chart. The stock is wedged tightly between the red, downward-sloping resistance line (upper boundary) and the green, upward-sloping support line (lower boundary)—the classic apex of an asymmetrical triangle.
At this stage:
A breakout above the red resistance would be a clear bullish signal, potentially starting a new upward trend.
A rejection at resistance and breakdown below the green support would signal bearish momentum, with likely downside toward lower Fibonacci levels like 272.77 or 213.97.
With price at this inflection zone, the next decisive move—either up or down—will likely define Tesla’s short-to-medium-term trend. This is a textbook example of a binary technical situation: whichever direction is confirmed next, that’s likely to dictate the coming weeks' price action." (Some help from Perplexity)
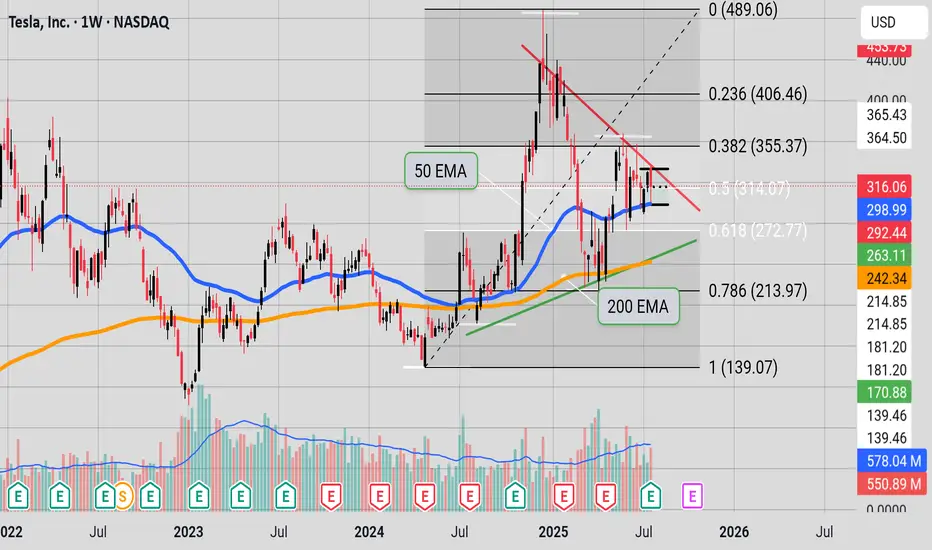
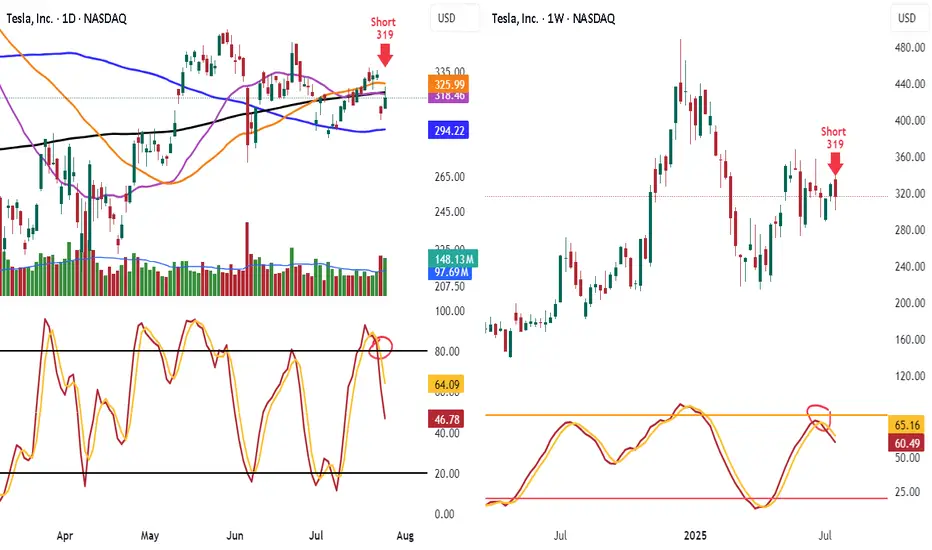
Shorted TSLA 319 Look at TSLA hit 50 day and 200 day MA and failed and know under them
Look at the lower highs and see the stoch heading down
Know lets look weekly stoch heading down and lower highs
Target is 100 day ma 294.22 take some off. When it breaks will add back on
Have trailing stop in place
Tesla Stock in Bearish Trend - Further Downside ExpectedTesla Stock in Bearish Trend - Further Downside Expected
Tesla's (TSLA) stock price continues to display a clear bearish trend structure, characterized by the formation of consistent lower lows and lower highs on the price chart. This technical pattern suggests sustained selling pressure and indicates the downtrend will likely persist in upcoming trading sessions.
Key Technical Observations:
- Established Downtrend: The consecutive lower highs and lows confirm the bearish price structure remains intact
- Weak Momentum: Each rally attempt has failed to gain traction, meeting selling pressure at progressively lower levels
- Critical Price Levels: The stock has established well-defined resistance and support zones for traders to monitor
Price Projections:
- Downside Target at $272: The bearish momentum could drive TSLA toward the $272 support level, representing a potential 15% decline from current levels
- Key Resistance at $370: Any recovery attempts will likely face strong selling pressure near the $370 level, which now serves as a major resistance barrier
Market Implications:
1. Bearish Continuation Expected: The prevailing trend structure favors further downside unless a significant reversal pattern emerges
2. Breakdown Risk: A decisive move below current support levels could accelerate selling momentum toward $272
3. Short-Term Rally Potential: While the overall trend remains down, temporary rebounds toward $370 may present selling opportunities
Trading Considerations:
- Short Positions: Consider maintaining bearish exposure while price remains below the $370 resistance level
- Stop Loss: A sustained break above $370 would invalidate the immediate bearish outlook
- Profit Targets: $272 serves as the primary downside objective, with potential support levels to watch along the way
Risk Factors to Monitor:
- Market sentiment shifts in the EV sector
- Changes in Tesla's production/delivery outlook
- Broader market conditions affecting tech/growth stocks
The technical setup suggests Tesla shares remain vulnerable to further declines, with $272 emerging as the next significant downside target. Traders should watch for either confirmation of the bearish continuation or potential reversal signals near key support levels. As always, proper risk management remains essential when trading in trending markets.

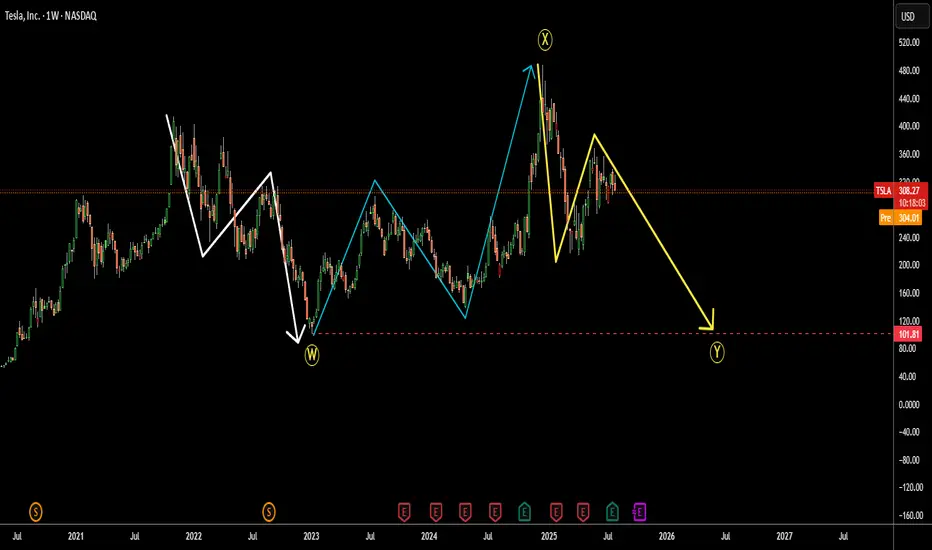
Tesla (TSLA) Crash Ahead? $101.81 Retest in SightThe Tesla price chart appears to show a large flat correction labeled W-X-Y.
Wave W consists of three downward waves from 2021 to 2023. (white)
Wave X shows a three-wave upward retracement from 2023 to 2024, which even overshot the start of wave W. (blue)
Now, we seem to be in the final leg of the third move: wave Y down. (yellow)
Typically, wave Y retests the bottom of wave W.
If that holds, we could see Tesla’s price revisit the 2023 low of $101.81.
Is Tesla losing its appeal?
I’d love to hear your thoughts.
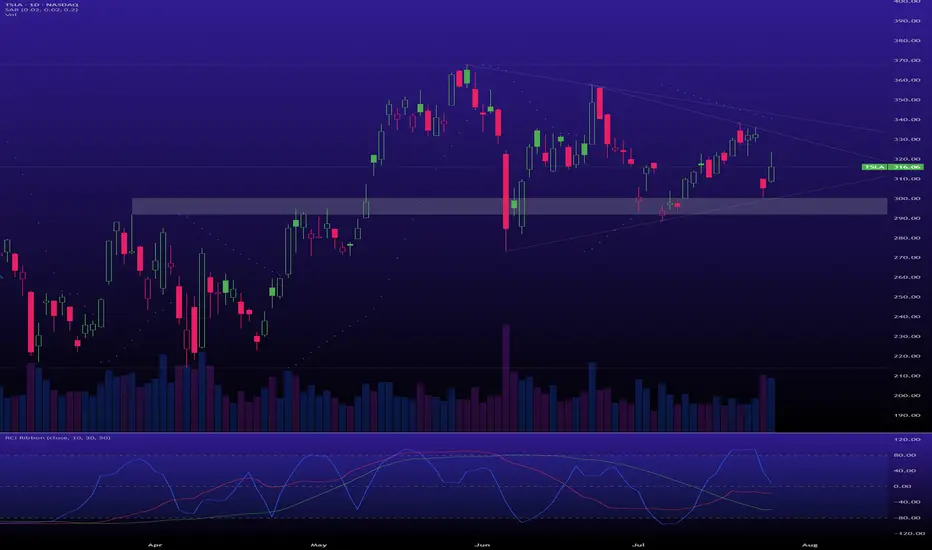
$TSLA is in an accumulation phase.A classic Wyckoff scenario is playing out, offering a prime opportunity if you have the nerve for it.
Support: The key support zone is $300 - $305. As long as this holds, the bullish thesis is intact.
Resistance: The primary target is the top of the multi-month accumulation range, around $370 - $380. A breakout above this would signal the start of a major new markup phase.
$TSLA: Breakout Wave Dimensions🏛️ Research Notes
Apart from known compression patterns for Tesla, there is another squeeze happening on smaller scale:
That area will be processed to derive the chart-based levels and see how market reacts to them.
Triangle
Breakout Expansion

Tesla - The all time high breakout!🚗Tesla ( NASDAQ:TSLA ) will break out soon:
🔎Analysis summary:
For the past five years Tesla has overall been consolidating between support and resistance. But following the recent bullish break and retest, bulls are slowly taking over control. It is actually quite likely that Tesla will soon break above the previous all time highs.
📝Levels to watch:
$400
🙏🏻#LONGTERMVISION
SwingTraderPhil

TESLA POST EARNING 24 JULY 2025This is Post earning analysis for Tesla . I have clearly explained all the levels. Please trade carefully & try to stick to your plan.
NOTE: FOLLOW THE LEVELS

Make or Break point for TSLAlots of bulls and bears for TSLA. Wedging for a bit now. Filled the 296 gap and gap above, now its time to see if TSLA wants up or down. RSI MACD stabilized, volume thinned out, so whatever direction it chooses I think will be explosive. Plenty of Call and Put flow on both sides.
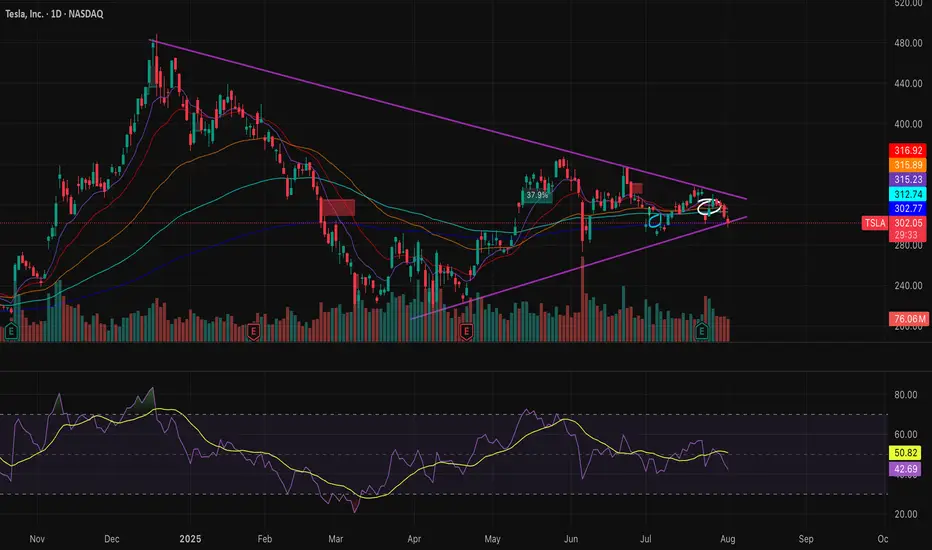
TSLA Breakout Watch: Symmetrical Triangle Squeeze!Trade Summary
Setup: Symmetrical triangle pattern tightening since March; volatility compression signals an imminent breakout.
Entry: On daily close above the triangle resistance (~$324)
Stop‑loss: Below triangle support (~$305)
Targets:
• Target 1: $375
• Long-term: $500+
Risk/Reward: ~2.5–3:1 (Initial target), higher for long-term hold
Technical Rationale
📈 Symmetrical triangle: Clear converging trendlines; price nearing apex after months of higher lows and lower highs
🔔 Volatility squeeze: Range compression increases odds of explosive move
⏳ Daily timeframe: Signals a swing/position trade opportunity with significant upside
Catalysts & Context
⚡️ Earnings season ahead could trigger a breakout
🌱 EV sector momentum and renewed tech leadership
🏦 Analyst upgrades and potential for macro rate cuts
Trade Management Plan
Entry: Wait for a daily close and volume confirmation above $324 resistance
Stop-loss: Tight initial stop below $305; trail to breakeven after breakout confirmation
Scaling: Partial profits at $375; let remainder run for $500+ if momentum continues
Poll
What’s your view? Are you watching TSLA? Comment below or vote:
🔼 Bullish
🔽 Bearish
🔄 Waiting for confirmation
Follow us for daily high-probability setups & real-time trade updates!
Disclaimer: Not financial advice. Trade at your own risk.

$TSLA 3rd Time's a CharmI bottom called NASDAQ:TSLA twice in a row. About to do it a third time today. 312.5C 8/8 @ 4.47 were just bought for $1.3 million.
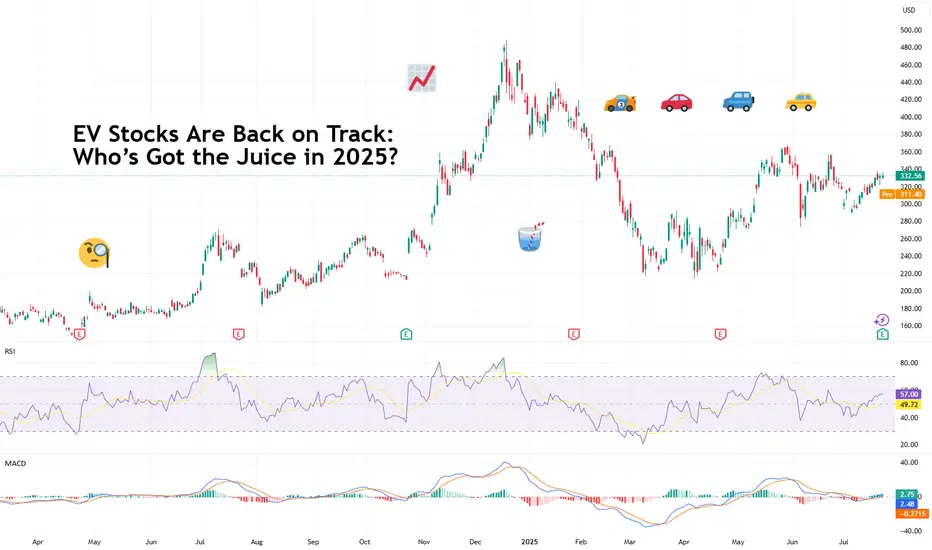
EV Stocks Are Back on Track: Who’s Got the Juice in 2025?This year is big for the EV sector so we figured let’s do a piece on it and bring you up to speed on who’s making moves and getting traction — both in the charts and on the road.
What we’ve got here is a lean, mean lineup of real contenders. Let’s go for a ride.
🚗 Tesla: Still King of the Road (for Now)
Tesla NASDAQ:TSLA isn’t just an EV company. It’s a tech firm, an AI shop, a robotaxi rollout machine, and an Elon-flavored media event every quarter. Even so, when it comes to margins, global volume, and name recognition, Tesla is still the benchmark everyone else is chasing.
In 2025, Tesla’s bounceback is fueled not just by EV hype but by its push into autonomous driving and different plays into the AI space.
The stock is down about 13% year-to-date. But investors love a narrative turnaround. Apparently, the earnings update didn't help the situation as shares slipped roughly 5%. Well, there's always another quarter — make sure to keep an eye on the Earnings Calendar .
🐉 BYD: The Dragon in the Fast Lane
BYD 1211 is calmly racking up sales, expanding across continents, and stealing global market share without breaking a sweat. The Chinese behemoth is outselling Tesla globally and doing it with less drama and more charge… literally .
Vertical integration is BYD’s secret weapon — they make their own batteries, chips, and even semiconductors. The West might not be in love with BYD’s designs, but fleet operators and emerging-market governments are. And that’s where the real growth is.
⛰️ Rivian: Built for Trails, Not Earnings (Yet)
Rivian NASDAQ:RIVN still feels like the Patagonia of EV makers — rugged, outdoorsy, aspirational. Its R1T pickup truck has cult status, but the company had to tone down its ambitions and revised its guidance for 2025 deliveries to between 40,000 and 46,000. Early 2025 projections floated around 50,000 .
The good news? Rivian is improving on cost control, production pace, and market fit. The bad news? It’s still burning cash faster than it builds trucks. But for investors betting on a post-rate-cut growth stock rally, Rivian may be the comeback kid to watch. It just needs a few solid quarters.
🛋️ Lucid: Luxury Dreams, Reality Checks
Lucid NASDAQ:LCID , the one that’ll either go under or make it big. The luxury carmaker, worth about $8 billion, came into the EV game promising to out-Tesla Tesla — with longer range, more appeal, and a price tag to match.
But here’s the rub: rich people aren’t lining up for boutique sedans, especially when Mercedes and BMW now offer their own electric gliders with badge power and a dealer network.
Lucid’s challenge in 2025 is existential. The cars are sleek, the tech is strong, but the cash runway is shrinking and demand isn’t scaling like the pitch deck promised.
Unless it nails a strategic partnership (Saudi backing only goes so far), Lucid could end up as a cautionary tale — a beautifully engineered one, but a cautionary tale nonetheless. Thankfully, Uber NYSE:UBER showed up to the rescue ?
💪 NIO : Battling to Stay in the Race
Remember when NIO NYSE:NIO was dubbed the “Tesla of China”? Fast forward, and it’s still swinging — but now the narrative is more about survival than supremacy. NIO's battery-swap stations remain a unique selling point, but delivery volumes and profitability are still trailing.
The company’s leaning into smart-tech partnerships and next-gen vehicle platforms. The stock, meanwhile, needs more than just optimism to get moving again — it’s virtually flat on the year.
✈️ XPeng: Flying Cars, Literally
XPeng’s NYSE:XPEV claim to fame used to be its semi-autonomous driving suite. Now? It's working on literal flying vehicles with its Land Aircraft Carrier. Innovation isn’t the problem — it's execution and scale.
XPeng is beloved by futurists and punished by spreadsheets. It’s still getting government love, but without a clear margin path, the stock might stay grounded.
🏁 Li Auto: The Surprise Front-Runner
Li Auto NASDAQ:LI doesn’t get the headlines, but it’s quietly killing it with its range-extended EVs — hybrids that let you plug in or gas up. A smart move in a country still building out its charging infrastructure.
Li is delivering big numbers, posting improving margins, and seems laser-focused on practicality over hype. Of all the Chinese EV stocks, this one might be the most mature.
🧠 Nvidia: The Brains of the Operation
Okay, not an EV stock per se, but Nvidia NASDAQ:NVDA deserves a spot on any EV watchlist. Its AI chips are running the show inside Tesla’s Full Self-Driving computers, powering sensor fusion in dozens of autonomous pilot programs, and quietly taking over the brains of modern mobility.
As self-driving becomes less sci-fi and more of a supply-chain item, Nvidia's value-add grows with every mile driven by data-hungry EVs.
🔋 ChargePoint & EVgo: Picks and Shovels
If you can’t sell the cars, sell the cables.
EV charging companies were once seen as the “safe bet” on electrification. Now they’re just seen as massively underperforming.
ChargePoint BOATS:CHPT : Still the leader in US charging stations but struggling with profitability and adoption pacing. Stock’s down bad from its peak in 2021 (like, 98% bad).
EVgo NASDAQ:EVGO : Focused on fast-charging and partnerships (hello, GM), but scale and margin pressures remain.
Both stocks are beaten down hard. But with billions in infrastructure funding still flowing, who knows, maybe there’s potential for a second act.
👉 Off to you : are you plugged into any of these EV plays? Share your EV investment picks in the comments!
TSLA Breaks Bull Structure - Gamma Trap or Breakdown? Jul 31TSLA Breaks Bull Structure — Gamma Trap or Breakdown? Watch 315/300 Closely!
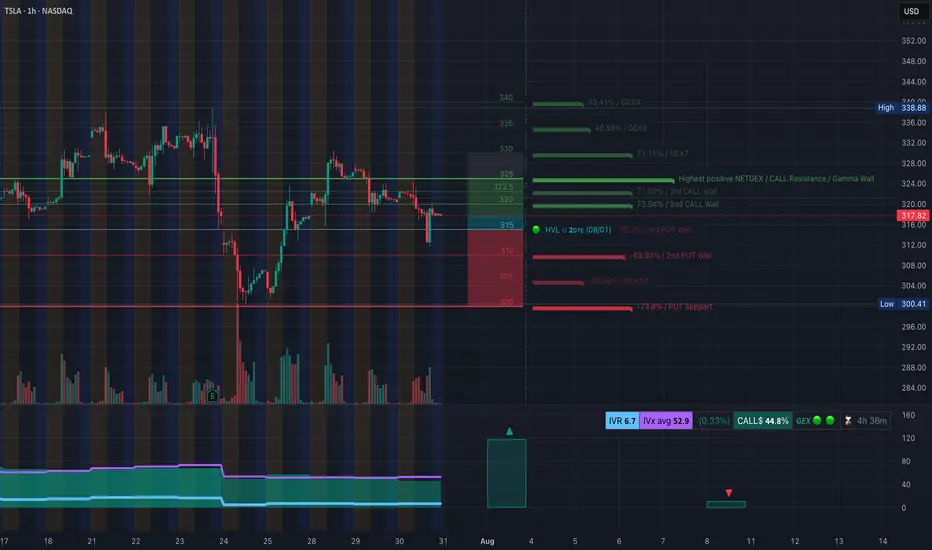
🔍 GEX & Options Flow Insight (1st Image Analysis)
TSLA is trading at $317.82, having just lost support at the 2nd Call Wall ($322.5) and now hovering near key PUT Wall clusters. Options positioning reveals strong downside pressure unless bulls reclaim 321+.
* Call Walls / Resistance:
* 📍 $322.5 → 2nd Call Wall (73.94%) — recently rejected
* 📍 $324.5–328 → Heavy net GEX zones and dealer resistance
* 📍 $336–338 → 3rd Call Wall + GEX9 — parabolic ceiling
* Put Walls / Gamma Risk Zone:
* 🔻 $316.0 / $312.0 → GEX transition zone (dealer flip risk)
* 🔻 $305.0 / $300.4 → Major PUT Support (73.87%) and HVL demand
* Extreme risk below $300 → Gamma cascade toward $290
* Volatility Insight:
* IVR 6.7, IVx Avg 52.9 → Low relative IV = cheap options
* Call Bias: 44.8% → Dealers still net short calls, but flows are softening
✅ Option Trading Suggestion:
Bias: Leaning bearish below 321.2, bearish confirmation under 315
Strategy: Bearish vertical or put debit spread
* Entry Idea: Buy 315P / Sell 305P for Aug 2 or Aug 9 expiry
* Aggressive alt: Naked 310P or 305P if breakdown confirmed
* Invalidation: Reclaim 321.20 with volume = close or reverse
Why this works: Dealer gamma exposure has flipped to negative under 316. If TSLA fails to hold above 315, dealers must hedge by selling into weakness, potentially accelerating downside toward 300.4–305.
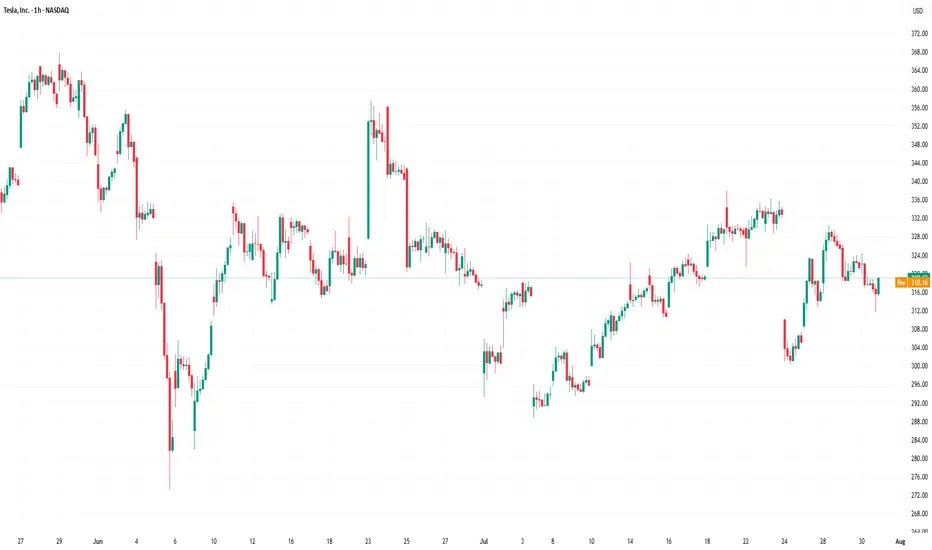
🧠 Technical Analysis (1H Chart) (2nd Image Analysis)
Market Structure & SMC:
* 🟥 Recent CHoCH confirmed on July 30 — bearish shift
* ❌ Failed to hold BOS structure from July 29 → trendline break
* ⚠️ Currently retesting broken structure as resistance (321.20–324.50)
Trendline Dynamics:
* 📉 Break below upward sloping trendline confirmed → downside pressure
* New bearish structure forming lower highs under OB zone
SMC Zones & Reversal Blocks:
* 🔴 Supply Zone (Purple Box): 321.2–324.5 → Rejected twice, now acting as resistance
* 🟩 Demand Zone (Green Box): 312–315.25 → Minor bounce zone; if fails, opens flush to 305–300
🔄 Price Action & Key Levels
* Support Levels:
* 🔻 315.25 → 312.00 → Minor demand + retest zone
* ⚠️ 300.41 → PUT Support + HVL zone (gamma wall)
* 🚨 Below 300 = fast move to 290
* Resistance Levels:
* 🚫 321.20 → 324.50 → Supply zone (order block + 2nd Call Wall)
* 🧱 330.48 → 336 → Next upside wall if bulls reclaim trend
🧭 Scalping / Intraday Trade Setup
🟥 Bearish Scenario (Preferred for Now):
* Entry: 316.00–317.00 rejection
* Target 1: 312.00
* Target 2: 305.00
* Stop: 321.50 reclaim
🟩 Bullish Reversal Scenario (Low Probability):
* Entry: Only on breakout and close above 324.50
* Target: 330.00 → 336.00
* Stop: 321 intraday flip back down
🔁 Summary Thoughts
* TSLA broke bullish market structure with a clean CHoCH and is now trading under OB resistance.
* Gamma positioning supports further downside if price stays under 321.
* Strong Put Walls at 305–300 create a natural magnet if breakdown continues.
* Option premiums are relatively cheap — attractive for directional plays.
* Scalpers and swing traders can ride the downside with tight stops; bulls must wait for reclaim above 324.
🚨 Disclaimer:
This analysis is for educational purposes only and does not constitute financial advice. Always do your own research and manage your risk accordingly.
TSLA LONGQuite a simple set up. Confirmation is still needed on 3d, and daily. Bullish candles and volume is desperately needed for validation of symmetrical setup.
Volatility incoming. Break of ATH with strength leads to price discovery into $500+.

TSLA Honey Ticking Bull Trap! UPDATE 1This is an updated chart, as I keep being prompted to reach "My Target" by TV.
No matter how bad things get for Elona and TSLA, there are always people who are willing to pile in and buy at any price. The problem is the chart is showing lower highs, as TSLA no longer attracts the people needed to boost price, just like TSLA the brand. As a result, people keep getting honey ticked.
Don't Get HONEY TICKED!
As I always say, never EVER!! Invest in toxic people like Elona. They always blow themselves up in the end. It's in their nature!
Click Boost, Follow, subscribe, and let's reach 5,000 followers. ;)

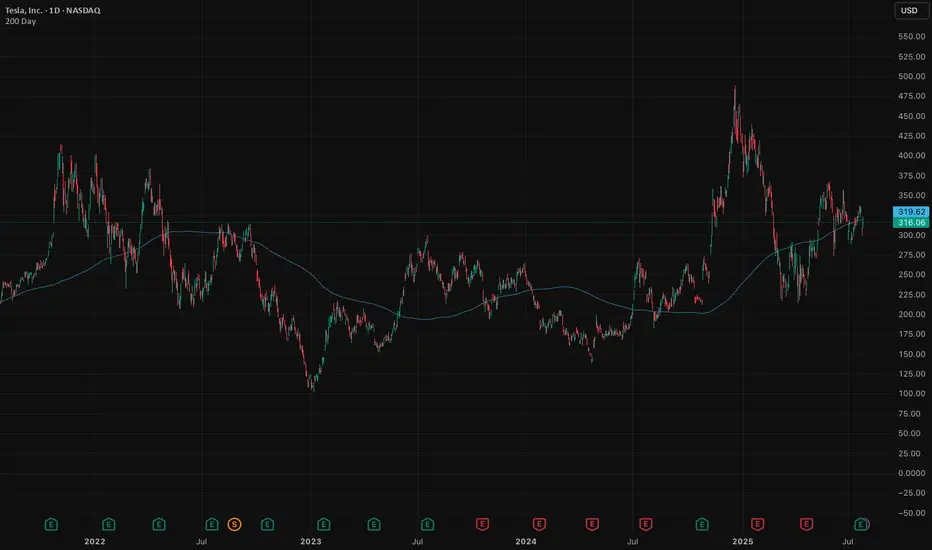
Tesla in the waiting room as revenue slidesTesla is a global innovator that is changing the world. As a general rule, many investors have a saying: Never bet against Elon. They're not wrong. Elon delivers. But the short term is messy.
The stock is hovering around its 200-day moving average, a critical test. Break lower and we could see $290, maybe $260. That’s not panic, it's just price catching up to reality.
The auto business is deep in a downcycle. Q2 deliveries fell 14%, with revenue down 12%. Profits squeezed. Classic cyclical move. Nothing new here. But it’s weighing on momentum.
The upside isn’t about cars, it's autonomy, robotaxis, AI (Grok in cars). That’s where Tesla becomes a $2 trillion company. Musk knows it and is building for the future (100,000 GPU super cluster). He’s already shifting the story.
But that future is 6–12 months out, maybe longer.
In the meantime, we sit in the waiting room. Auto volumes need to stabilise. Robotaxi needs scale. Optimus requires proof and some definitive timeframes to get the market excited. That creates a 3–6 month narrative gap. Markets hate gaps.
Earnings last week were among the softest (though expected). EPS fell 23%. Free cash flow almost vanished. No real catalysts until next quarter. If the broader market sells off, which looks likely, Tesla takes more heat.
But let’s not lose the plot. Tesla is still Tesla. Long-term vision remains. Musk’s execution record is unmatched. Bet against him and you lose, eventually.
Short term, expect weakness. Patience required. If the stock breaks $315 with conviction, we’d expect further weakness before the real upside re-emerges.
Wait, watch, then pounce.
The forecasts provided herein are intended for informational purposes only and should not be construed as guarantees of future performance. This is an example only to enhance a consumer's understanding of the strategy being described above and is not to be taken as Blueberry Markets providing personal advice.
Fibonacci Arcs in Stock TradingFibonacci Arcs in Stock Trading
Fibonacci arcs, derived from the renowned Fibonacci sequence, offer a compelling blend of technical analysis and market psychology for traders. By mapping potential support and resistance areas through arcs drawn on stock charts, these tools provide insights into future price movements. This article delves into the practical applications of Fibonacci arcs in trading, their interplay with market psychology, and best practices for effective use.
Understanding Fibonacci Arcs
The Fibonacci arc indicator is a unique tool in technical analysis derived from the famed Fibonacci sequence. It’s crafted by drawing arcs at the key Fibonacci retracement levels - 38.2%, 50%, and 61.8% - from a high to a low point on a stock chart. Each curve represents potential support or resistance areas, offering insights into the stock’s future movements.
The art of arc reading, meaning interpreting these curves, is crucial for traders. When a stock approaches or intersects with an arc, it reflects a significant reaction level. For instance, if a stock price touches or nears an arc, it could face arc resistance, indicating a potential halt or reversal in its trend.
Applying Fibonacci Arcs in Trading
In the stock market, these arcs serve as a guide for traders seeking to anticipate future price movements. When applied correctly, they can provide critical insights into potential support and resistance levels. Here's a step-by-step look at how you may use them effectively:
- Identifying High and Low Points: Begin by selecting a significant high and low point on the stock's chart. In an uptrend, it’s the most recent swing high to a previous swing low, and vice versa. These are the anchor points.
- Drawing the Arcs: Once the points are selected, draw the arcs at the Fibonacci retracement levels of 38.2%, 50%, and 61.8%. They radiate from the chosen low point to the high point (or vice versa), cutting across the chart.
- Interpretation: Watch how the stock interacts with these lines. When the price approaches an arc, it might encounter resistance or support, signalling a potential change in trend or continuation.
- Timing Entries and Exits: Traders can use the arcs in the stock market as a tool to time their trading decisions. For instance, a bounce could be a signal to enter a trade, whereas the price breaking through might suggest it's time to exit.
Fibonacci Arcs and Market Psychology
The effectiveness of Fibonacci arcs in trading is deeply intertwined with market psychology. They tap into the collective mindset of traders, who often react predictably to certain price levels. The Fibonacci sequence, underlying this tool, is not just a mathematical concept but also a representation of natural patterns and human behaviour.
When a stock nears a curve, traders anticipate a reaction, often leading to a self-fulfilling prophecy. If many traders make an arc stock forecast, they might sell as the price approaches a certain point, causing the anticipated resistance to materialise. Similarly, seeing support at an arc can trigger buying, reinforcing the tool’s power.
This psychological aspect makes Fibonacci arcs more than just technical tools. They are reflections of the collective expectations and actions of market participants, turning abstract mathematical concepts into practical indicators of market sentiment and potential movements.
Best Practices
Incorporating Fibonacci arcs into trading strategies involves nuanced techniques for better accuracy and efficacy. Here are some best practices typically followed:
- Complementary Tools: Traders often pair this tool with other indicators like moving averages or RSI for a more robust analysis.
- Accurate Highs and Lows: It's best to carefully select the significant high and low points, as the effectiveness of the curves largely depends on these choices.
- Context Consideration: Understanding the broader market context is crucial. Traders usually use Fibonacci arcs in conjunction with fundamental factors to validate their analysis.
- Watch for Confluence: Identifying areas where Fibonacci levels converge with other technical signals can provide stronger trade setups.
- Practice Patience: Traders typically avoid making hasty decisions based solely on Fibonacci levels. It's usually better to wait to see additional confirmation from the price action.
Advantages and Limitations of Fibonacci Arcs
Fibonacci arcs are a popular tool in technical analysis, offering distinct advantages and some limitations in analysing stock movements. Understanding these can help traders leverage the tool more effectively.
Advantages
- Intuitive Nature: The Fibonacci sequence is a natural pattern, making the tool intuitive for traders to understand and apply.
- Dynamic Support and Resistance Levels: They provide dynamic levels of support and resistance, unlike static lines, adapting to changing market conditions.
- Versatility: Effective in various market conditions, the arcs can be used in both trending and sideways markets.
Limitations
- Subjectivity in Selection: The effectiveness largely depends on correctly identifying the significant high and low points, which can be subjective.
- Potential False Signals: Like all technical tools, they can generate false signals, especially in highly volatile markets.
- Requires Complementary Analysis: To maximise effectiveness, these curves are usually used alongside other technical indicators, as they are not infallible on their own.
The Bottom Line
Fibonacci arcs are invaluable tools in stock analysis, providing insights into market trends and potential price movements.
This article represents the opinion of the Companies operating under the FXOpen brand only. It is not to be construed as an offer, solicitation, or recommendation with respect to products and services provided by the Companies operating under the FXOpen brand, nor is it to be considered financial advice.
TSLA at the Edge of Reversal or Rally? Key Setup Ahead. Jul 28🔍 Technical Analysis (1H + 15M Confluence)
* Market Structure:
After a steep drop from $334, TSLA has shown a recovery off the $300.41 low. The 1H chart shows a bounce forming higher lows, with price now consolidating around $317–$318.
* SMC Insight (15M):
The bullish BOS and CHoCH signal a structural shift. Price has respected the ascending channel and reacted from the Fair Value Gap (FVG) inside a purple supply zone near $323–$325, indicating short-term resistance.
* Volume Analysis:
Volume increased on the bullish move off $302.5 demand zone, indicating possible accumulation, but stalled near resistance.
🔐 Key Supply & Demand Levels:
* Demand Zones (Support):
* $302.5 (1H GEX HVL zone + volume demand)
* $300.41 (last low & liquidity pocket)
* Supply Zones (Resistance):
* $323.62–$325 (15M supply + GEX resistance zone)
* $334–$338 (GEX7/High wall)
📈 Options Sentiment – GEX & Flow
* Gamma Walls (Resistance):
* $317–$323: Heavy CALL walls, especially at $320 (Gamma Wall)
* $335–$338: Strong GEX7 / GEX9 resistance — potential magnet only if TSLA breaks 325 cleanly
* PUT Walls (Support):
* $302.5: HVL + PUT support
* $295 & $290: Lower extreme GEX support (panic defense zones)
* Options Oscillator:
* IVR: 7.1 (very low — cheap premiums)
* IVx avg: 51.7 (slightly elevated fear)
* Call Bias: 68.8% bullish
* GEX Sentiment: ✅✅✅ bullish until $325, then neutral-to-risky
🎯 Trade Setups
✅ Bullish Setup (if price holds above $316–317):
* Entry: 317.50–318.00 (current consolidation)
* Target 1: 323.50 (supply)
* Target 2: 334.00 (GEX9 magnet)
* Stop-loss: 312.70 (SMC breaker structure + 15M CHoCH invalidation)
Scalp Target: 323
Swing Target: 334
Add Calls (weekly): Only above 320 breakout with volume.
❌ Bearish Setup (if price loses 312.70):
* Entry: < 312.50 breakdown
* Target 1: 305.30 (mid-demand)
* Target 2: 302.50 (HVL & GEX PUT support)
* Stop-loss: 316.10 (back inside channel, bullish flip invalid)
Scalp Target: 305
Swing Target: 302.5
Add Puts: Only below 312.5 with confirmation candle.
⚖️ Bias & Scenario Outlook:
* Neutral-to-Bullish Bias: As long as price holds above 316 and respects the ascending trendline.
* Risk Zone: 323–325 = possible reversal zone (heavy GEX wall + supply)
* Gamma Flip Above: 325 opens up 334–338.
📌 Conclusion:
TSLA is compressing between supply and demand. Monday’s price action around 317–320 will be key. A break above 320 could fuel a GEX chase to 334, while rejection may trigger a pullback toward 305–302. Stay nimble and let price confirm direction around key GEX walls and SMC structure.
⚠️ Disclaimer:
This analysis is for educational purposes only and does not constitute financial advice. Always do your own research and manage your risk before trading.

WXY structure with a double topTesla has been in a uptrend with a corrective structure WXY. I am not sure if the WXY is a part of wave 5 terminal structure or a B wave. However expecting a double top or 78.6 retrace to 425-430 range as a minimum. For this scenario, an impulsive upside move is expected within the next few weeks. However the price needs to move back into the channel next week as a first step.

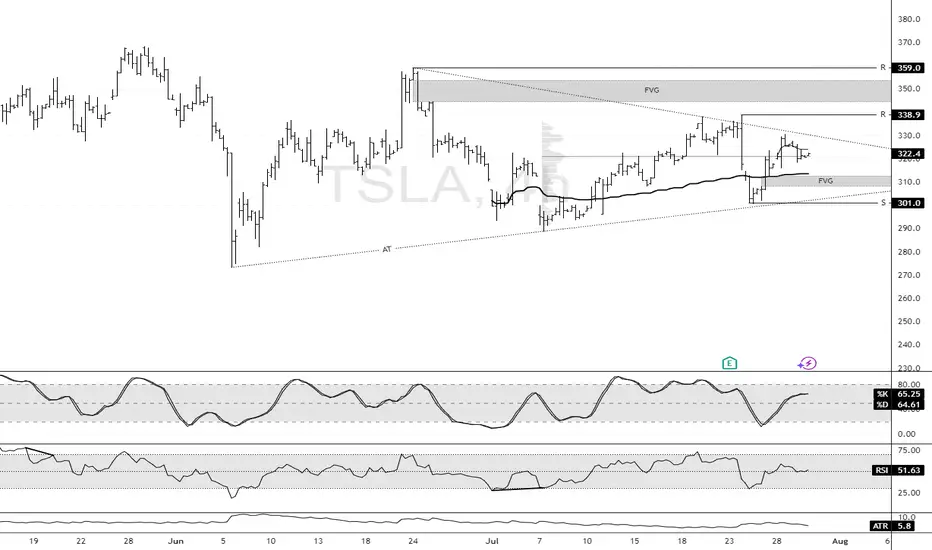
Tesla Builds Toward Fair Value GapFenzoFx—Tesla (#TSLA) bounced from the ascending trendline and closed yesterday's session at the volume point of interest, the $322.3 mark. This level is above the monthly VWAP, meaning bulls are gaining, and bears are losing money.
That said, we expect the uptick in momentum to resume, targeting $338.9, and if this level is breached, the stock will likely aim to fill the Fair Value Gap at $350.0.
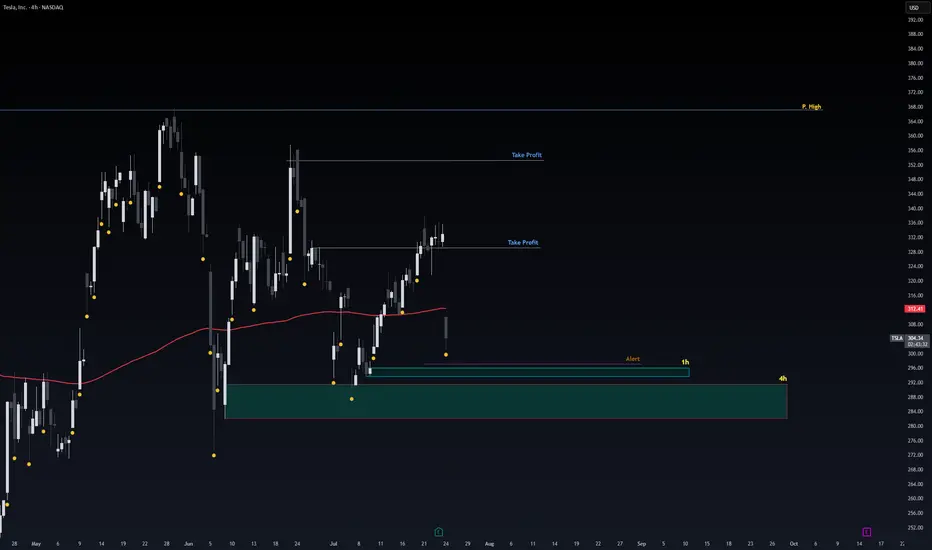
Safe Entry Tesla1h & 4h Green Zones are safest entry Zones.
Stop loss Below.
Note: 1- Potentional of Strong Buying Zone:
We have two scenarios must happen at The Mentioned Zone:
Scenarios One: strong buying volume with reversal Candle.
Scenarios Two: Fake Break-Out of The Buying Zone.
Both indicate buyers stepping in strongly. NEVER Join in unless one showed up.
2- How to Buy Stock (safe way):
On 1H TF when Marubozu/Doji Candle show up which indicate strong buyers stepping-in.
Buy on 0.5 Fibo Level of the Marubozu/Doji Candle, because price will always and always re-test the