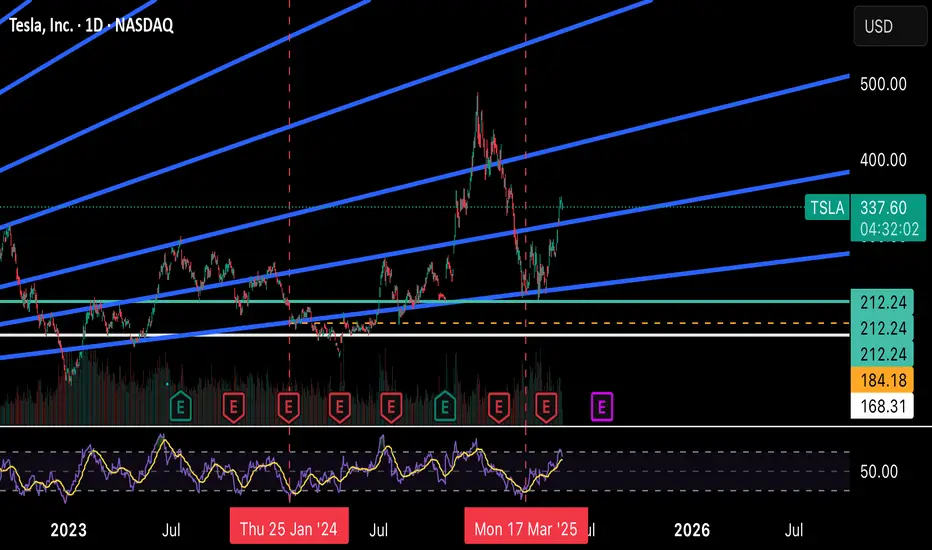
Tesla - Don't get confused right here!Tesla - NASDAQ:TSLA - is about to create the bullish reversal:
(click chart above to see the in depth analysis👆🏻)
2025 has been a rough year for Tesla so far. With a drop of about -50%, Tesla is clearly breaking the average retail trader. But the underlying trend is still quite bullish and if position strategy, risk execution and mindset control are all mastered, Tesla is a quite rewarding stock.
Levels to watch: $275, $400
Keep your long term vision!
Philip (BasicTrading)
TSLA trade ideas

the AI YEAREveryone is focused in tesla as a car manufacturer, but will be one of the AI Kings.
Optimus will be huge.
New ATH this year!

TSLA PRICE ACTION 21st MAY 2025This is the updated price action of Tesla. I have clearly discussed the new buying levels & have also discussed why I sold it.
If you have any questions, feel free to leave a comment or DM me.
NOTE: AVOID OPTIONS IN TESLA

$Tsla will continue to go bullish after a short term pullbackNASDAQ:TSLA is in a bullish market overall speaking.
the price will probably continue to go up after this short term pullback!

TSLAAs like my other ideas, I used the reversal ascending/descending trend structure lines at high and lows..which allows for an interesting point or two to arise even if you dont see it through the clutter of chop or whatnot.
Nice group with a little hollow sun which will be interesting to watch.

Could Tesla bounce? Here's how!In this video, we look at the weekly and six hour chart of Tesla to put together a picture of when could we expect our next bounce & we even compare it to Bitcoin

TESLA: Can it worth $4,000 a share buy end of 2026?Tesla is bullish on its 1D technical outlook (RSI = 65.527, MACD = 22.160, ADX = 43.922, being on a bullish wave to recover the ATH. Since the 2019 low the prevailing long term pattern is a Channel Up and the recent Feb-March correction resembles COVID's in March 2020. If that's the case then the stock is on a powerful long term bullish wave that can reach the 4.5 Fibonacci extension before the 5.0 time Fib. This implies that TSLA price per share can be $4,000 by the end of 2026. Do you think that's realistic?
See how our prior idea has worked out:
## If you like our free content follow our profile to get more daily ideas. ##
## Comments and likes are greatly appreciated. ##

LONG @ 345. LONG @ 333. SHORT @ 348. SHORT @ 352. SHORT @ 360. Yesterday 343 was a very important level for TSLA. Today's TSLA is trading in the same area.
IF THE STOCK PRICE FALLS AFTER OPENING -
The most volume done yesterday was at 345. So we expect the stock to rally from the 345 area and go higher (especially because good news is out). If the sellers keep stepping down into the 343 area. We will redact our order and continue to assess. The 343 level can be broken today too. Two things were confirmed in yesterday's move. 1. The sellers are quite strongly present in the 352-355 area. This can motivate the buyers to expect a lower price of 333. It is entirely possible that the buyers step in at 333 and not at 343. So, we need strong confirmation on the 343 level, otherwise we will not enter. We will enter at 333.
IF THE STOCK PRICE RISES AFTER OPENING -
If the stock opens strongly and blows past 348 area. We wait for strong confirmation at 355 - 360 area that the stock is going to fall and then we short. If the stock slows down at 348 area, then we can either take a short at 348 or wait for it try and inch higher where we short the stock at 350-352.

Tesla (TSLA) Shares Rebound on Musk’s CommentsTesla (TSLA) Shares Rebound on Musk’s Comments
According to media reports, speaking via video link at the Qatar Economic Forum, Elon Musk stated that he plans to:
→ remain Tesla’s CEO for another five years;
→ reduce his focus on politics, saying he feels he has already done enough;
→ increase his stake in the company from 12.5% to 25%.
These comments, which came alongside news that Tesla will begin testing robotaxis in Texas in June, sparked renewed interest in Tesla (TSLA) shares. TSLA stock outperformed other MAG7 members, climbing above the $353 mark at yesterday’s peak — its highest level since late February 2025.
Just ten days ago, when the price was still below the psychological $300 level, we highlighted TSLA’s strength following its rebound from the $220 support area and suggested a bullish outlook. But is the picture still as optimistic today?
Technical Analysis of TSLA Chart
The chart shows that TSLA is trading within an ascending channel (highlighted in blue), with the price currently near the upper boundary — an area that often acts as resistance. Price action supports this: note the two large candlesticks with closes near their lows (indicated by arrows), suggesting strong bearish pressure.
This gives reason to believe that sellers may take advantage of the roughly 22% rise in the TSLA stock price to lock in profits — a potentially bearish signal. Traders should therefore consider a correction scenario in which the local support at point Q could be tested for resilience.
This article represents the opinion of the Companies operating under the FXOpen brand only. It is not to be construed as an offer, solicitation, or recommendation with respect to products and services provided by the Companies operating under the FXOpen brand, nor is it to be considered financial advice.

Tesla Faces Resistance, Conclusion: 1,206 New All-Time High?The Tesla stock, TSLA, is facing resistance right now; what to expect?
Expect additional growth but...
Good afternoon my fellow trader, Tesla will continue growing, mark my words.
Volume has been rising now since January 2024, that's a long time. Almost a year and a half with more and more action joining this stock and this is one of the most traded stocks in the whole world. Increasing volume is a very strong bullish signal.
The highest volume session came on the 7-April week and this week closed green. It produced the highest volume since February 2023.
Back in 2023, trading volume started to rise in January and this signaled the start of a long-term bullish trend, higher highs and higher lows. This trend is still valid today.
The bullish bias is confirmed. Let me show you.
» EMAs:
TSLA trades above all moving averages, short-term and long-term. Incl. SMA200 and EMA89/55.
» MACD bullish cross:
This is a very strong signal. Last week the MACD produced a bullish cross and is now coming out of the bearish zone. This is bullish for two reasons, the histogram turns green and there is plenty of room available for additional growth. In a way, this signal shows that the bullish wave is only starting now and that it will continue long-term. This MACD signal doesn't show up unless a bullish wave is coming. You can look back at the weekly MACD and confirms this for yourself. Each time the b-cross is in, this stock grows for months.
» RSI bullish zone (57.63):
To be honest, I don't like how the RSI is looking but we have the classic higher highs and higher lows pattern. The reading is bullish and shows plenty of room available for growth. It could be better though but still, leaning up and supporting more up.
» RENKO (weekly):
Clearly bullish. This confirms TSLA is in an uptrend now and will keep going higher.
» RENKO (daily):
In the daily RENKO chart the bullish bias/signal is even more pronounced, meaning, no room for doubts.
» To end this 'it is obvious Tesla will continue rising technical analysis', let's consider the monthly timeframe:
— We have a perfect rising channel.
— There is a rounded bottom (orange) which is a reversal signal.
— There is a hammer candlestick last month which is also a reversal signal.
— This month is full green which confirms both the hammer and rounded bottom as reversal signals.
All these signals are saying that the bullish trend will continue now.
Last month produced the highest volume since June 2023.
» Tesla (TSLA) is going up.
Namaste.

Watching TSLA With a Strategic Lens – No FOMO, Just FactsTesla (TSLA) has surged over 53% in the past four weeks, largely driven by renewed investor optimism around its developments in artificial intelligence and robotics, along with Elon Musk's confirmed commitment to remain as CEO for the next five years. While the rally has been strong, there are key factors that require attention. Tesla’s sales in China are still down 24% compared to the same period last year, and competition continues to grow—most notably with the release of the Xiaomi YU7 electric SUV. At current levels, Tesla’s valuation is elevated, which increases pressure for the company to deliver strong earnings and growth. Technically, the stock is approaching key support levels around $289 and $271 (close to the 50-day moving average), while potential resistance may emerge near $430 and $489. I personally am not rushing into the trade; I’m watching for a proper technical setup, including a healthy pullback and strong volume confirmation. As always, I rely on my full 20-point entry checklist before taking any position. I trade with discipline, risk control, and full transparency.

Rise Retraced1 1/2 month we have risen only. The last weekly candle has opened a window.
As we have reached a perfect Fibonacci retracement level of 50% it may be not wrong to bet on a downward correction to close the window.


Never bet against Elon?Never betting against the man is a pretty solid strategy. Nevertheless, considering I am long shares I want to take this textbook trade to hedge (again).
This morning on my spike alerts list was $NASDAQ:TSLA. With an opening high of 354.56 which swiftly closed back inside the range a 30m spike was created. The ATR Clearance fits my criteria to consider this a valid spike to play.
Add to this the context of the Daily. NASDAQ:TSLA is riding the 50% of the big move down on the Daily at 351.39. The spike combined with the Resistance makes this a "have to take" trade.
Playing this with July 300P Options.

TSLA: Two SituationsOn TSLA two situations arise. Initially we could have an uptrend if we have a significant break of the resistance line by a large green candle and followed by a large green volume. Secondly, the market can go downward in the event of a strong break of the support line by a large red candle and followed by a large red volume.

Long TSLA @ 343. Yesterday's resistance is today's support.
TSLA has been consolidating in the 333 to 350 zone. Yesterday it opened at 333 but climbed it's way up to the next important level, 343. Today's it crossed 343 and 343 is supporting the price. SPX is near the S-OB, so we expect TSLA to open with some selling pressure. We will use this opportunity to get a good entry. We hold the long till 347. The market may carry a bearish tone given that SPX is attempting close to the Sell Order Block (SOB). Look at the chart below. We can even attempt to take SHORT on TSLA at the 347 level if the SPX gives the right time and opportunity for it.

tesla inc what a beauty in the chart tesla inc can do well a very promising chart, a good upmove can lead to 360+ levels

Elliott Wave Analysis: Tesla (TSLA) Sustains Strong Upward RallyThe current price cycle for Tesla (TSLA), starting from its low on April 22, 2025, is unfolding as a five-wave impulse structure, a common pattern in technical analysis signaling strong directional momentum. As illustrated on the 1-hour chart, the stock has been advancing since this low, with distinct waves forming within the broader structure.
From the April 22 low, the first wave, labeled ((i)), peaked at $294.85, followed by a corrective pullback in wave ((ii)) that found support at $270.78. The stock then surged higher in wave ((iii)), demonstrating robust bullish momentum. Within this wave, the internal structure unfolded as follows: wave (i) reached $290.87, followed by a pullback in wave (ii) to $271. The rally resumed in wave (iii), pushing the price to $323.48, before a minor correction in wave (iv) concluded at $311.50. The final leg, wave (v), culminated at $351.52, completing wave ((iii)) of the broader impulse.
Subsequently, a corrective wave ((iv)) unfolded as a zigzag pattern. From the wave ((iii)) peak, wave (a) declined to $342.33, followed by a wave (b) rally to $350.56. The corrective move concluded with wave (c) at $332.29, marking the end of wave ((iv)).
Looking ahead, as long as the price remains above the key support level of $270.78, any near-term pullbacks are likely to attract buyers in a 3, 7, or 11-swing corrective pattern, setting the stage for further upside in the ongoing impulse structure.

$TSLA on my top watch. Loaded flag?Tesla doing NASDAQ:TSLA things. This moved so sluggish and slow and I guess it was forming and waiting to set something up. If everything else goes smooth tomorrow, I’m looking for a Tesla’s to break out of this bull flag to the upside and retest that 350 range again and hopefully eventually break up to the upside.
I already have calls that I’m swinging but that’s for June 6. Long calls. Wait for your set up. Do your due diligence. Let me know what you think!


Tesla (TSLA) – From EV Giant to Tech & Energy Ecosystem Titan Update Summary:
Tesla NASDAQ:TSLA continues its transformation beyond vehicles, building a vertically integrated platform across mobility, energy, AI, and infrastructure. We maintain a bullish stance above $270.00–$275.00, with an upside target of $470.00–$480.00 based on multi-revenue stream expansion and high-margin software/service potential.
🧩 Key Growth Catalysts:
🔌 Supercharger Network Monetization
Now open to non-Tesla EVs, creating a recurring infrastructure revenue stream
Margins likely higher than vehicle hardware—similar to SaaS economics at scale
Reinforces Tesla’s ecosystem lock-in and increases brand leverage
🤖 Robo-Taxi & FSD Platform
Robo-taxi launch expected in late 2025/2026 could redefine Tesla as a Mobility-as-a-Service (MaaS) provider
Software-like margins from Full Self-Driving (FSD) subscriptions and usage fees
Establishes a powerful network effects moat
🔋 Energy + AI Synergies
Growth in Powerwall, Megapack, and solar deployments
Custom AI chips powering FSD could open new B2B licensing opportunities
AI + energy + hardware = long-term defensibility and scalability
🌍 Macro Support:
Global EV penetration projected to exceed 45% by 2030
U.S. and EU incentive tailwinds + rising fuel costs accelerate EV demand
Rising demand for grid-scale energy storage bolsters Tesla Energy segment
📈 Trade Setup & Price Targets:
✅ Entry Zone: $270.00–$275.00
🎯 Target Range: $470.00–$480.00
⏳ Time Horizon: 6–12 months (event-driven upside with robo-taxi and earnings catalysts)
🧠 Investment Thesis Summary:
Tesla is no longer just an automaker. It’s an ecosystem-first, AI-powered energy and tech company building infrastructure, platforms, and software at scale. The convergence of hardware, energy storage, and autonomy makes TSLA a rare multi-vector growth story with a durable long-term edge.
#Tesla #TSLA #EV #FSD #MobilityAsAService #EnergyStorage #TechEcosystem #BullishBreakout

Tesla reclaimed spider trendsMade a sizable entry last year when daily RSI was bottomed.
Double downed and picked up more around $256.
Price bounced off Spider support trend lines and broke through resistance trend lines.
Elon posted this in march 2025:
x.com
Expecting to see 2,000$ within 3-5yrs.
NFA.
TESLA Under Pressure! SELL!
My dear followers,
This is my opinion on the TESLA next move:
The asset is approaching an important pivot point 349.84
Bias - Bearish
Safe Stop Loss - 369.27
Technical Indicators: Supper Trend generates a clear short signal while Pivot Point HL is currently determining the overall Bearish trend of the market.
Goal - 312.75
About Used Indicators:
For more efficient signals, super-trend is used in combination with other indicators like Pivot Points.
Disclosure: I am part of Trade Nation's Influencer program and receive a monthly fee for using their TradingView charts in my analysis.
———————————
WISH YOU ALL LUCK
