$UBERNot financial advice.
NYSE:UBER
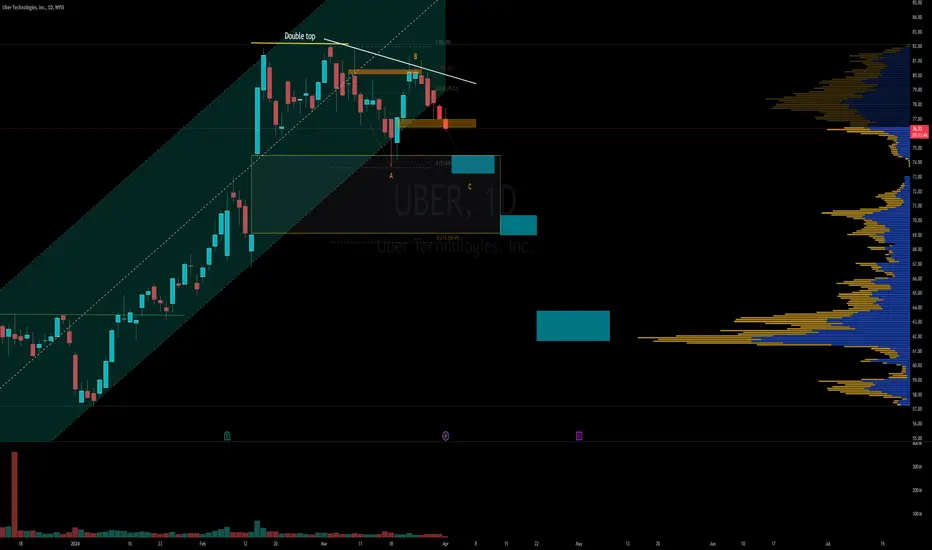
Following is trajectory for wave 4, if so to retest the top of the trendline will see if it holds and continues it's way back to finish wave 5. Also aligns with Fibonacci count.
Like and subscribe for more ideas.
UBER trade ideas

Uber Posts Q1 Results That Beat Expectations for RevenueUber (NYSE: NYSE:UBER ) announced its first-quarter results on Wednesday, which surpassed analysts' revenue estimates but also reported a net loss. The company's revenue increased by 15% to $10.13 billion year over year. However, the gross bookings fell short of expectations, with the company reporting $37.65 billion, compared to the $37.93 billion expected by industry analysts.
The net loss of the company widened to $654 million, compared to a loss of $157 million in the same quarter the previous year. Uber ( NYSE:UBER ) attributed this loss to a $721 million net headwind from unrealized losses related to the reevaluation of its equity investments. The company's adjusted EBITDA was $1.38 billion, up 82% year over year, which is slightly higher than the $1.31 billion anticipated by analysts.
Uber's monthly active platform consumers reached 149 million in Q1, up by 15% YoY from 130 million. During the same period, there were 2.6 billion trips completed on the platform, a 21% YoY increase. The company's mobility segment reported $5.63 billion in revenue, up 30% YoY, and 2% QoQ. The delivery segment reported $3.21 billion in revenue, up 4% YoY and 3% QoQ. The freight business booked $1.28 billion, a decrease of 8% YoY and flat QoQ.
In Q2, Uber expects to report gross bookings between $38.75 billion and $40.25 billion, with adjusted EBITDA of $1.45 billion to $1.53 billion. The company's CEO, Dara Khosrowshahi, said that the loss had "nothing to do with the operating business" and that the company does not expect it to keep happening going forward. Khosrowshahi added that Uber cannot predict the markets.
Despite the loss, Khosrowshahi stated that the demand for Uber remains strong across their platform, supported by their improving marketplace experience, the continued shift of consumer spending from goods to services, and the secular trend towards on-demand transportation and delivery. The company is focused on increasing its penetration of core use cases while expanding into new consumer segments to drive user growth and win more of their daily trips.

UBER Technologies Options Ahead of EarningsIf you haven`t bought UBER before the previous earnings:
Then analyzing the options chain and the chart patterns of UBER Technologies prior to the earnings report this week,
I would consider purchasing the 80usd strike price Calls with
an expiration date of 2025-1-17,
for a premium of approximately $6.85.
If these options prove to be profitable prior to the earnings release, I would sell at least half of them.


The market moves in waves and the next one is coming soon. UBER has a clear cycle of about 6 months.
- The 3 Lines are all down and form a tribble bottom
- The RSI is oversold
UBER can come a bit lower but the reversal is near.

UberWeekly chart.. Major rising wedge forming here.. Price is now correcting back to supporting trendline.. expect a move down to 50-53 before a final leg up to new highs.. Major correction coming 2025.
Short entry for now is below 68.00.. 68 as you can see is major fib and also 100ma is around 69.. wait for a close below 68 and short with your first target 57$ gap close..
70.00 stop loss

👀WATCHLIST: UBER /potential re-entry/UBER is on my watchlist for this week
I am looking for a pivot creation within the orange zone
I have traded UBER in the annotated points in the past
I have left the annotations so that you can see my trading style
A pivot breakout with a good volume would signal a buy for me
I am looking at 'cheat' buy.

UBER - Short to fill the gapsShort Entry - anywhere now
Stop Loss - 80
Target #1 - 74
Target #2 - 69
if broader market tanks for whatever reason, Target #3 - 60 or below
Looking EXTREMELY bullish on UBER!🔉Sound on!🔉
Thank you as always for watching my videos. I hope that you learned something very educational! Please feel free to like, share, and comment on this post. Remember only risk what you are willing to lose. Trading is very risky but it can change your life!

UBER Forming a “Head and Shoulders”UBER is forming a “Head and Shoulder” patter after bouncing from All-Time Highs for a 3rd time, also has a gap to fill to the downside @ $69

1hr bull flag to breakout BIGTIMEMoving up fast, I threw like $3.3k at calls. I like $80 or $90 strike. I also enjoy long expiry. NFA and do your own research. I'm a trader

UBERRetracing back from its all time high. The current zone drawn is there to follow its trend in the next few days/ weeks

Uber starting to stallUbers momentum indicators and price action has started to stall while sideways distribution patterns are printing out. This is since hitting key fib extensions that uber has previously reacted strongly off of. I expect uber to start retracing very soon and start a slow down tread looking to retest $50-$59 price block area.

UBER up and downthis one is kinda iffy so trying to play it both ways for sure. upside first but once it rejects and we break down its gonna drop like a rock

UBER looking for retracementLooking for a small pop then drop down into 72ish. its fighting in this range but its just not gonna make it. Inverting the chart makes it easier to play the down side. just dont forget to undo the inversion like i did lol. retest of the imbalance then onto the box below.

UBER CALLUBER on 30 minute good structure.
Heea and sholders are par big cup.
I think now good time for open option call one weak expiration.

UBER, 2/9-2/14, profit 10%Uber Technologies (UBER) reported earnings of $0.66 per share on revenue of $9.94 billion for the fourth quarter ended December 2023. The consensus earnings estimate was $0.15 per share on revenue of $9.77 billion.

IS UBER ready for continuation LONGUBER fell a little after good earnings. Apparently traders where disappointed. It then rallied
for three days to close out the week. The following week it retraced the rally for 2-3 days
and then consolidated for a week with a re-awakening of bullish momentum in the past prior
trading day. From here, I believe that UBER is ready for potential push to an ATH and gain
buying pressure along that way perhaps accelerated by short sellers liquidating their positions.
I will take a long trade here of both shares and call options.

UBER Triple Top!!!UBER is forming a Triple Top pattern…..signaling overbought on the RSI…..and a gap to fill all the way down to $69…..let’s see how this one plays out!

UBER Flagging on the DailyUBER forming a gorgeous flag after a post earnings run up. Price is coiling nicely and RSI has been hovering near overbought, but holding there signaling impressive strength.

UBER TOP AND BOTTOM 2024UBER has a monthly channel that has to re-test .
If Uber gets inside the channel will look for to middle and bottom part of the channel.

UBER Stock Chart Fibonacci Analysis 021824Chart time frame : C
A) 15 min(1W-3M)
B) 1 hr(3M-6M)
C) 4 hr(6M-1year)
D) 1 day(1-3years)
Stock progress : D
A) Keep rising over 61.80% resistance
B) 61.80% resistance
C) Hit the bottom
D) Hit the top
Stocks rise as they rise from support and fall from resistance. Our goal is to find a low support point and enter. It can be referred to as buying at the pullback point. The pullback point can be found with a Fibonacci extension of 61.80%. This is a step to find entry level. 1) Find a triangle (Fibonacci Speed Fan Line) that connects the high (resistance) and low (support) points of the stock in progress, where it is continuously expressed as a Slingshot, 2) and create a Fibonacci extension level for the first rising wave from the start point of slingshot pattern.
When the current price goes over 61.80% level , that can be a good entry point, especially if the SMA 100 and 200 curves are gathered together at 61.80%, it is a very good entry point.
As a great help, tradingview provide these Fibonacci speed fan lines and extension levels with ease. So if you use the Fibonacci fan line, the extension level, and the SMA 100/200 curve well, you can find an entry point for the stock market. At least you have to enter at this low point to avoid trading failure, and if you are skilled at entering this low point, with fibonacci6180 technique, your reading skill to chart will be greatly improved.
If you want to do day trading, please set the time frame to 5 minutes or 15 minutes, and you will see many of the low point of rising stocks.
If want to prefer long term range trading, you can set the time frame to 1 hr or 1 day.

UBER - FlagLONG
- breaking through resistance
- 1W RSI with positive dynamics
- OSMA is positive
- price above 50/200 EMA
- golden crest 1D TF
- 1D TF marribon is positive and opened
- flag
TP1: 69.71
TP2: 80.22
SL: 57.17
