UnitedHealth Weekly Wyckoff in progressWe can observe a weekly Wyckoff in place for UnitedHealth.
I have Two possible scenario
1) The price took the weekly liquidity (External Liquidity) and can now go Up until reaching "BC" at least
2) The price will go down and take frist the "STB" to make a "SPRING" and then will go UP until the "BC"
On my side I prefer to keep observing as the price can be slide in this kind of structure.
UNH trade ideas

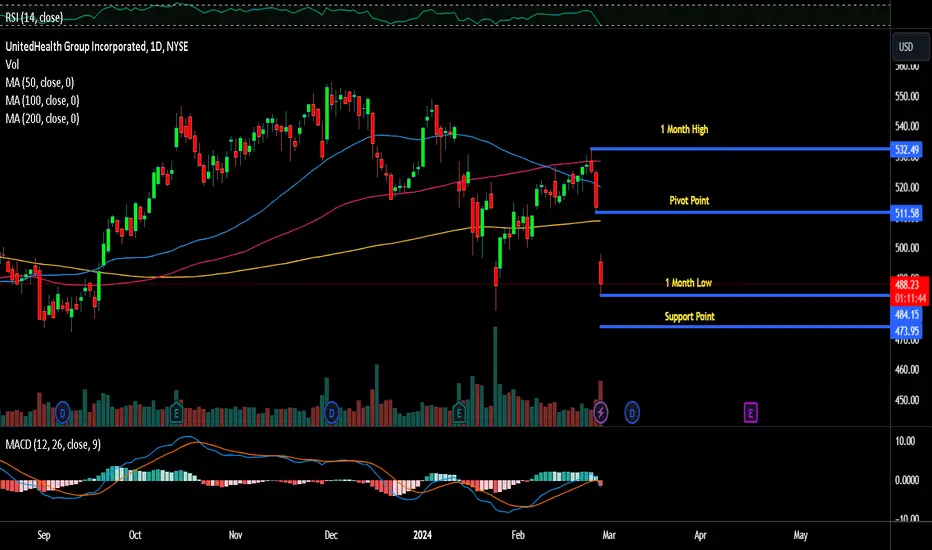
Healthy Returns: Going Long on United Health GroupThis is a trading idea with a medium-term horizon spanning a few weeks. We're observing United Health Group's stock stabilizing at a significant level on the daily chart. Concurrently, there's an emerging hidden bullish divergence in the OBV, albeit unconfirmed. Given UNH's price reaction at the support zone, we're considering a long trade. Our target is the low of the candle from January 11, 2024, which initiated the as yet unfilled gap. We're doing this because in overarching downtrends, prices tend not to fully close gaps but rather turn at the low of the candle before the gap. While we don't perceive United Health Group to be in a predominant downtrend, given the trade's highly favorable risk-reward ratio of 3:1, we're cautious about unnecessary risks.

UNH will recover from selloff on the Change Hlthcare cyberattackUNH has typically performed well in the market. Buying the dip on some just chance unfortunate news regarding the cyber attack that brought Change Healthcare down. I have held positions in UNH for over 15 years. This is a good one to buy and hold. Change my mind.

Own UNHUNH has been getting wrecked recently due to news, but this is still a powerhouse play when it comes to healthcare. I'm going long here.
Not financial advice, good luck to all :)

UnitedHealth: One Last Dip 💦UnitedHealth's share price has fallen sharply in recent weeks. However, it showed a reaction at the support level of $472.12 and has now risen a little. Our expectation is that it is currently working on the magenta wave (Z), the last sub-wave of the green wave (B). As part of this movement, the price should dip below the support level and form a low there. Only then should the price turn around.

UNH Stock tumble after report of antitrust investigationUnitedHealth Group ( NYSE:UNH ) finds itself navigating turbulent waters as it confronts both regulatory scrutiny and cybersecurity disruptions. The recent revelation of a U.S. Department of Justice antitrust investigation has sent shockwaves through the healthcare conglomerate, causing its shares to plummet by about 5%. This investigation, as reported by The Wall Street Journal, casts a shadow over UnitedHealth's ( NYSE:UNH ) acquisitions made through its health services arm, Optum, raising concerns about potential monopolistic practices and their impact on competition within the healthcare industry.
The timing couldn't be more precarious, as UnitedHealth ( NYSE:UNH ) grapples with the fallout from a cybersecurity attack on its Change Healthcare unit, which has led to an eight-day outage. The prolonged disruption has not only rattled investor confidence but has also triggered operational challenges for the conglomerate and its partners, including pharmacy chains like CVS Health.
Analysts are quick to underscore the significance of these developments. Scott Fidel, an analyst at Stephens, aptly describes it as a "tough past week of headlines for UnitedHealth." The market reaction has been swift and severe, with more than $25 billion wiped out from UnitedHealth's market value, exacerbating losses incurred earlier in the week.
The ramifications of the reported antitrust probe extend beyond UnitedHealth ( NYSE:UNH ), casting a shadow of uncertainty over its competitors. Humana and CVS Health, both with aspirations in caregiving akin to UnitedHealth's Optum arm, have witnessed declines in their respective stock prices, signaling investor apprehension about the potential ripple effects of the investigation.
Julie Utterback, an analyst at Morningstar, underscores the interconnectedness of the healthcare landscape, suggesting that the investigation could have implications for CVS and Humana, especially if it expands further.
The specifics of the investigation delve into the intricate relationships between UnitedHealthcare ( NYSE:UNH ) and Optum, probing into potential conflicts of interest and anti-competitive behaviors. Such scrutiny underscores the complexities inherent in the intersection of insurance and healthcare services, where conglomerates like UnitedHealth wield considerable influence.
Meanwhile, Change Healthcare continues to grapple with the aftermath of the cybersecurity incident, with disruptions expected to persist. The impact reverberates across the healthcare ecosystem, affecting not only UnitedHealth but also its partners and clients, including pharmacy chains reliant on its services.
As UnitedHealth ( NYSE:UNH ) navigates these challenges, stakeholders are left pondering the company's resilience and the broader implications for the healthcare industry. Will regulatory scrutiny force a reassessment of consolidation strategies? Can UnitedHealth ( NYSE:UNH ) effectively mitigate cybersecurity risks and restore trust in its operations?
Buy UNH | Profit Target @ $541UNH has been in a long-term uptrend channel for 6-10 years with steady growth. They're currently bouncing off the bottom of the trend channel within 1 ATR of their AVWAP (anchored from the prior high). The 3 ATR profit target at $541 is $14 above current price representing a 3:1 Risk/Reward. The next major resistance is at $558 ($17 above the target). Adding fuel to the fire, a 65-min TTM squeeze just fired! A March 5/35/540/545 call butterly can be had for .54, which would provide a max profit of $446 and max loss of $54. Alternatively, you could sell the 520 PUT for $5.55 (or maybe do both :)

Long-term position in UnitedHealth Group, Inc $UNHThis week, I entered a long-term position in UnitedHealth Group Inc NYSE:UNH
Timeframe: M
SL: ~$475
Target: ~$620

$UNH Measured MoveI think UNH will reclaim and resume the uptrend channel and this is a good RR long for a measured move.

UNH, the dominate health insurance market leader LONGAs shown on the 4H chart, UNH based on a long-term VWAP band setup, it as fiar value for the
first time since September. This dip is significant as price fell from a head and shoulders pattern
of three months duration. The candles in the past couple of days show the reversal at the
mean VWAP support. I have retrieved 60% out of a near term expiration call option. Some may
say this is simply a death cross on a pair of moving averages with a bit of correction on the
overall downtrend. I understand that point of view. Notwithstanding that perspective,
healthcare is expected to be an outperforming sector in 2024. UNH is on sale. As a healthcare
provider, it has paid me large sums in the historical past. I will take trades as described
in the text box on the chart. I believe buying out of the money and at a discount will be
a good strategy for this megacap moving forward.

UNH - where to take a long with the least risk?Joe, Selling the Jan 25 400 put was a great idea. If it returns to the 485 area I will join you on your idea.
I also may use the premium to finance buying a call.

UNH doji signaling a local low?NYSE:UNH dropped after reducing guidance in their earnings release, and then gapped down again today when NYSE:HUM missed estimates. These two stocks frequently respond to one another, creating fantastic trading opportunities if you have both on your watch list.
Todays candle is doji with relatively high volume, which is a decent reversal signal. Prior to today we can see 6 similar dojis during down trends for UNH since January 2022. 5 of them marked the local low. July 2023 was an exception that saw price fall by another 5% over 11 trading days before recovering.

The Top 3 Confirmation Signals for the Double Top Pattern
1 - Bearish Divergence
An indicator such as the RSI showing bearish divergence can confirm the weakening of the bullish trend.
2 - Volume Analysis
An increase in selling volume following the second peak reinforces the potential bearish reversal.
3 - Support Breakdown
A decisive breakdown below the support level confirms the validity of the double top pattern.
Watch this video to learn more
--
**Disclaimer:**
The information provided above is for educational and informational purposes only.
--
It does not constitute financial advice, and trading always involves
--
a risk of substantial losses, regardless of the margin levels
--
used. Before engaging in any trading activities, it is crucial to
--
conduct thorough research, consider your financial situation,
--
and, if necessary, consult with a qualified financial advisor. Past
--
performance is not indicative of future results, and market
--
conditions can change rapidly. Trading decisions should be made
--
based on careful analysis and consideration of individual
--
circumstances. The user is solely responsible for any decisions made
--
and should be aware of the inherent risks associated with trading in
--
financial markets.

UnitedHealth Group ($UNH) Shakes Investors with 4Q Earnings
UnitedHealth Group ( NYSE:UNH ) recently made headlines as it unveiled its fourth-quarter earnings, leaving investors with mixed sentiments. While the numbers beat estimates, concerns over rising medical costs and future pricing strategies have cast a shadow on the stock's performance. This article delves into the intricacies of NYSE:UNH 's financial report, analyzes the factors driving its market movement, and examines the outlook for the healthcare giant in the coming quarters.
Breaking Down the Numbers:
Analysts anticipated fourth-quarter earnings per share (EPS) of $5.98 for UNH, reflecting a 12% YoY increase. Surpassing expectations, UNH reported an impressive 15.4% growth in EPS, reaching $6.16 per share. Revenue also outpaced estimates, rising by 14.1% to $94.4 billion. However, the spotlight fell on the medical cost ratio, which climbed to 85 in Q4, exceeding analysts' projections. This ratio, representing the percentage of premiums spent on members' health needs, raised concerns about the sustainability of UNH's profit margins.
Factors Driving the Numbers:
NYSE:UNH attributed the elevated medical cost ratio to several ongoing factors, including the provision of outpatient care, primarily serving seniors, and the composition of its business mix. The company highlighted that coverage in government programs tended to incur higher costs compared to commercial coverage. Additionally, UNH acknowledged a $100 million unfavorable development in medical reserves during Q4, signaling potential challenges in managing future healthcare costs.
Outlook and Pricing Pressure:
Despite the strong performance, UNH maintained its full-year EPS guidance of $27.50 to $28, suggesting confidence in its ability to navigate challenges. However, analysts expressed concerns over the unexpected rise in the medical cost ratio, emphasizing the potential impact on pricing strategies in 2024. The company recognized a $100 million unfavorable development in medical reserves during Q4, marking the first negative revision since 4Q16. Analysts believe these details indicate heightened pressure on pricing in the coming years.
Stock Market Reaction:
Following the earnings release, UNH stock experienced a 3.65% decline to $520 in early Friday market action. The stock had previously shown signs of resilience by climbing 0.4% on Thursday, surpassing its 50-day and 10-week moving averages. Despite a consolidation period dating back to November 2022, UNH has struggled to gain significant momentum since April 2022. The relative strength line, tracking the stock's performance against the S&P 500 index, has been on a downward trend since November 2022.
Conclusion:
UnitedHealth Group's fourth-quarter earnings report has sparked a nuanced conversation among investors. While the company exceeded EPS and revenue expectations, concerns over the rising medical cost ratio and its impact on future pricing strategies have raised eyebrows. As UNH navigates these challenges, investors will closely monitor how the healthcare giant adapts its business model to maintain profitability in an evolving healthcare landscape.

UnitedHealth Pushes Highs Before EarningsUnitedHealth has consolidated for almost two years, and now some investors may expect its longer-term uptrend to continue.
The first pattern on today’s chart is the basing pattern over the course of 2023. Notice the lower lows in the first half, followed by higher lows in the second half. That may suggest buyers have regained control since the summer.
Second, the 50-day simple moving average (SMA) had a “golden cross” above the 200-day SMA in September. That can also reflect bullishness over the longer term.
Third, UNH recently bounced at its peak from July. Did old resistance become new support?
Fourth, the health insurer has remained below its record weekly close of $551.24. But this week could bring a catalyst for a potential breakout because earnings are due on Friday morning. (Notice how the stock jumped following its last two quarterly reports.)
TradeStation has, for decades, advanced the trading industry, providing access to stocks, options, futures and cryptocurrencies. See our Overview for more.
Important Information
Past performance, whether actual or indicated by historical tests of strategies, is no guarantee of future performance or success. There is a possibility that you may sustain a loss equal to or greater than your entire investment regardless of which asset class you trade (equities, options, futures or cryptocurrencies); therefore, you should not invest or risk money that you cannot afford to lose. Online trading is not suitable for all investors. View the document titled Characteristics and Risks of Standardized Options at www.TradeStation.com . Before trading any asset class, customers must read the relevant risk disclosure statements on www.TradeStation.com . System access and trade placement and execution may be delayed or fail due to market volatility and volume, quote delays, system and software errors, Internet traffic, outages and other factors.
Securities and futures trading is offered to self-directed customers by TradeStation Securities, Inc., a broker-dealer registered with the Securities and Exchange Commission (“SEC”) and a futures commission merchant licensed with the Commodity Futures Trading Commission (“CFTC”). TradeStation Securities is a member of the Financial Industry Regulatory Authority, the National Futures Association (“NFA”), and a number of exchanges. TradeStation Crypto, Inc. offers to self-directed investors and traders cryptocurrency brokerage services under federal and state money services business/money-transmitter and similar registrations and licenses.
TradeStation Securities, Inc., TradeStation Crypto, Inc., and TradeStation Technologies, Inc. are each wholly owned subsidiaries of TradeStation Group, Inc., all operating, and providing products and services, under the TradeStation brand and trademark. TradeStation Crypto, Inc. offers to self-directed investors and traders cryptocurrency brokerage services. It is neither licensed with the SEC or the CFTC nor is it a member of NFA. When applying for, or purchasing, accounts, subscriptions, products and services, it is important that you know which company you will be dealing with. Visit www.TradeStation.com for further important information explaining what this means.

UnitedHealth Group Inc. (UNH) Trading Idea for 28/12/2023Healthcare provider UnitedHealth Group Inc. is diversifying its business. Following the acquisition of the home health services company LHC Group for $5.4 billion earlier this year, the company also has plans to acquire another home healthcare company, Amedisys, for $3.3 billion. These strategic investments will help strengthen UnitedHealth Group's position in the rapidly expanding senior care market.
Therefore, today, we direct our attention to the UnitedHealth Group Inc. (NYSE: UNH) stock chart.
On the D1 timeframe, support has formed at 515.87, with resistance at 549.42. A relatively wide channel has developed within the descending trend. Considering the prevailing investor sentiment amid the US Federal Reserve's softened rhetoric, the trend for this asset may change upward if the quotes solidify above the 528.65 level.
On the H1 timeframe, if there is a rebound from the level of 515.87, the short-term target for the price increase can be set at 528.68, while in the medium term, it could hover around 554.09.
—
Ideas and other content presented on this page should not be considered as guidance for trading or an investment advice. RoboMarkets bears no responsibility for trading results based on trading opinions described in these analytical reviews.
The material presented and the information contained herein is for information purposes only and in no way should be considered as the provision of investment advice for the purposes of Investment Firms Law L. 87(I)/2017 of the Republic of Cyprus or any other form of personal advice or recommendation, which relates to certain types of transactions with certain types of financial instruments.
Risk Warning: CFDs are complex instruments and come with a high risk of losing money rapidly due to leverage. 67.85% of retail investor accounts lose money when trading CFDs with this provider. You should consider whether you understand how CFDs work and whether you can afford to take the high risk of losing your money.

UNITED HEALTH rebound on 1D MA50 leading to 610 long term.UNH held yesterday the 1D MA50 and is on a strong 1D candle rebound today. Despite this, the 1D technical outlook is on healthy bullish numbers (RSI = 64.198, MACD = 4.620, ADX = 38.658) as the underlying pattern is a Channel Up since the July 13th low. The stock's most common rise extension is inside the 15.32-15.96% range, which we've seen three times in the last eight months. Consequently we aim at the +15.32% minimum (TP = 610.00).
## If you like our free content follow our profile to get more daily ideas. ##
## Comments and likes are greatly appreciated. ##

UnitedHealth: Last hurdle 🚧Although UnitedHealth shares were able to establish the low of the turquoise wave 4 and rise steadily, they have not yet made it above the resistance level of $546.78. However, we expect this to happen next, leading to the high of the larger wave (A) in dark green. Short-term, we therefore expect further bullish potential, but after the top of this (A) wave, the trend should be clearly downwards again. In addition, there is a 35% probability for our alternative scenario, in which the alternative top of the old wave (A) would have already been deposited.

UnitedHealth Group (UNH): A Comprehensive Analysis with EstimateOverview of UnitedHealth Group Incorporated (UNH):
UnitedHealth Group Incorporated (UNH), a leading player in the healthcare sector, presents a compelling investment profile. This analysis integrates UNH's financials, operational strengths, market position, and estimated growth projections for the next three years.
Financial and Operational Strengths:
Consistent Growth: UNH has demonstrated steady growth in revenue and net income, underlining its operational efficiency.
Diversified Operations: With segments like UnitedHealthcare, Optum Health, Optum Insight, and Optum Rx, UNH offers a diversified revenue stream.
Strong Cash Flow: The company's robust cash flow from operations indicates solid financial health.
Strategic Investments: Investments in technology and acquisitions suggest potential for future expansion.
Stable Dividends: Regular dividend payouts and increasing EPS reflect a commitment to shareholder value.
Market Position and Trends:
Market Leadership: UNH’s scale and influence in the healthcare sector are significant.
Demographic Trends: An aging population is expected to drive demand for healthcare services.
Technological Advancements: Investment in digital healthcare solutions positions UNH for growth in a changing landscape.
Estimated Growth Projections:
Based on UNH's past performance and market dynamics, the following are the estimated growth percentages for the next three years:
Year 1 Estimated Growth: 8-12%
Year 2 Estimated Growth: 8-12% (cumulative on top of Year 1)
Year 3 Estimated Growth: 8-12% (further cumulative increase)
Investment Consideration:
UNH appears to be a stable investment with potential for steady growth. The company's financial strength, strategic positioning, and industry trends suggest it could be a suitable option for investors seeking stability and incremental growth in the healthcare sector.
Conclusion:
With its robust financial performance, strategic investments, and favorable market trends, UNH is positioned for sustained growth. While exact future performance may vary due to market volatility and external factors, UNH's past performance and current positioning offer a positive outlook.
Disclaimer:
This analysis is not financial advice. Investors should conduct their own research and consider personal financial goals before making investment decisions.


UNITED HEALTH Buy signal to complete the Cup pattern.United Health is on a green (1w) candle despite the general market sell-off.
This is technically due to the longer term pattern which is shaping up to be a Cup/ Arc, that remains to be seen if at the end of it will give a Handle.
Trading Plan:
1. Buy on the current market price.
Targets:
1. 553.00 (bottom of Resistance Zone 1 which was initially formed on April 11th 2022).
Tips:
1. The MACD (1d) is rising with a Bullish Cross last seen in July and despite being bullish over 0.00, it is still underpriced.
Please like, follow and comment!!

Window ClosedOn Friday 13th a window had been opened that has been closed now. The window was an outbreak of the trading range since 6th October. The upside of the range serves as a support now. I expect an upward correction from here therefore. If the overall market will retrace upward we may even see a further rise.
Mind that United Health has behaved better than the market in the latest time.

UNH UnitedHealth Group Incorporated Options Ahead of EarningsIf you haven`t sold UNH`s Double Top here:
or reentered the Double Bottom:
Then analyzing the options chain and the chart patterns of UNH UnitedHealth Group Incorporated prior to the earnings report this week,
I would consider purchasing the 530usd strike price Calls with
an expiration date of 2023-10-13,
for a premium of approximately $6.40.
If these options prove to be profitable prior to the earnings release, I would sell at least half of them.
Looking forward to read your opinion about it.
