URA Big Opportunity URA Back in the buy zone and it will only be there for so long. Get it while you can.
URA trade ideas

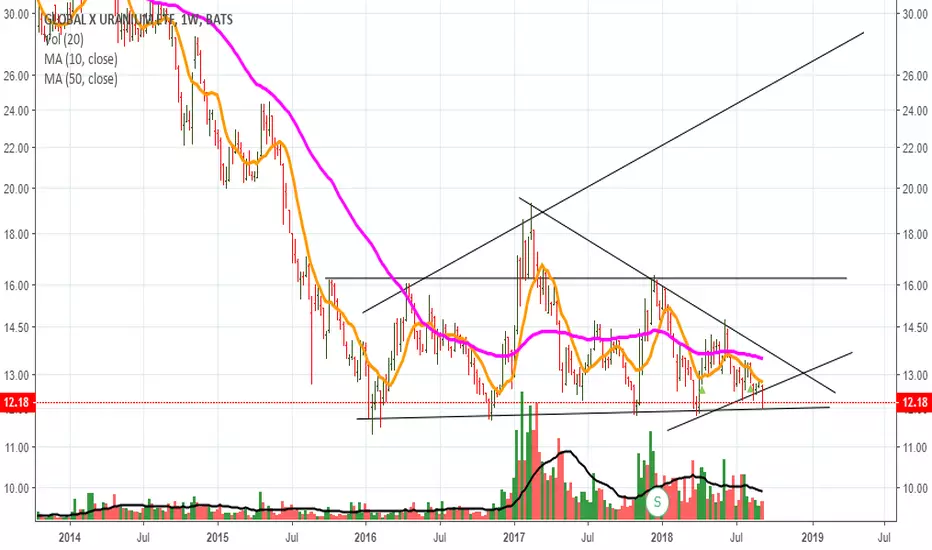
Possible Trend Reversal Expecting a Breakout SoonLooks like the bear market for Uranium ETF will be over soon. The price of URA has been in a bear market since 2011 with a high of $130 losing about 90% of it's value dropping as low as $11.25.
On October 2016 it started a small rally that ended with a shooting star candle with the 150 Weekly MA acting as resistance at the price of $19 Top.
Since then it has been forming a triangle of higher lows with the price of $11.50 acting as support.
That triangle is expected to break by late 2018 to early 2019.
As the current market conditions for commodities which overall are at the all time low, it shows chances of maximal financial opportunities.
We are currently close to test the resistance at the range of $13.75.
Breaking that level would take us to a new higher high changing the over all trend Uranium ETF.
I'm not a financial advisor, this is my personal opinion. Only invest what you can afford to lose.

Uranium Possible Play PA has found a floor after approx. year 7 year sell off. Note volume.
Possible disparity between actual value and current price ?
Monitor to see which breaks first, price floor or resisting trend line.

$URA Prolonged consolidation or bullish bias?Fundamental - uranium has declined in price from its inception because of simple supply and demand. URA has now been in a consolidation pattern since 14 Oct 2015. Supply have meet demand in the zone of primarily 11.57 to 16.31. The bullish bias comes from uranium miners first making profit when price reaches 20. Therefore some uranium miners have been shutting down their operation until a price hike. Japan could be opening new facilities to enrich they energy supply to the mainland after they haven been open to it in public forums.
First trade
A rise over 16.31 makes a bullish entry with a stop loss at 11.57 and TP levels at 20 and 23.93 (support and resistance levels formed before consolidaton formation).
Second trade
TSI supports short term bullish momentum and entry on the price now and sell if it doesn`t break 16.31!

URA long term uranium playSitting at support waiting for you to start accumulating. Uranium is a long term play, I'll hold for 10-15 years. Lot of FUD surrounding nuclear, but that will change eventually. I'll be patient.

URA buy towards the topURA has reached the low of a trading range. Now it's time to look for a break back into it and buy towards the top of that range.


URANIUM - ETF - Uranium due for a Long - The pattern will continue to form, if it breaks below lows, we sell, looking for a buy pattern in this oversold etf.


forgotten and undervalued ETFPay attention to Uranium futures, correlation is obvious but right now we have divergence which should be reduce. UX1! is very bullish.
We are 90% down from the top, descending trinagle ends in december. I think this is a good moment to get in.
SL -10%, exit in case of second Chernobyl disaster.
Peace.
RF

LONG quintuple bottomThis uranium ETF has hit its multi year support again. Long on the next 3 day high $UUUU $UEC $CCJ
URA LONGNormal descending triangle in downtrend is bad but this has held the low for a few years and is still down 90%+ from previous highest while the supply has just recently dropped by about half, so seems like a good buy to me.


$URACharting uranium is fun.
Listing around 130$ per, began to drop, respecting that best-fit line all the way down.
Ranges, ranges, dropping until we bottomed out, and have since been accumulating.
Fib extension matches perfect w/ a range I drew, RSI bouncing off support trend.
Not sure as to why we'll see 45$ again fundamentally, but the chart says it looks good.


Gap up - looking for continued bullish move in $URALooking like we'll see a gap up at open today - strong move yesterday. MACD and MA's both curling up. Should move to next Fibonacci level around ~14.20.

URA long idea (NYSE)Uranium ETF showing a nice consolidation in price. good r/r here, waiting for ultimate break out over 16.50 $URA $UUUU $CCJ $UEC
