A possible Long opportunity Hey traders,
Just spotted an opportunity to go long on Visa stock if the neckline is crossed.
V trade ideas

Visa Strong BuyVisa shows a slight oscillation after a high rise to a dip. There you will see a clear indicator of a short rise I believe there will be a three-pronged graph increase. This is a smart time to invest in Visa and will be a great investment.

VSAVSA is get up to make the gap full and the target now to make another gap full in down price , i think for surly the price should get down for that gap.

Visa on the Way Up? Visa - Short Term - We look to Buy at 217.06 (stop at 208.56)
We look to buy dips. Previous resistance level of 220.00 broken. 50 1day EMA is at 213.50. 20 1day EMA is at 213.00. The bias is still for higher levels and we look for any dips to be limited.
Our profit targets will be 236.42 and 246.98
Resistance: 237.00 / 250.00 / 260.00
Support: 220.00 / 210.00 / 200.00
Disclaimer – Saxo Bank Group. Please be reminded – you alone are responsible for your trading – both gains and losses. There is a very high degree of risk involved in trading. The technical analysis, like any and all indicators, strategies, columns, articles and other features accessible on/though this site (including those from Signal Centre) are for informational purposes only and should not be construed as investment advice by you. Such technical analysis are believed to be obtained from sources believed to be reliable, but not warrant their respective completeness or accuracy, or warrant any results from the use of the information. Your use of the technical analysis, as would also your use of any and all mentioned indicators, strategies, columns, articles and all other features, is entirely at your own risk and it is your sole responsibility to evaluate the accuracy, completeness and usefulness (including suitability) of the information. You should assess the risk of any trade with your financial adviser and make your own independent decision(s) regarding any tradable products which may be the subject matter of the technical analysis or any of the said indicators, strategies, columns, articles and all other features.
Please also be reminded that if despite the above, any of the said technical analysis (or any of the said indicators, strategies, columns, articles and other features accessible on/through this site) is found to be advisory or a recommendation; and not merely informational in nature, the same is in any event provided with the intention of being for general circulation and availability only. As such it is not intended to and does not form part of any offer or recommendation directed at you specifically, or have any regard to the investment objectives, financial situation or needs of yourself or any other specific person. Before committing to a trade or investment therefore, please seek advice from a financial or other professional adviser regarding the suitability of the product for you and (where available) read the relevant product offer/description documents, including the risk disclosures. If you do not wish to seek such financial advice, please still exercise your mind and consider carefully whether the product is suitable for you because you alone remain responsible for your trading – both gains and losses.

VISA (V) UpdatesVery positive Friday for Visa, which opens in Gap up and closes the day with an important + 10.60%.
Positive earnings and a recent drop due more to take profit and emotional sell-off on the news regarding the dispute with Amazon UK, had created excellent buying opportunities for the world's leading credit card company.
As documented in previous posts, I bought $ 212 in the area and was ready to trade at $ 190, without being executed for 10 cents ... hey, that's trading!
Now, for those who want to hold the stock for a long time, the recent upside matters to a certain extent, indeed, if it retraces it would be an opportunity to accumulate.
For those who are looking for a profit and had entered around my average purchase price or better, an interesting first level is in the $ 232 area, where we have both the POC of the last 6 months and a gap to close.
It is likely that when it reaches that level, the price will suffer and retrace.
Let's remember that, as soon as the dispute with Amazon is resolved, the action could have a session similar to the one on Friday and, of course, the opposite is also true so I recommend following the story.
Happy trading
Lazy Bull
DISCLAIMER: I am not a financial advisor nor a CPA . These posts, videos, and any other contents are for educational and entertainment purposes only. Investing of any kind involves risk. While it is possible to minimize risk, your investments are solely your responsibility. It is imperative that you conduct your own research. I am merely sharing my opinion with no guarantee of gains or losses on investments.

VisaVisa is a great stock, but everything points towards a near term drop.
1) At R1 resistance line (not pictured) with Standard Pivot Points enabled
2) Rising Wedge pattern - bearish
3) Resistance area provided by gap (see rectangle ) where no buying volume at all. It was solidly rejected yesterday intraday from this point. You can see the inverted hammer candle it left showing the rejection.
4) Chaikin Money Flow AND Chaikin Oscillator both have large divergences with price on the 4h bars. I consider these to be leading indicators.
I expect it'll drop to the $207-$209 area where there is both price action support and a daily bar pivot point . Re-evaluate from there.


V Short for earningsGave up trying to day trade long positions, decided to do an easier play
Obvious H&S for V going into earnings.

SHORTShort looks good for me #V medium risk, #options trade only #INV3ST #SHORT
timelines and options names not FFA

$V - Failed breakout with Mini head and shoulder break down What a turn of event this past 4 trading days made. From a potential break out of the wedge and inverse H&S to forming H&S and breaking down half way target of $189 - $186 area.
A gap was left behind in today's ugly session that we can look forward to filling it. Reversal in the last hour formed a hammer candle which could support reversal.
With oscillators still not turning up, as it's too early in a potential change in direction or sentiment.
Let's hope that the hammer candle play its role properly in the days to come.
———————————————————
How to read my charts?
- Matching color trend lines shows the pattern. Sometimes a chart can have multiple patterns. Each pattern will have matching color trend lines.
- The yellow horizontal lines shows support and resistance areas.
- Fib lines also shows support and resistance areas.
- The dotted white lines shows price projection for breakout or breakdown target.
Disclaimer: Do your own DD. Not an investment advice.

V - turning bearishV is exhibiting signs of rolling over for the longer term:
1. a breakaway gap break below the 200day MA on 27 Oct on high volume
(note: breakaway gap usually signify the start of a trend in the direction of the gap)
2. then finally a strong rebound on 1s December that brought it all the way back to the 200d MA but stalled just below
3. then another sell off on strong volume last Friday.
Although another short term rally is possible, it is likely to trade below the 200d MA and all rallies are suspect unless the 50day MA can trade above the 200d MA again.
Short a small position with a tight initial stop loss @ 221.50 (in view of some risks as earnings is releasing this Thursday).
Will trail stops if trade goes my way. Targets indicated are suggestion based on fibonacci extensions.
Disclaimer: TA is about improving our odds of a successful trade (not a guarantee). This is just my own analysis and opinion for discussion and is NOT a trade advice. Kindly do your own due diligence and trade according to your own risk tolerance and don't forget that money management is important! Thank you. Do give me a thumbs up if you agree. Feel free to let me know what you think! :)

Visa moving in a downtrendVisa is moving in a downtrend.
We see lower highs and lower lows.
The next target will be around 170-175.

$V Short till 215 then Long to 230NYSE:V
The Chart shows my current positions and I will post my call position when entered.
Analysis: NYSE:V had a nice run but needs to cool off test support then make its next leg up.

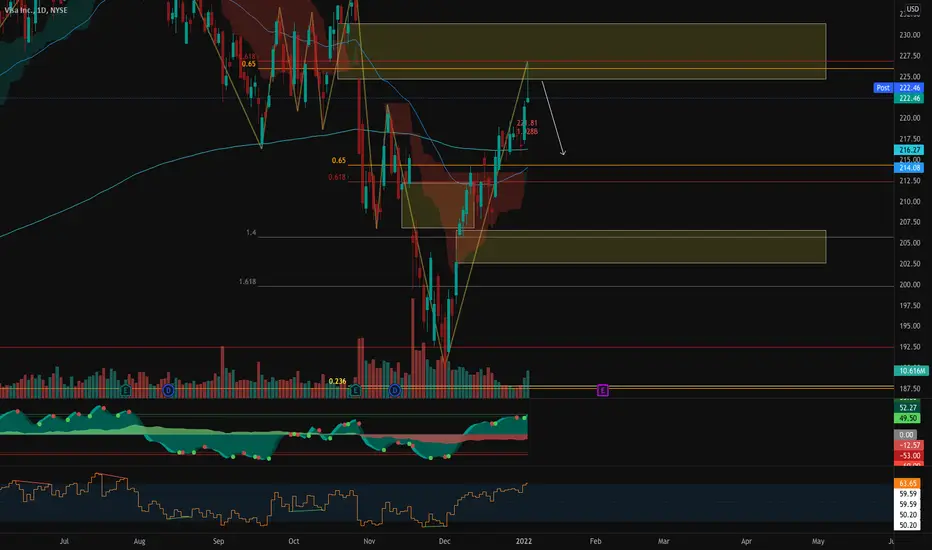
$V - Potential descending Broadening wedge breakoutIn my previous post, I mentioned that Visa has paid in full for H&S breakdown target and has potential for V bottom. It has played out and now a descending broadening wedge has been formed and the price has reached the upper trend line with potential for a breakout. There is also inverse head and shoulder forming inside the broadening wedge with the neck line at the wedge breakout area of $222 area (See yellow line). If the price break out above $222 it would mean both patterns are on the breakout. When two patterns coincide like this there is usually a stronger case for a breakout.
The inverse head and shoulder breakout target is $252 while the wedge breakout target is $280. Bear in mind that the pattern breakouts can reverse course when they hit 50% breakout targets.
Can we see a breakout? May be.
Target 1 - $236
Target 2 - $252
Target 3 - $280
Risk - failure to break above $222 and fall back to $206 area
———————————————————
How to read my charts?
- Matching color trend lines shows the pattern. Sometimes a chart can have multiple patterns. Each pattern will have matching color trend lines.
- The yellow horizontal lines shows support and resistance areas.
- Fib lines also shows support and resistance areas.
- The dotted white lines shows price projection for breakout or breakdown target.
Disclaimer: Do your own DD. Not an investment advice.

strong resistance, looking for more rejections 🚨V continues to get rejected off this strong trend resistance area. Call scalps to resistance can pay, but I am bearish until the resistance breaks.
Below 206.67 support we can target 193. That is where I will consider adding calls or shares! like and follow for more 💘

V LongDemand Zone under Support zone
Entry 212
Stop 204
Target 235
Risk management is much more important than a good entry point.
I am not a PRO trader.
In my trading plan, the Max Risk of each short term trade should be less than 1% of an account.

Buy $V - NRPicks 19 NovVisa Inc. operates as a payments technology company worldwide. It facilitates digital payments between consumers, merchants, financial institutions, businesses and strategic partners. It operates VisaNet, a payment transaction processing network.
Revenue TTM 24.1B
Net Income TTM 12.3B
EBITDA TTM 16.6B
EBITDA margin TTM 68.9%.
Debt/EBITDA TTM 1.26x

Visa drop expected short termTarget zone i son the chart and might will have a bounce from that zone. The big question is how strong the bounce will be?
Visa Thanks to an inverted H&S and a higher 10yr Visa rallied up to 225 resistance before pulling back. I dont think visa will break above 225 with higher yield movement or company news.
At 225 you have 3 resistances
1. 200sma
2.downtrend
3. fibonacci resistance
Look for a pull here possibly to 210.
Stop loss 227

VISA Reversal Head and Shoulder with Bull EMA cross (short-term)Bullish Reversal head and shoulders on the 4 hour and 1 day chart in unison with fast ema's crossing slow ema's. Hoping for quick jump to 230+ in short term. Be careful if planning on holding for long term.

Visa Head&ShouldersThis is straightforward, the head & shoulders pattern gives a good probability of strong bullish action. Visa is a safe investment from a technical and fundamental perspectives.

V Head and shoulders but the sexy kindV has a tasty looking inverse head and shoulders forming. Bears are trying to flex their muscles but if V holds 213 area it should be a nice pop up to 226

v buybuy after the break above the resistance level and 200ma at 222.73 .. first target next resistance level 234.22 .. finally target 247.00
