VTR trade ideas
Watchlist: VTRVTR came up on my stock scanner, so I'm adding it to my watchlist. I got a setup signal(1) and with above average volume(2). Looking to enter long near the close of the day if the stock can manage to close above the last candle highs(3) with a stop-loss below (4) and a price target above(5).
"Work hard in silence; Let success make the noise."
$VTR Broke Out June 29thNYSE:VTR broke out with a bullish engulfing candle on June 29. I like that breakout because of the engulfing candle, it took back the 40-week MA (White), it broke the downtrend line. NYSE:VTR was on my radar, but I missed the breakout on the 29th. I did start a ¼ sized position on the 30th on the pullback (in at 47.43). I added again today at $48.08 for a ½ size trade. This may be a little stretched for a new position here, but you may want to put this on your watchlist for any pullback / consolation entry, assuming it aligns with your trading plan. (My idea, your money). If you do wait for a pullback or a consolidation sideways, which may or may not happen, make sure you buy when it starts to move back up. I’ll look to build this to a full position on pullback or consolidation as mentioned. I don’t usually set targets, but I think this can run back to the $52 area before it hits much resistance. All TBD.
Ideas, not investing / trading advice. Thanks for looking. Constructive feedback welcome.
VENTAS Strategy DailyHey investors, VENTAS is giving a bullish hammer candle signal with normal buy volume executed in this situation. We can have a bullish push to move towards the next high and if buyers have risk appetite. They can go to fill the bullish gap to seek in this one the highest which corresponds to the low of the previous higher.
Please LIKE & FOLLOW, thank you!
PREDICTION 1 - USA STOCKS - VENTAS INC. -VTR - PROFIT = 5,90%Hi Followers,
Welcome to my page,
I will be posting 10 charts on USA #STOCK #MARKET this month.
Using a Unique Technical Analysis, invented by me.
Later one, if charts work on stocks, later I will talk more about it.
As far as our technical Analysis is identifying there is a big possibility that this company is oversold, and that a double bottom just happened, which opens a trade opportunity.
This could be an over 5% profit trade and could end between Dec 15th to Dec 31.
The company #Ventas Inc. - #VTR #NYSE is an S&P 500 company #SPX500, is a leading real estate investment trust. Its diverse portfolio of approximately 1,200 assets in the United States, Canada, and the United Kingdom consists of seniors housing communities, medical office buildings, university-based research and innovation centers, inpatient rehabilitation and long-term acute care facilities, and health systems. Through its Lillibridge subsidiary, Ventas provides management, leasing, marketing, facility development, and advisory services to highly rated hospitals and health systems throughout the United States. References to Ventas or the Company mean Ventas, Inc. and its consolidated subsidiaries unless otherwise expressly noted.
Good Luck and Good Profit
Ventas Inc - Bullish defensive ideaVTR is real estate investment trust (REIT). The technicals are great (check chart).
Market analysis:
Generally after an inversion in a yield curve , the following sectors tend to outperform the market:
XLU (Utilities)
XLRE (Real Estate)
XLP (Consumer Staples)
The following tend to underperform :
XLK (Technology)
XL (Industrials)
XLB (Materials)
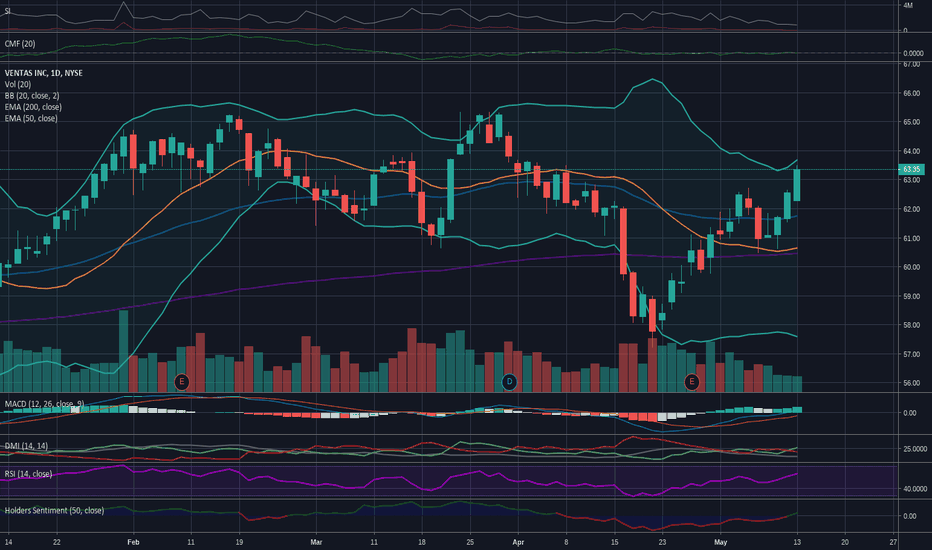
Ventas: Three White Soldiers for this Healthcare REITVentas is looking good, and the older generation continues to require healthcare no matter the prevailing market conditions. This healthcare REIT focuses on senior care, healthcare services, and medical research and laboratory facilities. These are all fairly inelastic demand services, and have very little impact from international trade. This is a great safe harbor for capital until this trade war gets worked out eventually.
Technicals look good with a very clear three white soldiers doji pattern showing up. MACD just broke positive on a strong upward histogram, and the price is starting to walk up the top Bollinger band. The 20 day average dipped below the 50 day average, but appears to be rebounding strongly off the 200 day average like bouncing off a resistance level. ADX is showing that a trend has yet to be shaken out with DI+ only starting to overcome DI- from an earlier consolidation period over the past month and a half. RSI is rising but not yet overbought, and the 50 day holders sentiment is turning positive again. Money flow is somewhat flat, but I expect more desk traders buying into here as they run their screens and look for where to invest the capital they got stopped out of their other strategies.
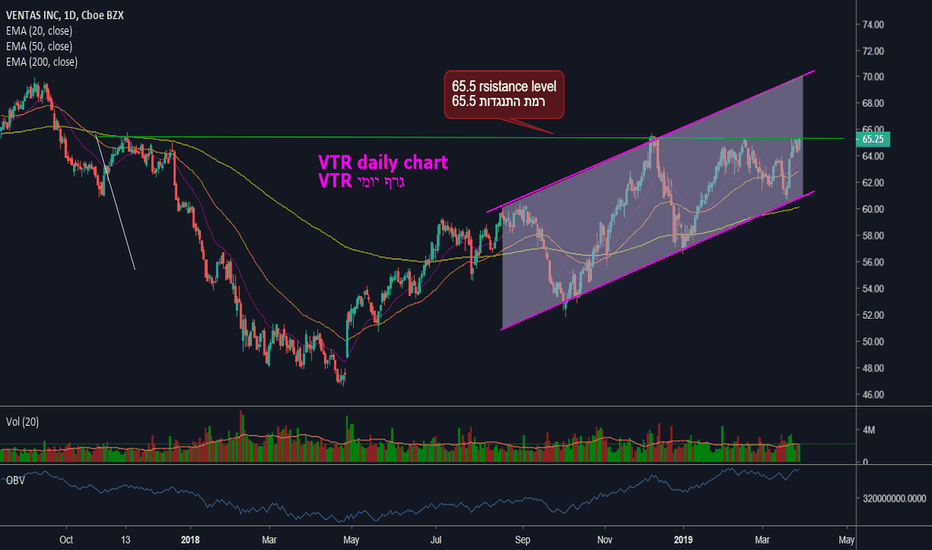
VTE - Long above the breakout of 65.5VTR – finance sector
moving averages support the proposed direction: a moving average 20 is accompanies its up trend and a moving average 50 is below it
resistance level at 65.50
first target would be 69
the volume is good, still, it wouldnt hurt to see more volume coming in.
obv is high.
in my opinion its worth following it above 65.5
if a breakout occurs, at least technically, the way is open to further increases toward 69 as mentioned before..
this is not a recommendation to buy or sell,
also, feedback is always welcome..


