Verizon Communication, week#26If it close above $35.81 next week, let's add some of its shares
But, if it breaks $35.01 hold your cash
VZ trade ideas


VZ | After a Correction Near 35.5 VZ May Rise AgainVZ | After a Correction Near 35.5 VZ May Rise Again
At the beginning of June-22 Verizon Communications completed a perfect harmonic pattern.
Considering how the price reacted after the pattern completion this is increasing the chances that after the price will create any small correction near the 35 - 35.5 price zone it may rise again.
So let's see what will happen during the coming days.
Thank you and Good Luck!

Bullsh Divergence Verizon WeeklyBullish div on weekly chart, bullish divergence on many indicators:
EFI, MACD-H, mLines potentially, ATR Price channel difference
Entry: 35,64
TP1: 38,8
TP2: 39,56
SL:34,2
R/R:
TP1: 1: 2,2
TP2: 1: 2,7

VZ (Verizon Communications Inc.) Buy TF M15. TP = 35.31On the 15 minute chart the trend started on June 2 (linear regression channel).
There is a high probability of profit. A possible take profit level is 35.31
But do not forget about SL = 33.70
Using a trailing stop is also a good idea!
Please leave your feedback, your opinion. I am very interested in it. Thank you!
Good luck!
Regards, WeBelieveInTrading

$VZ - Head & Shoulders Continuation Base Breakout1. Price trading below the key EMAs, which are sloping downwards.
> This market is in a confirmed uptrend
> Our bias is to look for short opportunities.
2. Head and shoulder base formed since October 2022, against the 50 EMA.
3. Breakout from this pattern near the 10 EMA value area, 2 weeks ago.
4. Wait for a qualified trigger to enter short. This could be a retest of the 10 EMA + break of structure in the lower timeframe or an ostensible rejection candlestick in the current timeframe.
5. Take profit: in the highlighted area, which is the upcoming congested area as draw by a volume profile analysis in the higher timeframe.
6. Stop loss: rough 1 ATR below the 10 EMA
0. No line drawn on an chart will enable you to predict the future. That's not what is being done here. This exercise is about stacking odds on our side. And let me tell what, even the best odds can entail that there is a high likelihood that your next trade is a losing trade. Therefore, more than drawing lines on a chart, abiding by diligent risk management principles is of the essence. Trade small, diversify, do not overexpose your portfolio. Rules of thumb like do not put at risk more than 1% of your equity in any single trade and more than 30% of of your equity at risk at any given moment. Only by staying alive will enable to you to be exposed to luck (yes! you bet your ass it plays an overwhelmingly underestimated role)
and good odds.
Cheers,
Tenacious Tribe - Backtested, Quantified Trading Strategies

Bottom in sight far in the VerizonSorry for the bad pun, couldn't resist.
Verizon has obviously been having a hard time.
We're seeing a consistent markdown approaching into the low from 1996 that has held price up for decades now.
It pays ~7% and Verizon isn't going anywhere.
A worthy addition to the turbo boomer dividend account if you're patient.

Bottom visible far on the VerizonPardon the silly pun.
VZ is about to touch the all-time 1 sigma from the listing vwap. This happens to coincide with the level that's been holding it up since 1996.
This pays 7% and is probably going to be important in the coming months.
Verizon isn't going anywhere.

VZ (Verizon Communications Inc.) LONG TF = H1, TP = 37.29On the hourly chart, the trend started on May 18 (linear regression channel).
There is a high probability of profit. Possible take profit level is 37.29
But do not forget about SL = 35.71
Good luck!
Regards, WeBelieveInTrading

Verizon in a Great Accumulation zoneVerizon NYSE:VZ appears to be entering a good accumulation zone. it also pays a good dividend. This is one i plan to accumulate going into the down turn. NYSE:VZ

VZ Verizon Communications Options Ahead of EarningsIf you haven sold VZ here:
Then analyzing the options chain of VZ Verizon Communications prior to the earnings report this week,
I would consider purchasing the 37usd strike price Puts with
an expiration date of 2023-5-19
for a premium of approximately $0.84
If these options prove to be profitable prior to the earnings release, I would sell at least half of them.
I am interested to hear your thoughts on this strategy.

VZ cup and handle !A cup and handle formation following a Harmonic Gartley Pattern .
This might be a signal of continuation to the upside targeting 44.5 area .

Watchlist 2023-04-06 $SPY $XLC $T $VZ $LITE $KRE $LEVI $KCSPY - pointing lower this morning. Some economic news to be released including nonfarm payrolls, expt 200K. Failure to close above 408 on the 15 min early on would give confidence that we move lower today.
For further confirmation of a trend day, watch for:
$ADD pinned near +\-2000
$VOLD ratio over +/- 3
$TICK cumulating past 0 wicking to +/-900
$XLC - had an unprecedented high vol bar into resistance PD. Roughly 10x the average vol. Because this was into key pivot resistance, expecting lower moves in the communications sector today. $VZ $T. if the spreads aren't too wide, might be best to use options with these to not take up purchasing power as the ATRs of these names are low relative to their price. Verizon also had 12/14 previous bars were green, could likely be due for a pullback here.
Support area is 38.50.
Other communications sector strength includes
$VOD - attaching takeover interest.
$LITE - Rosenblatt Downgrades Lumentum to Neutral From Buy, Cuts Price Target to $48 From $77. down 4.5 ATRs on 0.5 PM RVOL. If it continues to hold lower levels in the PM, a break of 43 could lead to 40 key support. But staying cautions as vol needs to pick up.
$KRE - Watching closely to see how it reacts to 41.30 ATL. If vol picks up and there is a weak bounce on the 5 min, could see lower levels in play. However, this may need a catalyst to move below so I'm open to a long from this level as well. We have see complete reversals from this level on March 23.
Other Watches
$LEVI - Adjusted Earnings Decline, Revenue Rises; Maintains Fiscal 2023 Outlook, Quarterly Dividend
$KC - Kingsoft Cloud's Q4 Net Loss Widens Slightly, Revenue Falls. This news was bullish on March 29 but weakness has continued since.
$CVNA - over 10.30

VZ DEEP VALUE AT 27Short term technicals showing this will likely sell more if the markets turn farther. Dips below the 200ema Monthly have previously marked great buy areas. PE @ 27 based on forward earnings projections. 9.5% yield based on no change assumption. Nations leading 5g provider targeting quality customer base commercial and residential. 5g is an under rated play no one is thinking about right now, as it is needed for all high-speed data systems, ai operations, and military applications.

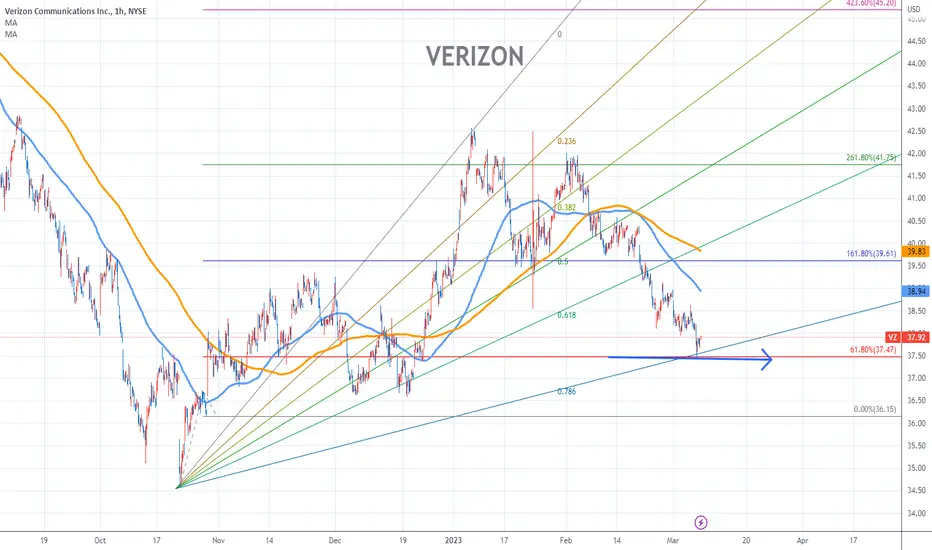
VERIZON Stock Chart Fibonacci Analysis 030723 1) Find a FIBO Slingshot
2) Check FIBO 61.80% level
3) Entry Point > 37.5/61.80%
An Introduction to Trading the Markets Part 1 - FINDING TRADESPart 1 of a 3 part Tutorial - Finding Trades. In this tutorial I help the beginner find trades on a chart by helping to understand Highs and Lows; Supply and Resistance; Climactic action; Tests; the importance of Volume; Market Mechanics.If you know where to look, you'll learn where to find trades with a higher probability of success! Happy Trading

VZ - Bounce from RTS & Breakout from consolidationNYSE:VZ - Verizon touched Resistance Turned Support (RTS) and broke above downtrendline. Formed 2x Highs.
RSI managed to bounce on 50 , making higher low , indication of upside movement.

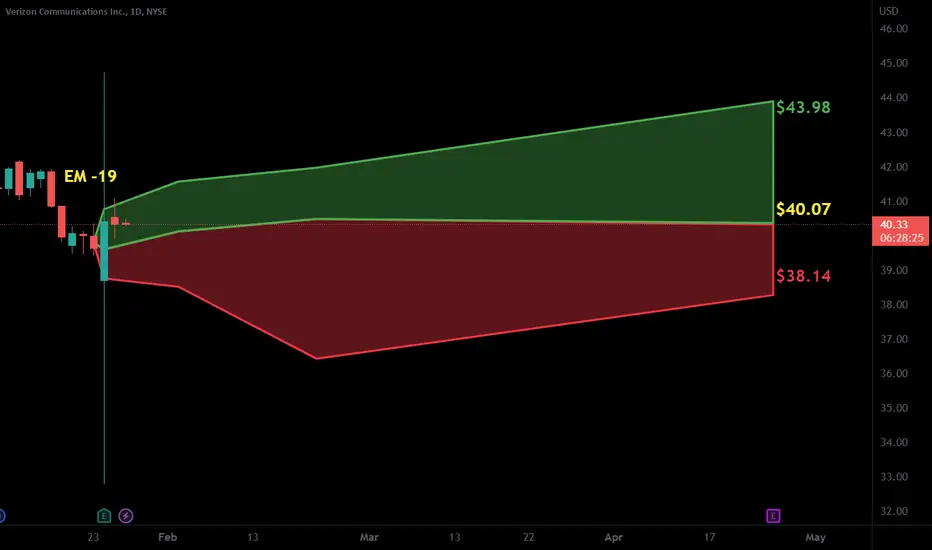
$VZ with a Neutral outlook following its earnings #Stocks The PEAD projected a Neutral outlook for $VZ after a Negative over reaction following its earnings release placing the stock in drift C with an expected accuracy of 66.67%.
VZ Going for a swing trade on $VZ , no time frame. Verizon and 5G towers have no new competition, people need to communicate. Only derivative of smart phones coming out is crypto native Solanas saga web3 phone , which will take awhile for mass adoption and that's if it even succeeds. looking for sure things to store fiat in other then gold.

Bull flag pattern VZ is setting up for a nice bull flag that could surely take us higher. As long as the pattern and all supports are respected I think this will be a good trade to take.

Verizon Coomunications $VZI am looking for a pull back to get in. This is my set up at the moment.
Entry; $39.40
S/L; $41.18
TP1; $41.18
TP2; $43.85
Please always do your own search and analysis before you take any trade. Do not rely on anyone :)

Is Verizon Bouncing For Good?NYSE:VZ is bouncing back from the double top target.
it has a target of $ 35.70 and it has been touched on October 2022.
The weekly chart stochastic has been successfully break out from value 50 for a consecutive week.
In 4H Chart, the formation of the candle is forming a Ascending Triangle with Upper Breakout which indicate a Short Term Bullish Reversal with neckline at $ 39.38 - $39.85 (as our new support).
I think it is worth to wait on its neckline for entry, since the stochastic also indicate a oversold area where %K line Crossing Up %D line several time.
Or, you can use EMA200 value for your entry position with stop loss at $ 38.59 (last swing support at $ 38.62 - avoid setting stop loss at psychological price at $ 38.60).
or When Stochastic %K Line is crossing down 50 you may exit from a long position.
For your additional information, you may check big ETF Communication Sector and you can see that this sector has been dropped quite significant since last year.
Disclaimer is always on.
Your Trade, Your Risk.
I do not have any possession in NYSE:VZ stock in my current portfolio.

Verizon (VZ) bullish scenario:The technical figure Triangle can be found in the daily chart in the US company Verizon Communications Inc. (VZ). Verizon Communications Inc., commonly known as Verizon, is an American multinational telecommunications conglomerate and a corporate component of the Dow Jones Industrial Average. Verizon's mobile network is the largest wireless carrier in the United States, with 120.9 million subscribers as of the end of Q4 2020. The Triangle broke through the resistance line on 23/12/2022. If the price holds above this level, you can have a possible bullish price movement with a forecast for the next 29 days towards 40.32 USD. Your stop-loss order, according to experts, should be placed at 36.58 USD if you decide to enter this position.
Verizon is expected to post earnings of $1.21 per share for the current quarter, representing a year-over-year change of -7.6%.
For the current fiscal year, the consensus earnings estimate of $5.18 points to a change of -3.9% from the prior year. Over the last 30 days, this estimate has changed -0.1%.
For the next fiscal year, the consensus earnings estimate of $5.05 indicates a change of -2.6% from what Verizon is expected to report a year ago. Over the past month, the estimate has changed -1%.
Risk Disclosure: Trading Foreign Exchange (Forex) and Contracts of Difference (CFD's) carries a high level of risk. By registering and signing up, any client affirms their understanding of their own personal accountability for all transactions performed within their account and recognizes the risks associated with trading on such markets and on such sites. Furthermore, one understands that the company carries zero influence over transactions, markets, and trading signals, therefore, cannot be held liable nor guarantee any profits or losses.
