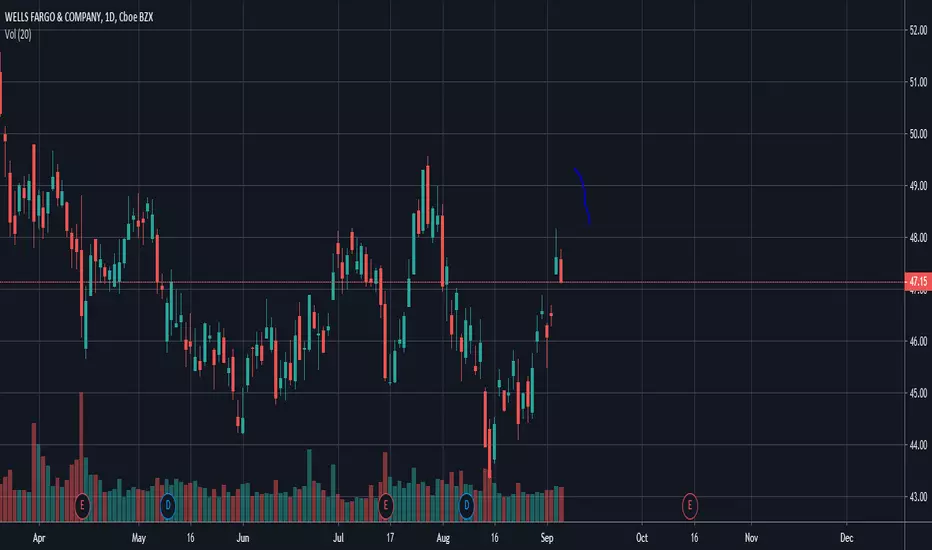
WFC bear channelWFC is in a bear channel and it's right at the resistance.Look to sell after the counter trend line break in 1h
WFC trade ideas

WFC Share prices breaks 45.45 barrier WFC - Wells Fargo share prices have a similar path as its peers but more aggressive since stepping into the price channel and making higher highs and higher lows as indicated on the chart. Share prices fell in the opening trades on Tuesday from its previous close at 46.55 to around its lows at 45.45; however, share prices recovered some of its losses and closed the session above 46.09 down 1.03%.
WFC share prices have shown lots of determination in the last two weeks pushing prices up, breaking resistance, and holding above a strong resistance trend highlighted in red on the chart. Share prices need to remain above 45.44 to continue its recovery.


WFC In Falling section of high risk & low profit 19-JUL
www.pretiming.com
Investing position: In Falling section of high risk & low profit
S&D strength Trend: About to begin a rebounding trend as a downward trend gradually gives way to slowdown in falling and rises fluctuations
Today's S&D strength Flow: Supply-Demand(S&D) strength flow appropriate to the current trend.
Forecast D+1 Candlestick Color : RED Candlestick
%D+1 Range forecast: 0.9% (HIGH) ~ -0.7% (LOW), 0.0% (CLOSE)
%AVG in case of rising: 1.2% (HIGH) ~ -0.6% (LOW), 0.5% (CLOSE)
%AVG in case of falling: 0.7% (HIGH) ~ -1.5% (LOW), -1.1% (CLOSE)
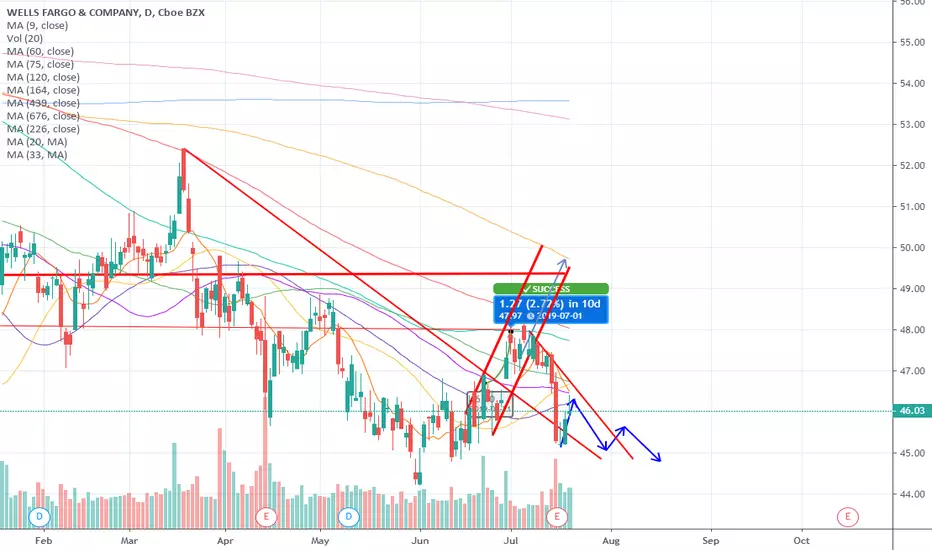

Wells Fargo looking southLike nearly all the other financials on Wall Street did NYSE:WFC not enjoy Friday. Gap up above the prior high, but then the turnaround. Which, in combination with the uninspiring volume lately, makes me a shortie with a nice RRR of 4.5. But beware of the earnings on the 16th.

WFC SHOWN A CLEAR H&S PATTERNFRIENDS WE SAW A SUCCESSFUL HEAD AND SHOULDERS PATTERN NOW IF THE PRICE GONE BLOW THE SUPPORT LEVEL 43.69 SO THEN IN MY OPINION FASTLY IT WILL TOUCH THE NEXT SUPPORT LEVEL OF 31.50.


WFC Possible Earnings PlayMassive H&S
Fed Cap on Growth
Interest Rates Decreasing
Cannot Recruit Proper Talent
Warren Buffet Selling
Customers Leaving
Puts? :) NYSE:WFC

Wells Fargo (WFC) buy signalsWells Fargo (WFC), Weekly chart: Mirror level + Extended divergence on RSI(14)

Daily WFC forecast analysis report by Supply-demand strength.03-Jul
Price trend forecast timing analysis based on pretiming algorithm of Supply-Demand(S&D) strength.
Investing position: In Rising section of high profit & low risk
S&D strength Trend: In the midst of an upward trend of strong upward momentum price flow marked by the temporary falls and strong rises.
Today's S&D strength Flow: Supply-Demand strength has changed from a strong selling flow to a suddenly strengthening buying flow.
read more: www.pretiming.com
D+1 Candlestick Color forecast: GREEN Candlestick
%D+1 Range forecast: 1.7% (HIGH) ~ 0.2% (LOW), 1.3% (CLOSE)
%AVG in case of rising: 1.4% (HIGH) ~ -0.5% (LOW), 0.9% (CLOSE)
%AVG in case of falling: 0.6% (HIGH) ~ -1.3% (LOW), -0.6% (CLOSE)
WFC Head and ShouldersWFC has developed a head and shoulders pattern on its weekly chart. Each shoulder has made up 1/3 the range ($6) of the head, which is typical. Typically if this breaks down out of the head and shoulders pattern, we can look for 1/3 range to the downside which would put us in resistance right around the $41 to $39 range.

Daily WFC forecast timing analysis by Supply-Demand strength21-Jun
Investing strategies by pretiming
Investing position about Supply-Demand(S&D) strength: In Rising section of high profit & low risk
Supply-Demand(S&D) strength Trend Analysis: In the midst of an upward trend of strong upward momentum price flow marked by the temporary falls and strong rises.
Today's S&D strength Flow: Supply-Demand(S&D) strength flow appropriate to the current trend.
View a Forecast Candlestick Shape Analysis of 10 days in the future: www.pretiming.com
(You can easily create a trading plan.)
D+1 Candlestick Color forecast: GREEN Candlestick
%D+1 Range forecast: 1.2% (HIGH) ~ 0.0% (LOW), 0.8% (CLOSE)
%AVG in case of rising: 1.3% (HIGH) ~ -0.5% (LOW), 0.9% (CLOSE)
%AVG in case of falling: 0.5% (HIGH) ~ -1.2% (LOW), -0.6% (CLOSE)
Price Forecast Timing Criteria: Price forecast timing is analyzed based on pretiming algorithm of Supply-Demand(S&D) strength.

this one is my long term investment.. no stop out, only long!this one is my long term investment.. no stop out, only long!

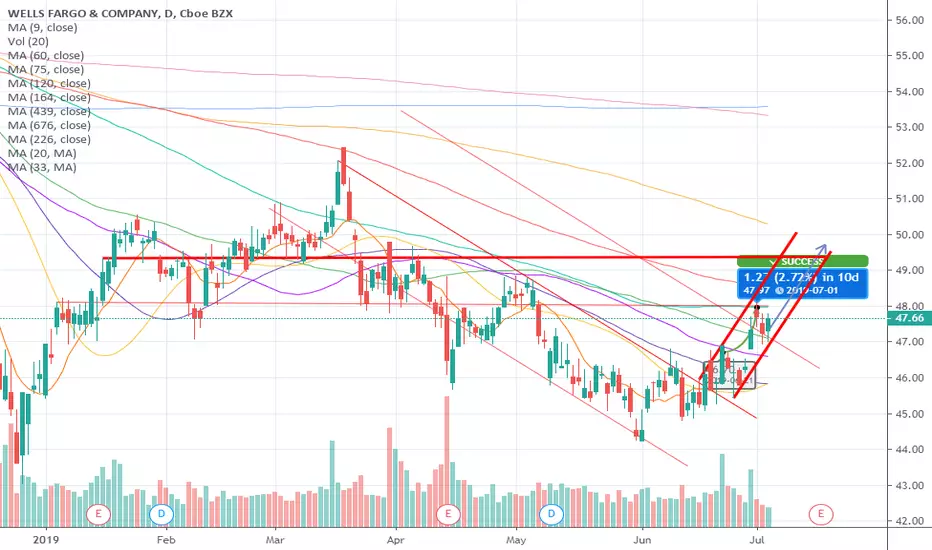
Breakout ConfirmationThe weekly candle closed verifying the breakout of a bull flag previously mentioned (see linked below).


Wells Fargo Short PossiblityThe chart shows a massive H&S for $WFC.
NYSE:WFC
The weekly chart shows a target of ~$40.
Lower time frame shows a target of $44.
Please let me know what you think of my analysis.
Thanks for visiting.

Nice Swing Trade On The HorizonThis is the week to watch. If the weekly candle closes above the parameters of the bull-flag then buy the breakout. If the breakout doesn't occur until next week's candle then the target area would change. And of course if it drops below the parameters of the bull-flag it becomes a breakdown and voids the trade all together....good luck (well wishes NOT financial advice).

Will you miss your chance?We haven't seen WFC this low in 3 1/2 years; this is a very good values investment (in spite of the last weeks news; see linked below for more) and we currently have a bullish three inside up candlestick pattern on the daily (basically a bullish harami with added daily confirmation), and the current prices could disappear quickly and not be seen again for many years to come. BTW some WFC ratings are suddenly being upgraded again (imagine that). I think it has FINALLY started to dawn on savvy investors that this might really be one those "buy when others are scared" moments and too late may be soon upon us. Is it time to test your metal?
This is not financial advice so please do your own homework and good luck with your investments and trades.

WFC: Ran down ahead of today's earningsWFC reported its 1st quarter earnings today, on Friday. The run down ahead of earnings was a technical pattern that indicated the stock was at risk of a run or gap down. WFC ran down as the market opened due to a weak report.

All Good News For Wells FargoIn light of recent woe 's, and Tim Sloan's recent retirement "Wall Street’s most bullish Wells Fargo & Company (NYSE:WFC) analysts are predicting the share price to blow past $66 per share during the next 12 months. The current median share price forecast by them is $56, suggesting that the stock could increase 14.8% in that time frame. The average price target of $56.83 calls for a nearly 16.5% increase in the stock price." (NGVTimes)
I'm sure Mr. Warren Buffett (Their largest shareholder) couldn't happier as he advises WF to look for anew CEO beyond Wall Street this time around.
Though the current price is below the 20 and 50 day MA, the price did start the week in an upward motion, the RSI is trending upward, and it does look like we're entering into a MACD bull cross. The news seems to be positive as well; my daily research has revealed that at least one of the top 6 investment newsletters recommended by Marketwatch (hard to get more info without subscribing to them) has assigned WCF a designation of "buy" this month with a near target of 51.32. I was satisfied enough by last nights findings alone to enter into a small position this morning, and I'll likely add to it in the very near future.

Watch That RSI and MACDLooks Ready for a bullish cross any time....who know maybe first thing in the morning (or not but it's getting hot). When the RSI crosses the neutral zone (50), it should go bullish and there is a lot of room to the top of the BB's. This could turn into a great swing trade so keep your eyes on it folks.
