XBI trade ideas


XBI Biotech breakout/further upside after slight retraceWhat the title says. Could be an ascending triangle or descending triangle breakout. Oddly enough, both Measured moves fall at the same price level.


DESCENDING TRIANGLE We are humans and before going forward we like to test and retest ...This time is not different and the momentum on the daily is starting it is transition into negative territoty + bearish macd crossover...
I open a long position in $labd yesterday but the drop in $xbi will not come until next week..Friday should confirm the berish trade setup and i will be ready to increment position depending on the situation...I have a very tight stop loss and everyone should manage risk/reward before buying so play safe.
$Labd

Give me my discount!!Last time i miss the entry because i did not complay my rules of eliminating noise... I did not analyze the big picture first...
This time is different and i am ready for a short position and get disscount iN the process...
Levels to watch:
77.02,75.69 -73.49

Biotech 2 PathsI see a descending triangle. These are the paths for both the bearish and the bullish continuation that we might see next week.
Red = Bullish
Blue = Bearish

XBI: Biotech slide back to channel bottom until End-JulyXBI, LABU, BIB should slide to the bottom of the channel until End-July. See high moving-average divergence, reconvergence and channel pattern. Short unless something changes.

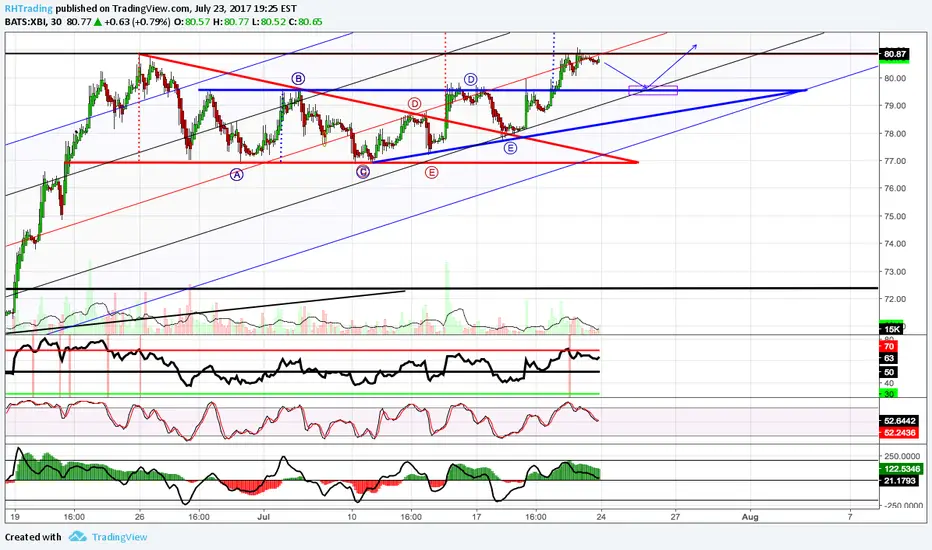
Biotech 3 Predicted Price Paths - Video Analysis IncludedGoal is not to be correct, goal is to be prepared. There's evidence of 3 predicted price paths as far as I can see.
Descending bullish triangle would lead to upside and would give evidence that this is the 4th (corrective) wave in the elliot wave and complete an ABCDE before the final 5th wave. ( Bull )
Flag pattern would lead to downside in the near term before breaking out and this would also support the 4th (corrective) wave theory in the elliot wave and complete an ABC before the 5th wave. ( Bear then Bull )
Last pattern is that this might be a bull trap, or we might not hold the medium term support line on our way down and fall further than the other two possibilities. ( Bear )
This week's Video Analysis: www.youtube.com

Biotech 3 predicted price pathsGoal is not to be correct, goal is to be prepared. There's evidence of 3 predicted price paths as far as I can see.
Descending bullish triangle would lead to upside and would give evidence that this is the 4th (corrective) wave in the elliot wave and complete an ABCDE before the final 5th wave. (Bull)
Flag pattern would lead to downside in the near term before breaking out and this would also support the 4th (corrective) wave theory in the elliot wave and complete an ABC before the 5th wave. (Bear then Bull)
Last pattern is that this might be a bull trap, or we might not hold the medium term support line on our way down and fall further than the other two possibilities. (Bear)

Iron Condor on XBI with a slight negative assumption.Decided to deploy a slight negative to neutral bias August18th Iron Condor option on XBI. 30 Day IV rank 84.952%
The strikes are as follows. The Sell side is a 10 point spread of 74(.24 delta) Put / 84 (.30 delta) Call. The buy side options at the 72 and 86 strikes respectively.
Premium collected was .90 cents per share which and will look to cover position between 40-50% max profit of 90 cents.

XBI Failed MoveXBI has been in a strong uptrend recently. For the past few days its been consolidating around 79.5. And I'm hoping to trap some of the buyers that took a long position on the move higher this morning.

XBI: The bear's been shotAnd I hope you all have fresh felts hanging from your walls. Recall 3 weeks ago I shared a long strategy from $68.50. XBI found critical medium-term support at $66.66 and is up 20% since the 5/31 low.
For wave counters, we are ostensibly in minute-3, of micro-3, of intermediate-3 of primary wave-5. After consolidating and forming a base from late March - early June, XBI broke-out and is a solid long > $73.20.
However, short-term, XBI is testing the upper trading channel and faces significant overhead resistance at $80.50. I'm looking to buy any pull-back between $75-77 and do not expect it trade under $73 in the short to medium term.
Short-term: may have topped, consolidation into support
Medium-term: min. price target of $88.49 into fall
Long-term: min. price target of $93.68 into early 2018


Long XBI and QQQXBI breaking out of a rectangle, after breaking out of a triangle, coinciding with QQQ boucing off 50ma. Both targets are around $80
After watching this intraday I see no indication of slowing down.
The trend has been very strong in the market, volatility is amazingly low, and hardly anybody trusts the market on a fundamental basis. Macro data continues to disappoint. So, plenty of buyers left, plenty of reason for the Fed to cut rates/resume QE, plenty of fuel for a bubble.
Raised stops to above breakeven on TQQQ.
Adding XBI here. Stop slightly below a backtest of the rectangle.

TRIPLE TOPXBI UPTHRUST CAUGHT A LOT OF PEOPLE WITH THE GUARD DOWN BUT BEARISH DIVERGENCE WAS A WARNING FROM THE START..
Everything happen so fast when xbit started to plunge after IDMC recommends ending late-stage trial of colorectal cancer treatment and this event that happened at 2:40pm on friday overturn $xbi at the same moment and now is going back to 400 EMA $67..
STOCHASTICS OVERBOUGHT AND HEIKI ASHI BEARISH CONFIRMATION + MOMENTUM GOING INTO SELLING MODE +MACD CROSSOVER
BIG INTEREST PLAY THE 300 , 400 EMA ... WATCH SMALLER TIMEFRAME FOR A FASTER CONFIRMATION BUT IN MY OPINION IS NOT GOING TO HOLD...


SHORT biotechLooks like it may head down to lower trend line. will watch for breakdown there. Low risk here with tight stop(3.5%) via $LABD

What's up with Biotech?Bring back technical analysis . Too often I've been seeing people just posting a picture of the price action and then an arrow going up or down with the title "Long UVXY" or some garbage like that. Nobody gives two farts about whether or not you entered a position. Show me some fibonacci. Show me some technical divergences. Show me some diamond bottoms. Show me something. I don't care if we're on the same side of the trade, or on opposite sides, but at least justify your position?
If you don't have anything to add to the conversation, don't detract from everyone else's by humming.
#BringBackTechnicalAnalysis
Biotech is creating an extremely challenging chart to follow because it's charting clear patterns on different timeframes, but the patterns are opposite each other. For example here on the daily I've got a pretty smooth cup and handle. But on the 2hr I've got it reaching the end of an ascending wedge.
Conclusion:
Short term - Bear
Medium term - Bear?
Long term - Bull?


XBI$XBI has fallen twice now due to a ascending wedge. I believe we have reached the peak of the 3rd. There is strong resistance which the price was rejected off of. There is a significant divergence on the 4 hr chart marked by the purple line. There has been an increased number of divergences on lower timeframes as we reach the end of this suggested pattern. The video I provided goes into a far more detailed explanation across a range of different timeframes. www.youtube.com
Conclusion:
Short term Neutral
Medium term Bearish
Long term Neutral
www.youtube.com
